
ABSTRACT
This study analyzed the genetic diversity and structure of two Bulgarian indigenous sheep (Ovis aries) breeds – Kotel and Teteven, each presented by 4 flocks, using 15 microsatellite markers. A total of 195 alleles were identified. Among the markers used, the most informative were INRA5 and OarFCB20 with PIC values of 0.87. Both breeds showed a high level of genetic diversity with average values of He and Ho, respectively 0.74 and 0.76. The observed high level of genetic diversity is combined with the absence of heterozygous deficiency reported as Fis values of 0.04 and 0.07, respectively for Kotel and Teteven breeds. Low level of genetic differentiation between the two breeds was observed, as evidenced by the low value of Fst of 0.09, and analysis of variance (ANOVA) data showing that only 9% of the total variation is due to variation between breeds, whereas 91% is due to variation within breeds. Furthermore, we revealed a breeding practice that comprises an exchange of animals between the breeds which reflects in the clustering obtained by STRUCTURE analysis. According to it, Kotel breed is a more homogenous population and forms cluster 1, whereas Teteven breed is more heterogenous and consists of two subpopulations that form two distinct clusters. The results obtained in the present study confirm the high potential of microsatellite markers in studies related to both breed affiliation and purity and can serve as a basis for the implementation of future management and conservation programs of these indigenous breeds.
Introduction
Recent studies in livestock genetic resources in Europe unambiguously emphasize the importance of local breeds for maintaining genetic diversity in order to respect different production, cultural and region needs [Citation1]. Local livestock genetic resources are important sources of genetic variation for providing genetic improvement, preventing diseases and loss of genetic diversity [Citation2]. Diversity of indigenous breeds contributes significantly to both national and regional food quality and variety. In this line, the conservation and sustainable utilization of farm animal genetic resources are of vital importance. Knowledge about the genetic diversity of a population is a crucial parameter for the implementation of successful genomic selection and conservation of livestock genetic resources. The ability of the genetic assignment of individual members to a target breed is essential to the success of the conservation initiatives. It should be based on in-depth knowledge of the genetic resources of the specific breed [Citation3]. Therefore, it is important to genetically characterize indigenous breeds using the recent advantages of molecular marker techniques.
Microsatellite markers (SSR, simple sequence repeats) have been extensively used for characterization of genetic diversity of indigenous breeds because of their high degree of polymorphism, co-dominant inheritance, locus specificity and extensive genome coverage. Recently, microsatellite markers were successfully applied for characterization of sheep (Ovis aries) genetic diversity, population structure and genetic differentiation, aiming development and application of genetic conservation strategies in different European countries like Austria, Hungary, Italy, Spain, Switzerland, [Citation4–9] as well as in the countries from the Balkan Peninsula like Greece [Citation10–15].
In Bulgaria, sheep breeding is the most ancient branch of animal husbandry. Despite its relatively small territory, the country has a rich diversity of autochthonous domestic livestock breeds, of which seventeen are local sheep breeds [Citation16–17]. These breeds are well adapted to the various climatic conditions of the country and they represent a reservoir of important genes in breeding programs under the changeable climatic conditions in recent years. They have been phenotypically described and characterized, but these data do not give information about genetic variability within and between studied breeds which is important for their preservation. In Bulgaria, microsatellite markers were used for the first time in sheep with the aim to determine genetic relationship and genetic structure among 7 indigenous Bulgarian sheep breeds in order to facilitate and plan their sustainable development, utilization and conservation [Citation1, Citation18]. However, there is still lack of information about the genetic diversity and structure of the remaining 12 indigenous sheep breeds which is important for their effective preservation and conservation.
The objective of this study was to assess the genetic diversity of two indigenous sheep breeds in Bulgaria, namely Teteven and Kotel and to determine the genetic structure of two populations. In addition, the purity and assigning of animals of several flocks to a specific breed is discussed.
Materials and methods
Sampling and DNA extraction
Ninety-six blood samples were collected from two indigenous sheep breeds, of which 48 were from Teteven and 48 were from Kotel sheep breeds. The breeds have different habitats in the region of the Balkan Mountains in Bulgaria. Teteven and Kotel breeds belong to long, thin-tailed group of sheep breeds. The main area of Teteven breed distribution includes the Central Stara Planina (Balkan Mountains) near the town of Teteven and the villages of Ribaritza, Cherni Vit, Golyam Izvor and Galata. Kotel breed is a representative of the sheep of the Tsakel type. The area of distribution is in the mountainous and semi-mountainous regions of Kotel Mountain and the adjacent territories.
Each sheep breed was presented by 12 unrelated individuals of 4 independent flocks. Genomic DNA was extracted using DNeasy Blood & Tissue Kit (Qiagen) according to the manufacturing instructions. The isolated DNA samples were assessed for their quantity and quality by spectrophotometric measurements (NanoDrop Thermo Scientific, Wilmington, DE) and were checked through electrophoresis in 0.8% agarose gel.
Microsatellite amplification
A total of 15 microsatellite markers recommended by the Food and Agriculture Organization (FAO) (http://www.fao.org/dad-is/) and International Society for Animal Genetics (ISAG) (http://www.isag.org.uk/Docs/2005_Panels Markers Sheep Goats. Pdf) based on their level of allelic diversity were selected as recommended to be used in genotyping and paternity testing analyses ().
Table 1. SSR locus information.
The primers for amplification of the corresponding microsatellite loci were 5’-labeled with either VIC, PET or FAM. For amplification of 14 of the SSR loci 4 mulitiplex reactions were performed as follows:
Multiplex А: D5S2(FAM), INRA5(VIC), MAF65(PET);
Multiplex B: OarAE129(PET), OarFCB304(VIC), OarFCB11(FAM);
Multiplex C: INRA23(PET), OarFCB20(FAM), SPS113(FAM), McM527(VIC);
Multiplex D: CSRD247(VIC), HSC(FAM), MAF214(PET), OarCP49(VIC)
Primer pair INRA63 (FAM) was used separately in polymerase chain reaction (PCR).
PCR was performed in a total volume of 20 µL containing 20 ng DNA template, 10 µL 2XMyTaq™ HS Mix (BIOLINE), 10 pmol of each primer (F and R) and miliQ H20 up to the final volume.
PCR amplification was performed on an Axygen™, MaxyGene II Thermal Cycler using the following PCR conditions:
For multiplexes B and D: 1 cycle of denaturation at 95 °C for 12 min, followed by 31 cycles each consisting of 20 s at 95 °C, 1 min at 63 °C, 1 min at 72 °C, and 5 min extension at 72 °C.
For multiplexes A and C: 1 cycle of denaturation at 95 °C за 10 min, followed by 31 cycles each consisting of 30 s at 95 °C, 30 s at 55 °C, 1 min at 72 °C, and 5 min extension at 72 °C.
For amplification of the INRA63 locus, the PCR program includes 1 cycle of denaturation 95 °C for 12 min, followed by 31 cycles each consisting of 20 s at 95 °C, 1 min at 58 °C, 1 min at 72 °C, and a final step – extension at 72 °C for 5 min.
Fragment analysis
Genotyping of the microsatellite markers was carried out on an automated ABI PRISM 3130XL Genetic Analyzer (Applied Biosystem, USA) using LIZ 500 (Applied Biosystem, USA) as the internal size standard. Electropherograms were genotyped automatically with the GeneMapperTM software v5.0.
Statistical analysis
GeneAlex v6.5 [Citation19] was used for calculation of Nei’s genetic distance, expected (He) and observed heterozygosity (Ho), fixation indices (Fis, Fit and Fst) as well as for performing AMOVA and Principal Coordinate Analysis. The polymorphic information content (PIC) per each SSR marker was calculated using Powermarker 3.25 [Citation20]. Structure v 2.3.4 was used for analysis of the genetic structure [Citation21] where Admixture was used as ancestry model, Length of Burnin Period was set to 100000 and number of MCMC Reps after Burnin was set to 200000. The number of presumed clusters (K) was set from 1 to 16. Ten iterations were performed for each K value. The method by Evanno et al. [Citation22] was used to estimate the most probable number of clusters (K) using Structure harvester v 0.6.94 (http://taylor0.biology.ucla.edu/structureHarvester/). Clumpak (http://clumpak.tau.ac.il/) was used to obtain an average result over the 10 simulation runs at the identified most probable K.
Results
Population genetic variability
A total of 195 alleles were identified in the entire sheep population consisting of 96 animals genotyped at 15 microsatellite loci. The number of alleles (Na) varied from 5 in locus OarAE129 to 25 in locus OarCP49 with an average of 13 alleles/locus. The average Ne is 4.33. Parameters revealing the genetic variability in the studied population for each locus are given in .
Table 2. Allele range, number of identified alleles (Na), number of effective alleles (Ne), mean number of alleles per locus (Mn), heterozygosities: observed (Ho), expected (He), Polymorphism Information Content (PIC) and F-values in each locus.
The expected heterozygosity (He), which is considered the best estimator of genetic diversity in the population, ranged from 0.81 in locus OarFCB20 to 0.58 in locus OarAE129 with a population mean of 0.74 for the 15 loci analyzed in the population. High level of He was also observed in locus INRA5 (0.80), HSC (0.80) and loci INRA23 (0.78) and INRA63 (0.78). On the other hand, the observed heterozygosity (Ho) ranged from 0.52 in locus OarAE129 to 0.88 in locus OarFCB20 with a population mean of 0.76, indicating high level of genetic variability in the breeds. The polymorphic information content (PIC) ranged from 0.87 for OarFCB20 and INRA 5 to 0.56 for the marker OarAE129. The average PIC for the 15 microsatellite markers was 0.79 and no marker showed PIC less than 0.5, indicating that all loci were highly polymorphic.
The average Fis value was −0.02 (p < 0.05). Two markers, namely OarAE129 and CSRD247, showed Fis values higher than 0.1 (Fis = 0.11), indicating an excess of homozygous individuals in the populations for these markers. The Fit fixation index, which measures the heterozygosity loss of the individuals with respect to the overall population, was 0.06 (p < 0.05), indicating a 6% general deficit of heterozygous individuals in the sheep population. The mean Fst index, which measures the degree of genetic variability explained by differences between both breeds, was 0.09. Therefore, it is evident that the total genetic variation mostly corresponds to differences among individuals (91%) and only 9% is the result of differences between breeds. This result indicates that genetic variation measured by the microsatellite markers showed low level of genetic differentiation between the studied breeds.
Genetic variability among Kotel and Teteven breeds
The parameters used to evaluate the genetic diversity for each breed are presented in . The number of identified alleles for Kotel and Teteven breed were 170 and 139 respectively. Kotel breed had a higher mean number of alleles per locus [11.33] in comparison to Teteven breed (9.27). Higher values for Ho and He (0.78 and 0.81, respectively) were observed in Kotel breed, whereas these values in Teteven breed were slightly lower (0.72 and 0.77, respectively). There is no large difference between Ho and He values which means that both breeds showed high genetic diversity in general. The inbreeding parameter (Fis) is close to zero in both sheep breeds which means low level of heterozygote deficit. Fis is slightly higher in Teteven (0.07) than in Kotel breed [0.04].
Table 3. Number of alleles, mean number of alleles, mean observed (Ho) and expected (He) heterozygosities, coefficient of inbreeding (Fis) in Kotel breed (KOT) and Teteven breed (TET).
In general, both breeds showed high genetic diversity for all loci analyzed in this study. Hardy Weinberg equilibrium tests for the two breeds from 15 microsatellite markers showed low deviations (p < 0.001) in only 3 of 30 HW tests performed (), which is due to the absence of heterozygote deficit in each breed.
Table 4. Hardy Weinberg (HW) equilibrium test by breed.
Genetic variability within and among the flocks of Kotel and Teteven breeds
Both breeds are presented by 4 flocks respectively (). The mean number of identified alleles (Na) varied from 5.27 in Flock 8 (Teteven breed) to 7.47 in flock 2 (Kotel breed) (). Na was higher in all studied flocks (FL1-FL4) of Kotel breed in comparison to the FL5-FL8 of Teteven breed, as is shown in . Moreover, our study showed the absence of 6 alleles in 5 out of 15 microsatellite loci as well as the presence of new alleles with the frequency of 0.17-0.21 in 3 out of the tested here microsatellite loci in flock 8 which were not found in the flocks of Kotel breed and the remaining 3 flocks of Teteven breed.
Table 5. Number of identified alleles (Na), heterozygosities: observed (Ho), expected (He), and mean coefficient of inbreeding (Fis) in each flock.
The expected heterozygosity (He) ranged from 0.68 in Flock 8 (Teteven breed) to 0.78 in flock 2 and flock 4 (Kotel breed). The lowest level of observed heterozygosity (Ho) (0.67) was found in flock 6 (Teteven breed) and the highest (0.80) in Flock 4 (Kotel breed). Generally, Ho and He were higher in all four flocks of Kotel breed. Mean Fis varied from −0.16 in flock 8 to 0.03 in flock 5 of Teteven breed. Positive but lower than <0.1 Fis values were observed for FL1 (0.02, Kotel breed) as well as for FL5 (0.01) and FL6 (0.03) of Teteven breed, which does not indicate a risk of inbreeding in any of the flocks.
Genetic differentiation and admixture analysis
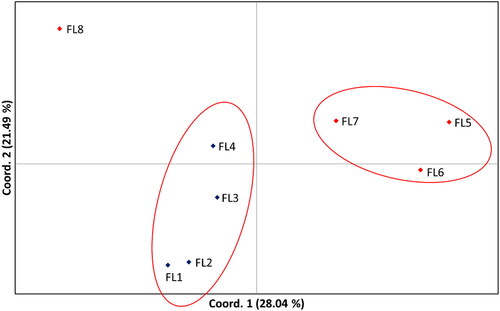
To study the genetic differentiation and admixture among the flocks of both breeds, genetic structure analysis using the Structure software and Principal Coordinate Analysis (PCoA) were performed. The results from applying the method by Evanno et al. [Citation22] showed that the most probable number of genetic clusters is three (K = 3) (). illustrates the genetic structure at K = 3 for all 96 samples of the 8 analyzed flocks. As is seen from the flocks from Kotel breed (FL1-FL4) showed highly homogenous structure with almost all samples belonging predominantly to a single cluster. On the contrary high heterogeneity of the population was observed in the flocks from Teteven breed. Although the majority of animals from flocks 5, 6 and 7 belonged to the second major cluster, which is separated from the Kotel breed cluster, five of the animals from these three flocks (one from flock 6 and four from flock 7) belonged to the same genetic cluster as the samples from the Kotel breed. Moreover, all animals of flock 8 from Teteven breed belonged to a third major cluster with a genetic structure which was different from the rest of the flocks of the two analyzed breeds. Similar results were obtained applying PCoA as shown in where again three major clusters were observed with flock 8 of Teteven breed separated from the other two identified clusters.
Figure 1. Genetic structure of 8 sheep flocks representing two Bulgarian sheep breeds based on SSR marker data. a) Estimation of the most probable K using the delta K method by Evanno et al. [Citation22], b) Bar plot representing the genetic structure at K = 3. FL1-FL4 represent data for flocks from Kotel breed, FL5-FL8 represent data for flocks from Teteven breed.
![Figure 1. Genetic structure of 8 sheep flocks representing two Bulgarian sheep breeds based on SSR marker data. a) Estimation of the most probable K using the delta K method by Evanno et al. [Citation22], b) Bar plot representing the genetic structure at K = 3. FL1-FL4 represent data for flocks from Kotel breed, FL5-FL8 represent data for flocks from Teteven breed.](/cms/asset/b2f8cfec-dfe5-4a4c-bc22-a6336d452ad7/tbeq_a_1903339_f0001_c.jpg)
Figure 2. Principal coordinate analysis of 8 sheep flocks representing two Bulgarian sheep breeds based on SSR marker data. FL1-FL4 represent data for flocks from Kotel breed, FL5-FL8 represent data for flocks from Teteven breed.
We further compared the Fst values between the studied flocks as a measure for their genetic differentiation (). In general, the flocks from Kotel breed showed low genetic differentiation with Fst values ranging between 0.024 and 0.035 suggesting homogenous structure within the breed. The flocks from Teteven breed showed higher Fst values ranging between 0.046 and 0.092. As seen from the highest Fst values were scored between flock 8 and the rest of the flocks from the Teteven breed (0.067-0.092). Surprisingly, the Fst values between flock 8 and the flocks from Kotel breed (0.053-0.066) were lower. As a whole the results from the pairwise Fst comparison between the flocks were in complete consistence with the analysis of the genetic structure ( and ).
Table 6. Pairwise comparison of Fst values among 8 flocks from Kotel and Teteven breed.
Discussion
Population genetic diversity
The study of genetic variation plays an important role in developing rational breeding strategies for economical animal species [Citation23]. In the present study the genetic diversity of two indigenous sheep breeds in Bulgaria was assessed by using 15 microsatellite markers from the ISAG/FAO recommendation list for genotyping and parentage testing in sheep.
The level of variation depicted by the number of alleles at each locus serves as a measure of the impact of each of the studied breeds on differentiation within livestock populations. The average Na found in this study is higher than that observed by Nanekarani et al. [Citation24] with 15 microsatellite markers in a population of 360 sheep from four breeds in Iran and by Mastranestasis et al. [Citation11] with 11 SSR markers in the Levsos breeds population in Greece. However, this value is lower than the observed average Na value of 13.4 in 362 sheep that originated from three Colombian sheep breeds distributed over 43 farms in 11 Colombian provinces [Citation25] using 10 microsatellite markers. The comparison of the Ne with the number of observed alleles per locus provides evidence for the predominance of certain alleles in each breed.
The polymorphic information content (PIC) is an indicative parameter for informativeness of microsatellite markers and their usefulness in diversity analysis of a breed. In our study, the high values of PIC (> 0.5) [Citation26] and the high average number of alleles per locus indicate that the panel of 15 microsatellite markers used is suitable for studies of genetic diversity in Bulgarian sheep. In this sense, INRA5, OarFCB20 and HSC could be considered the most informative markers of our test panel. Previous studies on the genetic diversity and structure in 7 indigenous sheep breeds [Citation1] using 6 SSR markers also showed high level of polymorphism in locus OarFCB20. An average value of 0.79 for the PIC once again indicated abundant genetic diversity in the Bulgarian sheep population as well as the utility of these markers for population assignment [Citation27] as well as genome mapping [Citation28] studies in addition to genetic diversity analysis.
The expected heterozygosity (He), which is considered the best estimator of genetic diversity in a population [Citation29] showed a value of 0.74, indicating that the indigenous sheep population in Bulgaria has high genetic variability. This is very promising for the conservation of the indigenous sheep breeds as a genetic resource since high levels of genetic variability allows a better adaptation to environmental changes which have become more evident in recent years and reduces the negative effects of inbreeding that are common in livestock farming. The observed heterozygosity (Ho) ranged between 0.52 (OarAE129) and 0.88 (OarFCB20), with an average of 0.76 for the 15 loci analyzed in the population. It is observed that in 8 out of 15 microsatellite loci studied here Ho was higher than He, which means an absence of heterozygous deficit. Overall, the observed heterozygosity is higher than in other sheep breeds from Columbia [Citation25], China [Citation30], Sudan [Citation31], India [Citation27], similar to that reported for 10 native Greek breeds [Citation10] but lower than that observed in the Levsos sheep breed from Greece [Citation11].
The average Fst over the loci and samples was 0.9 showing that most genetic differentiation is explained within breeds. The low Fst value suggests that local breeds are not well differentiated, which could be explained by the common history and breeding practice. Additionally, the admixture could be result of the high flow of genes between farms due to the practice to borrow or lease rams and lack of effective control in breeding programs [Citation25] in Bulgaria. Similar results have been reported by Stahlberger-Saibetkova et al. [Citation7] and Al-Atiyat et al. [Citation32]. However, lower estimates of genetic differentiation between sheep breeds were found by Ocampo et al. [Citation25], Bozzi et al. [Citation5], Zhong et al. [Citation30], Álvarez et al. [Citation33], Ben Sassi et al. [Citation34], Hoda et al. [Citation14] and Abdelkader et al. [Citation35], who reported Fst ranging between 0.05 and 0.3. The Fis value for the overall population (-0.02) is lower than the values reported in Turkish sheep breeds [Citation36], Tunisian sheep breeds [Citation37], Moroccan sheep breeds [Citation38] and seven indigenous Bulgarian sheep breeds not included in this study [Citation1]. The Fis values obtained according to the breeds studied here indicated absence of a loss of heterozygosity in contradiction to many other studies in sheep that reported the presence of heterozygous deficit that could be generally explained by subdivision among flocks (Wahlund effect) and uncontrolled cross breeding without respect to the distribution area of each breed by the breeder.
Within-breed genetic differentiation
Both breeds showed a high mean number of alleles. The Kotel breed had higher MNA (11.33), which in turn is higher than the values reported by Hristova et al. [Citation1] for Breznishka (10 alleles/locus), Copper-Red Shumenska (10.5 alleles/locus), Karakachanska (9.5 alleles/locus), Local Karnobatska (9.17 alleles/locus), Blackhead Plevenska (10.33 alleles/locus) and Starozagorska (9.5 alleles/locus0 sheep breeds in Bulgaria.
The absence of deviation found in HW tests and the low values of Fis found in each breed indicates a very low deficit of heterozygote individuals in contradiction to the study of Hristova et al. [Citation1] in seven Bulgarian indigenous sheep breeds and of Kusza et al. [Citation39] on the genetic relationship among five Bulgarian sheep breeds using 16 SSR markers. The absence of heterozygote deficit is due to the negative Fis values in 3 out of 4 tested flocks of Kotel breed and in 2 out of 4 tested flocks of Teteven breed. In these flocks, the Ho was higher or equal to the He. The high values of the observed heterozygosity and the negative values of Fis could be explained by the high gene flow between the flocks of the breeds. Very low Fis values were also observed in the study of Mastranestasis et al. [Citation11], on genetic diversity and structure of the Levsos sheep breed in Greece including 10 flocks on the island of Levsos. The authors reported significantly negative Fis for 5 out of the 10 flocks and consistently higher observed heterozygosity than that expected for all flocks.
Furthermore, our results revealed a high rate of animal exchange not only between neighbouring and more distant farms in the frame of the breed but also between breeds, which suggests a lack of appropriate management of the conservation programs of local sheep breeds. Our study showed that the genetic differentiation of the studied flocks of both breeds is lower in Kotel breed than in Teteven breed. Among the studied four flocks of Teteven breed, the highest Fst was observed for flock 8, which means that this flock is isolated and the exchange of animals with other flocks of Teteven sheep bred is restricted. Moreover, this flock is characterized by a high proportion of alleles not observed in any of the flocks of Kotel and Teteven breeds. The presence of alleles specific only for this flock was also observed. This is also reflected in the clustering obtained by the PCoA and STRUCTURE analyses. The STRUCTURE analysis showed a specific grouping of the eight flocks in three clusters in which all of them had different proportions of membership. The first cluster corresponds to the flocks of the Kotel breed, which is the most homogenous, consistent with the observed low genetic differentiation between flocks. The second cluster includes three flocks of Teteven breed. It is the most heterogeneous one because of the higher observed gene flow from the flocks of the Kotel breed and from an unknown sheep breed previously referred to as flock 8 of the Teteven breed. This flock comprises animals that are more genetically distant from the Teteven breed and forms an additional cluster, which is almost homogenous. This indicates that this flock consists of animals not belonging to both of the studied breeds. Our study showed that this flock has overlapping habitats with other local sheep breeds like Karakachanska and Central Stara Planina sheep breeds. Additional studies including the breeds having overlapping habitats will reveal the possible assigning of the animals of that flock to any of the breeds in the region.
The study showed that the accurate management of the purity of the breeds is an important tool for the implementation of the management practice for the proper conservation of indigenous sheep breeds in Bulgaria. In this case, the use of molecular markers is an appropriate tool for both the study of genetic diversity and admixture analysis and for the determination of the purity of the breeds. They allow the assigning of individual animals to specific breeds, which sometimes is impossible with the use of phenotypic tools.
Conclusions
The study showed that the genetic variability in Bulgarian sheep breeds is ascribed by the within-breed variability. The low Fst value of 0.09 in the overall population in this study, suggests that local breeds are not differentiated enough. Lower differentiation was observed in Teteven than in Kotel breed with the exception of flock 8 of Teteven breed. The number of unique alleles, as well as the specific grouping of this flock in a separate cluster not belonging to the clusters of both breeds studied here, suggests its different origin. This shows that molecular markers are an appropriate tool for assigning animals/flocks to specific breeds and determining the admixture processes in breeding practice where there is no strong control on the proper management of the local sheep breed conservation. Further analysis of the neighbour breeds from the region will allow the correct assigning of the animals of flock 8 of Teteven breed.
Disclosure statement
The author declares no conflicts of interest.
Data availability
All data that support the findings reported in this study are available from the corresponding author upon reasonable request.
References
- Hristova D, Todorovska E, Vassilev D, et al. Microsatellites based genetic diversity and population structure of seven Bulgarian indigenous sheep breeds. Int J Curr Microbiol App Sci. 2014; 3(10):569–581. http://www.ijcmas.com
- Khodabakhshzadeh R, Mohammadabadi MR, Esmailizadeh AK, et al. Identification of point mutations in exon 2 of GDF9 gene in Kermani sheep. Pol J Vet Sci. 2016;19(2):281–289.
- Mohammadabadi M, Esfandyarpoor E, Mousapour A. Using inter simple sequence Repear multi-loci markers for studying genetic diversity in Kermani sheep. J Reseach Dev. 2017; 5:1–4.
- Legaz E, Alvarez I, Royo L, et al. Genetic relationship between Spanish Assaf [Assaf.E] and Spanish native dairy sheep breeds. Small Rumin Res. 2008;80(1-3):39–44.
- Bozzi R, Degl’Innocenti P, Rivera Diaz P, et al. P. Genetic characterization and breed assignment in five Italian sheep breeds using microsatellite markers. Small Rumin. Res. 2009; 85(1):50–57.
- Tolone M, Mastrangelo S, Rosa A, et al. Genetic diversity and population structure of Sicilian sheep breeds using microsatellite markers. Small Rumin Res. 2012;102(1):18–25.
- Stahlberger-Saitbekova N, Schlopfer J, Dolf G, et al. Genetic relationships in Swiss sheep breeds based on microsatellite analysis. J Anim Breed Genet. 2001;118(6):379–387.
- Baumung R, Cubric-Curik V, Schwend K, et al . Genetic characterisation and breed assignment in Austrian sheep breeds using microsatellite marker information. J Anim Breed Genet. 2006;123(4):265–271.
- Neubauer V, Vogl C, Seregi J, et al. Genetic diversity and population structure of Zackel sheep and other Hungarian sheep breeds. Arch Anim Breed. 2015;58(2):343–350.
- Ligda C, Altarayrah J, Georgoudis A. ECONOGENE Consortium. Genetic analysis of Greek sheep breeds using microsatellite markers for setting conservation priorities. Small Rumin Res. 2009;83(1-3):42–48.
- Mastranestasis I, Ekateriniadou LV, Ligda C, et al. Genetic diversity and structure of the Lesvos sheep breed. Small Rumin Res. 2015; 130:54–59.
- Dudu A, Popa GO, Ghiță E, et al. Assessment of genetic diversity in main local sheep breeds from Romania using microsatellite markers. Arch Anim Breed. 2020; 63(1):53–59.
- Cinkulov M, Tapio M, Ozerov M, et al. Genetic differentiation between the Old and New types of Serbian Tsigai sheep. Genet Sel Evol. 2008;40(3):321–331.
- Hoda A, Bytyqi H, Dobi P, et al. Genetic diversity of Bardhoda breed in Albania and Cosova analyzes by microsatellite markers. Res J Agric Sci. 2009; 41(2):218–223.
- Hoda A. Marsan A. Genetic characterization of Albanian sheep breeds by microsatellite markers. In: Çalışkan M, editor. Analysis of genetic variation in animals. Rijeka (Croatia): InTech; 2012. p. 3–27.
- Nikolov V. Review of the specific measures for support of the autochthonous breeds in Bulgaria. j Cent Eur Agric. 2015; 16(2):38–46.
- Nikolov V, editor. Livestock breeds in the Republic of Bulgaria. Catalogue. 3rd ed. Sofia (Bulgaria): Executive Agency for Selection and Reproduction in Animal Breeding (EASRAB). 2011. Published online by Cambridge, University Press.
- Hristova D, Metodiev S, Nikolov V, et al. Genetic variation of Bulgarian autochthonous sheep breeds using microsatellite markers. Genetika. 2017; 49(1):247–258.
- Peakall R, Smouse PE. GenAlEx 6.5: genetic analysis in Excel. Population genetic software for teaching and research-an update. Bioinformatics. 2012;28(19):2537–2539.
- Liu K, Muse S. PowerMarker: an integrated analysis environment for genetic marker analysis. Bioinformatics. 2005; 21(9):2128–2129.
- Pritchard K, Stephens M, Donnelly P. Inference of population structure using multilocus genotype data. Genetics. 2000; 155:945–959.
- Evanno G, Regnaut S, Goudet J. Detecting the number of clusters of individuals using the software STRUCTURE: a simulation study. Mol Ecol. 2005;14(8):2611–2620.
- Maudet C, Miller C, Bassano B, et al. Microsatellite DNA and recent statistical methods in wildlife conservation management: applications in Alpine Ibex (Capra ibex). Mol Ecol. 2002;11(3):421–436.
- Nanekarani S, Amirinia C, Amirmozafari N, et al. Genetic variation among pelt sheep population using microsatellite markers. Afr J Biotechnol. 2010; 9(44):7437–7445.
- Ocampo RJ, Martinez RA, Rocha JF, CORPOICA, et al. Genetic characterization of Colombian indigenous sheep. Rev Colomb Cienc Pecu. 2017;30(2):116–125.
- Arora R, Bhatia S. Genetic diversity of Magra sheep from India using microsatellite analysis. Asian Australas J Anim Sci. 2006; 19(7):938–942.
- Arora R, Bhatia S, Jain A. Morphological and genetic characterisation of Ganjam sheep. Anim Genet Resour. 2010; 46:1–9.
- Kayang BB, Inoue-Murayama M, Hoshi T, et al. Microsatellite loci in Japanese quail and cross-species amplification in chicken and guinea fowl. Genet Sel Evol. 2002;34(2):233–253.
- Kim KS, Yeo JS, Choi CB. Genetic diversity of North-East Asian cattle based on microsatellite data. Anim Genet. 2002; 33(3):201–204.
- Zhong T, Han JL, Guo J, et al. Genetic diversity of Chinese indigenous sheep breeds inferred from microsatellite markers. Small Rumin Res. 2010;90(1-3):88–94.
- Gornas N, Weimann C, El Hussien A, et al. Genetic characterization of local Sudanese sheep breeds using DNA markers. Small Rumin Res. 2011;95(1):27–33.
- Al-Atiyat RM, Aljumaah RS. Genetic distances and phylogenetic trees of different Awassi sheep populations based on DNA sequencing. Genet Mol Res. 2014;13(3):6557–6568.
- Álvarez I, Capote J, Traoré A, et al. Genetic relationships of the Cuban hair sheep inferred from microsatellite polymorphism. Small Rumin Res. 2012;104(1-3):89–93.
- Ben S-Z, Maretto F, Charfi-Cheikrouha F, et al. Genetic diversity, structure, and breed relationships in Tunisian sheep. Small Rumin Res. 2014;119(1-3):52–56.
- Abdelkader AA, Ata N, Benyoucef MT, et al. New genetic identification and characterisation of 12 Algerian sheep breeds by microsatellite markers. Italian J Animal Sci. 2018; 17(1):38–48.
- Yilmaz O, Cemal I, Karaca O, et al. Molecular genetic characterization of Kivircik sheep breed raised in Western Anatolia. Livestock Res Rural Dev. 2016; 28:40. http://www.lrrd.org/lrrd28/3/yilm28040.html
- Kdidi S, Calvo JH, González-Calvo L, et al. Genetic relationship and admixture in four Tunisian sheep breeds revealed by microsatellite markers. Small Rumin Res. 2015; 131:64–69.
- Gaouar BS, Kdidi S, Ouragh L. Estimating population structure and genetic diversity of five Moroccan sheep breeds by microsatellite markers. Small Rumin Res. 2016; 144:23–27.
- Kusza S, Dimov D, Nagy I, et al. Microsatellite analysis to estimate genetic relationships among five Bulgarian sheep breeds. Genet Mol Biol. 2010; 33(1):51–56.