
Abstract
Salinity is one of the most limiting constraints of crop production. Nevertheless, highly-tolerant crop plants (e.g. ‘Guar’ Cyamopsis tetragonoloba) can thrive well under salinity conditions. RNA-Seq plays a central role in identifying genes involved in the response mechanisms to salt stress in plant species. High-quality RNA, free of genomic DNA is a critical determinant for success in subsequent downstream experiments to shed light on tolerance mechanisms. In this research, an inspection of two different total RNA isolation protocols was employed for preparing highly pure and intact RNAs with good yield from Guar tissue under both high salinity and control conditions. The extracted RNA appeared in all quality metrics to be of adequate quantity and quality for most downstream applications, including high-throughput transcriptome sequencing and expression analysis. However, the outcomes showed that the most widely used RNA quality measurement, the RNA Integrity Number (RIN), is a poor indicator with a weak correlation to the integrity of RNA from this plant. In contrast to human and animal cells, plants have various ribosomal RNA species. Consequently, whenever the RNA was separated on an agarose gel, several RNA bands did appear, which gives the false impression of being unable to analyze the results of the bioanalyzer integrity. Low RIN number RNA samples were further processed by RNA-sequencing RNA-seq experiments from guar. RNA-seq analysis via Illumina’s paired-end method was carried out to trace back and evaluate the extracted total RNA, resulting in high-quality data for subsequent stress tolerance research.
Introduction
Soil salinization is a major concern to the environment and worldwide crop production. Studies examining the salinity tolerance of plants are important for the sustainable economic growth of food production in saline lands. Towards this aim, salt-tolerant species are vital to salt stress investigation [Citation1, Citation2]. The salinity tolerance under salt stress is determined by efficient regulation of different metabolic pathways, physiological processes and gene networks [Citation3–6]. One example of this kind of species is Guar (Cyamopsis tetragonoloba (L.) Taub.). Guar is a summer annual legume, a potential alternative crop in semi-arid regions because of its high tolerance to drought [Citation7] and salinity [Citation8, Citation9].
Identification of candidate genes in Guar for adaptive traits and molecular markers that are linked to variation under salinity requires a cost-effective and suitable approach. Improved sequencing and transcriptome analysis are new technologies that provided a means to monitor genome-wide changes in transcriptomes to study expression patterns under salinity [Citation10]. Over the last decade, RNA-seq has been extensively used in researching the responses of plants to abiotic stresses, particularly salt stress [Citation11–14] as an effective technique for investigating the expression of a considerable number of genes in a specific tissue at a particular interval of time. Such technology could uncover candidate genes and main metabolic pathways involved in salinity tolerance through examining the functional annotation of RNA-seq and differentially expressed genes (DEGs) [Citation15]. However, only a set of RNA that truly represents cell transcription for a particular sample will provide accurate information on the characteristics and expression levels of the transcripts analyzed. Therefore, acquiring sufficient, intact, clear, and stable RNAs is a necessary precondition and a major determinant for the progress of many RNA-seq downstream approaches used to characterize such tolerance strategies [Citation16].
Unfortunately, obtaining RNA from plants is a rather more complicated and harder process than those from humans and animals [Citation17–19]. The first obstacle is to extract the appropriate quality of RNA (i.e. undegraded RNA, lack of contaminants). RNA is very labile in comparison to DNA; degradation of RNA can occur rapidly due to many factors (cellular RNases, temperature or chemical treatment) contributing to this process [Citation20]. An even worse issue would be the abundance of plant complex primary and secondary metabolites (ex, phenolics and polysaccharides) that differ drastically inside and between species [Citation21–26], which could restrict the use of such technologies, but may also obstruct experiments that deal with RNA in particular [Citation27]. A second obstacle is to determine RNA quality metrics predicting efficiency in sequencing [Citation28], validated here as the total number of long scaffolds (approximately 1000 bp) constructed from the Illumina sequence reads, providing an estimation of the number of full-length transcripts in a sample [Citation29].
Various studies on RNA commercial kits or extraction techniques revealed the variability in the amount and consistency and quality of the collected RNA, which could influence the outcomes of downstream applications [Citation30–32]. These studies, discussing the effectiveness of a specific RNA extraction protocol in a variety of species, suggest that the quantity and quality of extracted RNA could differ considerably between species and that RNA extraction protocols should be adapted for each species and type of tissue. Thus, the selection of a suitable technique for RNA extraction is crucial. Generally, the RNA Integrity Number (RIN) is the measurement of choice to evaluate the integrity and extent of degradation of the RNA samples attained by the 2100 Agilent BioAnalyzer based on the microcapillary electrophoretic RNA separation. The RIN scale ranges from (degraded) 1 to (intact) 10 and generally RIN > 9 is necessary in most core facilities [Citation33]. In contrast to RIN, RNA Integrity Number equivalent RINe reflects the relative signal ratio in the fast zone to the 18S peak signal, which is determined automatically by the 2200 TapeStation software. The estimated values are displayed in the same manner as the RIN from 1 to 10, with the maximum RNA quality being assigned a RINe value of 10 [Citation34]. In this study, the assessment of two distinct protocols to isolate total RNA from Guar was carried out. In addition, evaluating and uncovering the various metrics that are intended to measure RNA quality would provide a generic empirical analysis of the key determinants of sequencing performance.
Materials and methods
Plant material
The previously characterized guar accession “BWP 5595” [Citation35] for its contrasting tolerance to salinity was subjected to salt stress in a pot experiment. The seeds were surface sterilized using 5% Chlorine bleach, sodium hypochlorite followed by three rinses with autoclaved distilled water for 30 min. The seeds were planted in culture plates under conditions of growth chamber (light/dark cycle 16 h/8 h at a temp of 21° C) till the development of radicals. The seedlings were transferred into pots with a diameter of 10.5 inches in a mixture of the equivalent ratio of peat moss, perlite and soil under a 16 h photoperiod and a temperature of 25° C (day) and 22° C (night). The salt treatment was applied in a completely randomized design (CRD) once the seedlings had six mature leaves (5 weeks) [Citation35]. A concentration gradient of sodium chloride solution was applied in the treatment pots to decelerate the salt damage: the first day 50 mmol/L, then raised daily by 50 mmol/L and eventually maintained at 200 mmol/L until the end of the experiment, while the control plants were periodically watered. After 120 h, fresh leaves (3-biological replicates) from NaCl-treated and control plants were collected and directly immersed in liquid nitrogen.
RNA extraction and quality assessment
There is no optimum single technique to extract total RNA from all tissues or species. Two distinct methods of RNA extraction were evaluated to identify any impact of the RNA purification process on the quality of RNA (). Total RNA was extracted following the manufacturer’s instructions of the commercial column-based system (QIAGEN RNeasy ® Plant Mini Kit) and the non-commercial solvent phenol chloroform-based RNA extraction protocol [Citation36]. DNA was successfully eliminated using DNase Digestion, DNase I, Bovine Pancreas, > 1800 U, RNase Free (Biomatik), enabling us to continue with RNA free from DNA.
Table 1. Extraction method, library construction and sequencing information.
RNA purity and yield were calculated using a NanoDrop 8000 Spectrophotometer (Thermo Fisher Scientific), while RNA integrity was calculated using three metrics: 1- Inspected by denaturing formaldehyde agarose gel electrophoresis, 2- The ratio (26S/18S) of ribosomal RNA subunits and 3- the RNA integrity number (RIN) and its counterpart RNA integrity number equivalent (RINe) values, which are recognized as the "standard" for the integrity and quality of the RNA [Citation34, Citation37, Citation38]. The RIN was evaluated through the Agilent 2100 Bioanalyzer with its plant RNA Nanochip assay under the plant RNA configuration available option in the release B.02.07 of the Bioanalyzer program, whereas RINe was evaluated through the Agilent 2200 TapeStation with its RNA ScreenTape assay following the manufacturer’s protocol. The dried total RNA samples (RNAstable, Biomatrica) were redirected to Macrogen Inc. (Seoul, Korea) for RNA-seq analysis.
Library preparation and RNA sequencing
A total of 12 RNA-Seq libraries (2 conditions x 2 extraction methods x 3 biological replicates) were constructed using the TrueSeq Stranded mRNA LT Sample Prep Kit (Illumina) for paired-end application (). The mRNA was fragmented chemically succeeded by the synthesis of cDNA and ligation of the adapter. The stranded library molecules were analyzed on a 2200 TapeStation (Agilent Technologies) for peak size selection and region molarity calculations. For each sample, the transcriptome sequencing was carried out by using Illumina HiSeq 2500 system.
Transcriptome assembly
The sequence data were investigated for quality using the FastQC v0.11.5 [Citation39]. The raw fastq sequences were trimmed for adapters and read length using Trimmomatic v0.36 software. De novo transcriptome was assembled using Trinity ver2.4.0 [Citation40, Citation41] along with a K-mer set to be 32. The number of transcripts ≥1000 bp (a sequencing success metric preferably symbolizes an estimation of the number of complete transcripts) was calculated, which could trace back and prove a sample RNA integrity [Citation28].
Data analysis
The data were statistically analyzed using the IBM SPSS Statistic Software Package, Version 25 (SPSS Inc./IBM Group, Armonk, NY, USA). The mean comparison was conducted with the Duncan test (P value <0.05).
Results and discussion
C. tetragonoloba is a recently domesticated annual legume crop species and the only cultivated crop species among the trinity species of the genus Cyamopsis [Citation42]. Its considerably higher tolerance to most abiotic stress conditions is widely recognized [Citation35], which reflects its valuable genetic makeup reserve. In order to minimize economic harm and ensure crop species productivity and food security, it is necessary to generate and render its tolerance mechanisms information available, which further contributes to the overall abiotic tolerance [Citation43]. The recent developments in high-throughput sequencing technologies, including RNA-seq, would certainly help in examining Guar transcriptome and discover the mechanisms influencing its tolerance [Citation44].
The objective of RNA-seq is to portray the transcriptome at the time the tissues were recovered; therefore, acquiring a suitable amount of high-quality, undamaged RNA is the first vital step toward the investigation of next-generation sequencing platforms [Citation45]. Different methods of RNA extraction or commercial kits differ in yield as well as in the integrity and quality of the collected RNA, which could influence the outcomes of downstream applications [Citation32]. Hence, the choice and assessment of a suitable RNA extraction method are crucial.
The most popular approaches for RNA extraction from plant developed so far are generally defined by the following methods: urea [Citation46]; detergents such as cetyl trimethyl ammonium bromide (CTAB) [Citation47–49]; acid phenol [Citation50]; guanidinium/guanidine salts [Citation51–53] or sodium dodecyl sulfate [Citation54, Citation55]. Such methods, including the widely used commercial kits (Ambion RNAqueous Kit, Invitrogen TRIzol Reagent, and Qiagen RNeasy Plant Kit), may be sufficient for specific plant species and tissues. This study aimed to compare the two RNA extraction methods: column-based from Qiagen RNeasy mini kit and the organic solvent-based extraction method (phenol/chloroform) to resolve any effect these methods on the RNA integrity and to test their efficacy in extracting good quality RNA appropriate for functional genomic researches such as RNA-seq.
The success of total RNA extraction should be verified by testing the quantity, quality and integrity of RNA. RNA quality is usually judged in three ways. Firstly, agarose gel electrophoresis demonstrated intact and bright bands representing the ribosomal subunits of the undegraded total RNA [Citation20, Citation56–58]. Secondly, measurement of absorbance 1- The absorption ratios A260/230 and A260/280 were used to detect polysaccharide/polyphenolic contaminants, protein contaminants and high salt, respectively [Citation33, Citation59]. Pure RNA is supposed to have a value of 2.0-2.1 for OD A260/280, whereas OD 260/230 nm of pure RNA has a value around 2 [Citation27, Citation60, Citation61]. 2 - Utilizing an instrument such as the Agilent Bioanalyzer, while its RIN values on a scale from 1 to 10, with 1 by far the most damaged and 10 the most integrated RNA sample. Such range is based on the distribution of RNA molecules size measured by microcapillary electrophoresis [Citation58, Citation62, Citation63]. 3- The efficiency of total RNA extraction was demonstrated by the success of the sequencing and assembly process [Citation28]. It was measured as the number of successfully assembled long scaffolds (≥ 1000 bp) from the Illumina sequence reads, which represents an estimation of the total number of full-length transcripts in the sample. Collectively, to be precise, samples are considered adequate for sequencing if they fulfill the minimum of these criteria: OD 260/230 ≥ 1.5, OD 260/280 ≥ 1.9, r26S/18S ≥1, RIN ≥7 and total RNA concentration ≥3 μg.
RNA concentration and quality assessment
The integrity, quality and quantity of the isolated RNA have been verified by three separate means. The electrophoresis analysis of the 1 percent formaldehyde denaturing agarose gel permitted validation in such a way that the separation of the bands of the various types of RNAs was easily visualized for the two protocols examined in this study. Plant leaf tissue is widely utilized in RNA purification and usually produces several RNA bands due to different species of ribosomal RNA, included in large and small subunits. It showed intact and sharp 25S, 24S, 23S, 18.5S, 18S, 16S, 5.8S and 5S rRNA bands that should be present in a high-quality and integrity RNA sample to be used in downstream applications [Citation64]. The respective densities of the 23S, 24S and 25S rRNA bands were around 1.5- and 2-fold those of the corresponding 16S, 18S or 18.5S rRNA bands, which indicate elevated RNA integrity. Moreover, there were no noticeable bands all across loading wells, suggesting no contamination of genomic DNA (). DNase digestion of the purified RNA with RNase-free DNase I turned out to be efficient (Biomatik).
Figure 1. Separation of DNase treated total RNA using the Phenol based method (Lanes 2-7 both control and treated samples) and RNeasy kit (Lanes 8-13, both control and treated samples), on 1% formaldehyde (w/v) denaturing 1.2% agarose gel electrophoresis showing multiple ribosomal RNA bands with no signs of RNA degradation. [M, 100 bp DNA Ladder].
![Figure 1. Separation of DNase treated total RNA using the Phenol based method (Lanes 2-7 both control and treated samples) and RNeasy kit (Lanes 8-13, both control and treated samples), on 1% formaldehyde (w/v) denaturing 1.2% agarose gel electrophoresis showing multiple ribosomal RNA bands with no signs of RNA degradation. [M, 100 bp DNA Ladder].](/cms/asset/edbb2ce0-42f9-4a3a-9c51-1b298f4650d6/tbeq_a_1910567_f0001_c.jpg)
The ratios between the absorbance of RNA at 260 nm and 280 nm (260/280 ratio) ranged from 2.02 ± 0.06 to 2.07 ± 0.07, 1.89 ± 0.09 to 1.91 ± 0.06 for RNeasy and phenol-based extractions, respectively (). The ratios between the absorbance at 230 nm and 260 nm (230/260 ratio) via phenol-based extraction ranged between 0.40 ± 0.03 and 0.57 ± 0.09 in all samples, which suggested high salts concentration. The RNeasy A260/A230 ratio was above 2.0 for all the samples that implied substantial low pollutants of proteins, salts, polysaccharides or polyphenols.
Table 2. Purity or integrity and average yields of total RNA extracted by the two methods and determined spectrophotometrically (nanodrop vs Bioanalyzer vs Tapestation).
The yield of total RNA extracted by the phenol-based method was higher at the rate of 18.21 to 22.13 μg compared to RNeasy Kit 8.44 to 10.59 μg, while the commercial kit was higher in RNA quality (). The results of the NanoDrop test suggested that the RNAs were suitable for RNA-Seq. The concentration and purity were also checked by Agilent 2100 bioanalyzer test. The Agilent 2100 bioanalyzer system confirmed the absence of genomic DNA in the RNA samples. The protocol yielded total leaf RNA of 3 µg up to 12 µg (). The minimal concentration for library construction for RNA sequencing (transcriptome analysis) using the Illumina platform is ≥0.1 μg using the Illumina Truseq stranded mRNA Kit. The differences in measurements of RNA concentration using different instruments may have been due to technical differences in the RNA measurement methods. Pipetting errors may also be a factor, as 1 μL of sample is measured using the Agilent 2100 instrument while 2 μL of the sample was measured using the Nanodrop instrument.
RIN values were calculated on the Agilent 2100 Bioanalyzer employing the Plant RNA module [Citation65], the highest quality RNA (RIN 6.1–6.3) was acquired through using the RNeasy Kit (Qiagen) ( and ). Regarding the phenol-based method, the RIN acquired was roughly 0.4–0.7 lower when compared to the RNeasy Kit, although no evidence of deterioration was observed from the RNA gel. Agilent TapeStation with its independent quality score RNA Integrity Number equivalent (RINe) for total RNA confirmed its counterpart RIN value with an average RINe of 6.4 through RNeasy Kit while 5.6-5.7 obtained using the Phenol based method.
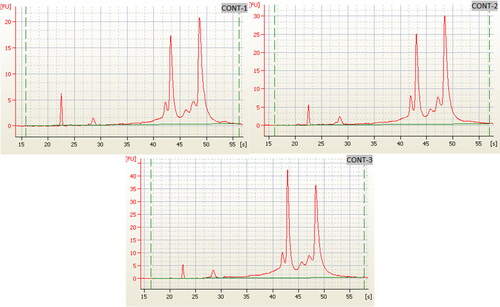
Figure 2. (a) "Gel Image" display of microcapillary electrophoresis electropherograms demonstrating the integrity of the RNA in the Agilent 2100 Bioanalyzer. The lower marker band across all samples is the electrophoresis marker (roughly 22 s). Phenol based method (Lanes 2-7, both control and treated samples) and RNeasy kit (Lanes 8-13 both control and treated samples); (b) injected ladder in RNA 6000 Nano total RNA kit.
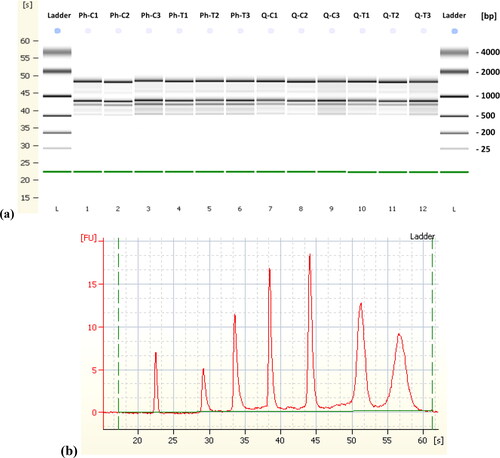
Figure 3. Electropherogram of the RNA of the three biological replicates of the control samples (Qiagen RNeasy Kit) using 2100 Bioanalyzer RIN: 6.4.
The RIN values span from 1 (deteriorated) to 10 (undamaged); however, commonly, RIN ≥ 7 is usually deemed to be adequate for RNA Sequencing technologies [Citation66]. Below this is considered as RNA degradation and will impact transcript quantification. RIN measurement was originally intended to examine the integrity of RNA isolated from mammalian cells [Citation63]. In contrast to human and animal cells, plant tissues contain chloroplast ribosomes apart from mitochondrial and cytosolic ribosomes () [Citation67]. Moreover, Green tissue may contain additional rRNAs in contrast to non-green tissues, such as roots [Citation65]. Therefore, when the RNA was separated on an RNA gel, typically multiple RNA bands appeared which confuse and fail to interpret the integrity results.
Table 3. Plant ribosomal RNA.
Unfortunately, no assay is present to properly recognize the RIN for leafy plant tissues, and this cannot be adjusted employing the algorithm designed by Agilent in the Beta version of the software with plant-specific RNA analysis configurations is still being tested [Citation68]. There are two concerns with plant total RNA. Firstly, the plant rRNAs display different peaks than those of animal rRNAs. Secondly, the peaks of chloroplast rRNA are regarded as degradation byproducts in the analysis and therefore reveal lower RIN values. The short peaks beside the 18S/28S peaks were much sharper and are likely a type of chloroplast rRNA, which, regrettably, cannot be examined by the Agilent system.
Owing to those RNA bands, the Agilent Bioanalyzer could not adequately analyze intact total RNA leading to minimal RIN levels (less than 8) or even no RIN values [Citation69]. Moreover, the RNA extraction method did not significantly affect the RIN value. For instance, extraction via the RNeasy mini kit resulted in significantly higher RIN than the phenol-based method; nevertheless, this is probably due to the increase in gel background. It was revealed by comparing the RIN to the gel, as it was obvious that the RIN did not properly represent the integrity of the RNA. Hence, the RIN values should be verified by visualizing the integrity of the RNA band on the RNA gel.
Library construction, sequencing, and raw data retrieval
In order to ensure the highest precision of the sequencing data, it is necessary to check the quality and precisely calculate the concentration of the cDNA libraries prior to sequencing. It is also essential to evaluate the distribution of the fragment size of the RNA-seq libraries. The fragment sizes must remain within the predicted range of sizes (depends entirely on the protocol) and libraries must be devoid of ligation/PCR artifacts (typically small compared to the target molecules). The size of the fragments could be measured through electrophoresis, ideally by using a reliable system like the ABI Bioanalyzer.
The fragmentation quality and size were checked at the end of library construction (; ). The RNA amount in each library was quantified with the Agilent 2200 TapeStation. All the generated libraries contained similar amounts of fragmented RNA (37.91 ± 1.4 ng/μL) and had similar mean insert sizes of the libraries in a range from 298 to 299 bp. This result shows that the yield of the libraries generated with both extraction protocols and conditions is comparable in yield and quality. Twelve libraries of cDNA (2 extraction methods × 2 conditions × 3 biological replicates) were constructed from both treatment and control total RNA on the Illumina HiSeq platform, and 447,248,338 raw reads were acquired with a data set size of 37 million paired-end reads per sample with a length of 101 bp, which were submitted under NCBI Bioproject accession number PRJNA644633. The basic statistics of the total number of bases, reads, GC (%), Q20 (%) and Q30 (%) were calculated for the six samples and summarized in (). The respective Q20 scores were 97.58 to 98.41% and 96.91 to 98.23% for RNeasy and phenol-based methods, respectively, which demonstrates excellent sequence quality.
Figure 4. Electropherogram of post-library construction check from the Agilent 2200 TapeStation system for RNeasy extracted sample (Q-C1).
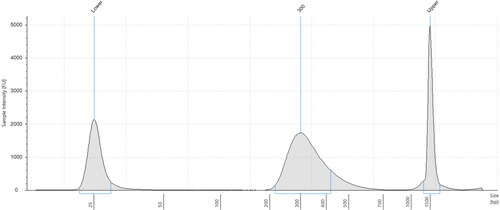
Table 4. mRNA-seq Library quality check Result - Agilent 2200 TapeStation.
Table 5. Basic statistics of the retrieved raw data.
RNA-Seq de novo assembly
Tightly restricted settings were executed which involved a simple correction to guarantee superior quality assembly. Upon elimination of low-quality bases and adapters, roughly 92.34 percent of the reads advanced through the quality trimming and a total of 412,970,860 clean reads were acquired with a great quality score of Q30 > 96.21 percent. (; ). The construction of the transcriptome was accomplished utilizing Trinity v2.4.0 including a K-mer value of 32. RNeasy based RNA samples did generate slightly better results with a maximum of 68,148 transcripts, rebuilt to ∼295 Mbp with the greatest transcript length of 11676 bp and an N50 of 3354 bp ().
Figure 5. Quality score across all bases [RNeasy extracted sample (Q-C1)] - dataset ready for assembly - Forward R1 (a) and Reverse R2 (b).
![Figure 5. Quality score across all bases [RNeasy extracted sample (Q-C1)] - dataset ready for assembly - Forward R1 (a) and Reverse R2 (b).](/cms/asset/0b79526f-f8b6-469d-91a8-8853877a0f21/tbeq_a_1910567_f0005_c.jpg)
Table 6. RNA-seq Paired-end data quality and adapter trimming using Trimmomatic.
Table 7. De-novo transcriptome assembly, general statistics.
The goal of this paper was focused on the total count of "longest" scaffolds (≥1000 bp), which could be used as a way to evaluate the general effectiveness of the extracted total RNA. This is primarily because the deteriorated RNA restricts the reconstruction of long scaffolds influencing sequencing performance. Likewise, our findings suggest that contaminants in RNA samples intervene with the cDNA synthesis from mRNA. A total of 51,381 transcripts were ≥ 1000 bp in length, which is far more comparable to those generated from most of the plant species in the extensive study for methods for isolating total RNA evaluation [Citation29].
Conclusions
The complexity of isolating high-quality RNAs from plant cells containing plentiful complex secondary metabolites generally hampers research projects that deal with RNA. The results from this study indicate that the commercial method RNeasy mini kit is a slightly better and suitable protocol for isolating intact and high-yield RNA from guar leaves without any contamination suitable for most transcriptome downstream processes. There were less pronounced significant differences in the quality, quantity, and integrity of the extracted total RNA between control and treated samples through both protocols. These outcomes were further proved through the effectiveness in the quality of either the constructed cDNA library or the assembled transcriptome. However, almost all plant species possess variable sizes of rRNA, forming intricacies in the reading of the RIN. Even with the recent upgrade of the Agilent 2100 Expert program, a lower RIN value than normal (< 6 − 7) remains obtainable. The data suggested that perhaps the issue appears to exist in the BioAnalyzer algorithm for evaluating the plant RNA containing several RNA bands rather than RNA integrity. Moreover, our results demonstrate that the most widely employed RNA quality metric (RIN) is not a strong predictor of the quality of plant RNA integrity. These outcomes offer new insights into the most effective methods for extracting high-quality RNA for sequencing and assembling plant transcriptomes. The techniques and suggestions given above could improve the cost and efficiency of RNA sequencing for genome centers and individual labs.
Author contribution statement
Conceptualization: AZG, AA, FA; Data curation: AZG, AA; Formal analysis: AZG, FA, AA; Funding acquisition: FA; Investigation: AZG, AA; Methodology: AZG; Supervision: FA, SK, MN; Validation: MT, SA; Writing – original draft: AZG, AA; Writing – review & editing: SK, MN, MT, SA
Disclosure statement
No potential conflict of interest was reported by the authors.
Data availability
The authors confirm that the data supporting the findings of this study are available within the article.
Additional information
Funding
Funding
References
- Borsani O, Valpuesta V, Botella MA. Developing salt tolerant plants in a new century: a molecular biology approach. Plant Cell, Tissue Organ Culture. 2003;73(2):101–115.
- Mallik S, Nayak M, Sahu BB, et al. Response of antioxidant enzymes to high NaCl concentration in different salt-tolerant plants. Biologia Plant. 2011;55(1):191–195.
- Al Hassan M, Estrelles E, Soriano P, et al. Unraveling salt tolerance mechanisms in halophytes: A comparative study on four Mediterranean Limonium species with different geographic distribution patterns. Front Plant Sci. 2017;8:1438.
- Gharbi E, Martinez JP, Benahmed H, et al. Phytohormone profiling in relation to osmotic adjustment in NaCl-treated plants of the halophyte tomato wild relative species Solanum chilense comparatively to the cultivated glycophyte Solanum lycopersicum. Plant Sci. 2017;258:77–89.
- Nikalje GC, Variyar PS, Joshi MV, et al. "Temporal and spatial changes in ion homeostasis and accumulation of flavanoids and glycolipid in a halophyte Sesuvium portulacastrum (L.) L. PLoS One. 2018;13(4):e0193394.
- Rahman MM, Rahman MA, Miah MG, et al. Mechanistic insight into salt tolerance of Acacia auriculiformis: the importance of ion selectivity, osmoprotection, tissue tolerance, and Na + exclusion. Front Plant Sci. 2017;8:155.
- Burman U, Garg BK, and, Kathju S. Interactive effects of thiourea and phosphorus on clusterbean under water stress. Biologia Plant. 2004;48(1):61–65.
- Ashraf MY, Akhtar K, Sarwar G, et al. Role of the rooting system in salt tolerance potential of different guar accessions. Agron Sustain Dev. 2005;25(2):243–249.
- Francois LE, Donovan TJ, Maas EV. Salinity effects on emergence, vegetative growth, and seed yield of guar. Agronj. 1990;82(3):587–592.
- Wang Z, Gerstein M, and, Snyder M. RNA-Seq: a revolutionary tool for transcriptomics. Nat Rev Genet. 2009;10(1):57–63.
- An YM, Song LL, Liu YR, et al. De Novo transcriptional analysis of Alfalfa in response to saline-alkaline stress. Front Plant Sci. 2016;7:931.
- Diray-Arce J, Clement M, Gul B, et al. Transcriptome assembly, profiling and differential gene expression analysis of the halophyte Suaeda fruticosa provides insights into salt tolerance. BMC Genomics. 2015;16(1):353.
- Hess M, Wildhagen H, Junker LV, et al. Transcriptome responses to temperature, water availability and photoperiod are conserved among mature trees of two divergent Douglas-fir provenances from a coastal and an interior habitat. BMC Genomics. 2016;17(1):682.
- Sharma R, Mishra M, Gupta B, et al. De Novo assembly and characterization of stress transcriptome in a salinity-tolerant variety CS52 of Brassica juncea. PLoS One. 2015;10(5):e0126783.
- Woldesemayat AA, and, Ntwasa M. Pathways and network based analysis of candidate genes to reveal cross-talk and specificity in the Sorghum (Sorghum bicolor (L.) Moench) responses to drought and it’s co-occurring stresses. Front Genet. 2018;9:557.
- Angela Pérez-Novo C, Claeys C, Speleman F, et al. Impact of RNA quality on reference gene expression stability. Biotechniques. 2005;39(1):52–56.
- Gehrig HH, Winter K, Cushman J, et al. An improved RNA isolation method for succulent plant species rich in polyphenols and polysaccharides. Plant Mol Biol Rep. 2000;18(4):369–376.
- Katterman FRH, Shattuck VI. An effective method of DNA isolation from the mature leaves of Gossypium species that contain large amounts of phenolic terpenoids and tannins. Prep Biochem. 1983;13(4):347–359.
- Levi A, Galau GA, Wetzstein HY. A rapid procedure for the isolation of RNA from high-phenolic-containing tissues of pecan. HortSci. 1992;27(12):1316–1318.
- Sambrook HC, Fritsch, EF, Maniatis, T. 1989. Molecular cloning: a laboratory manual. Cold Spring Harbor, New York: Cold Spring Harbor Laboratory Press.
- Agrawal AA. Current trends in the evolutionary ecology of plant defence. Functional Ecol. 2011;25(2):420–432.
- Berenbaum MR, Zangerl AR. Facing the future of plant-insect interaction research: le retour à la “raison d’être". Plant Physiol. 2008;146(3):804–811.
- Loomis WD. 1974. Overcoming problems of phenolics and quinones in the isolation of plant enzymes and organelles. Methods in enzymology, 31, 528–544. https://doi.org/10.1016/0076-6879(74)31057-9.
- Macel M, Van Dam NM, Keurentjes JJ. Metabolomics: the chemistry between ecology and genetics. Mol Ecol Resour. 2010;10(4):583–593.
- Sharma AD, Gill PK, Singh P. RNA isolation from plant tissues rich in polysaccharides. Anal Biochem. 2003;314(2):319–321.
- Walter J, Hein R, Auge H, et al. How do extreme drought and plant community composition affect host plant metabolites and herbivore performance?Arthropod-Plant Inter. 2012;6(1):15–25.
- Bilgin DD, DeLucia EH, Clough SJ. A robust plant RNA isolation method suitable for Affymetrix GeneChip analysis and quantitative real-time RT-PCR. Nat Protoc. 2009;4(3):333–340.
- Gayral P, Weinert L, Chiari Y, et al. Next-generation sequencing of transcriptomes: a guide to RNA isolation in nonmodel animals. Mol Ecol Resour. 2011;11(4):650–661.
- Johnson MT, Carpenter EJ, Tian Z, et al. Evaluating methods for isolating total RNA and predicting the success of sequencing phylogenetically diverse plant transcriptomes. PLoS One. 2012;7(11):e50226.
- Behnam B, Bohorquez-Chaux A, Castaneda OF, et al. An optimized isolation protocol yields high-quality RNA from cassava tissues (Manihot esculenta Crantz). FEBS Open Bio. 2019;9(4):814–825.
- Liu L, Han R, Yu N, et al. A method for extracting high-quality total RNA from plant rich in polysaccharides and polyphenols using Dendrobium huoshanense. PloS One. 2018;13(5):e0196592.
- Sellin MJ, Kiss AJ, Smith AW, et al. A comparison of commercially-available automated and manual extraction kits for the isolation of total RNA from small tissue samples. BMC Biotechnol. 2014;14(1):94–94.
- Iandolino AB, Goes Da Silva F, Lim H, et al. High-quality RNA, cDNA, and derived EST libraries from grapevine (Vitis vinifera L.). Plant Mol Biol Rep. 2004;22(3):269–278.
- Matsubara T, Soh J, Morita M, et al. DV200 Index for Assessing RNA integrity in next-generation sequencing. Biomed Res Int. 2020;2020:9349132.
- Alshameri A, Al-Qurainy F, Khan S, et al. Appraisal of guar [Cyamopsis tetragonoloba (l.) Taub.] accessions for forage purpose under the typical Saudi Arabian environmental conditions encompassing high temperature, salinity and drought. Pak J Bot. 2017;49(4):1405–1413.
- Kanani P, Shukla YM, Modi AR, et al. Standardization of an efficient protocol for isolation of RNA from Cuminum cyminum. J King Saud Univ-Sci. 2019;31(4):1202–1207.
- Imbeaud S, Graudens E, Boulanger V, et al. Towards standardization of RNA quality assessment using user-independent classifiers of microcapillary electrophoresis traces. Nucleic Acids Res. 2005;33(6):e56–e56.
- Padmanaban A, Ruediger S, Charmian C. RNA quality control using the agilent 2200 TapeStation system–assessment of the RIN e quality metric (Application note No.5991-0023EN). Agilent Technologies Application Notes. 2012. Retrieved from https://hpst.cz/sites/default/files/oldfiles/rna-quality-control-using-agilent-2200-tapestation-system-assessmentrine-quality-metric.pdf
- Andrews S. 2010. FastQC: a quality control tool for high throughput sequence data. Cambridge, United Kingdom: Babraham Bioinformatics, Babraham Institute.
- Grabherr MG, Haas BJ, Yassour M, et al. Full-length transcriptome assembly from RNA-Seq data without a reference genome. Nat Biotechnol. 2011;29(7):644–652.
- Haas BJ, Papanicolaou A, Yassour M, et al. De novo transcript sequence reconstruction from RNA-seq using the Trinity platform for reference generation and analysis. Nat Protoc. 2013;8(8):1494–1512.
- Patil CG. Nuclear DNA amount variation in Cyamopsis DC (Fabaceae). Cytologia. 2004;69(1):59–62.
- Minhas PS, Rane J, and RK. Pasala 2017. Abiotic stress management for resilient agriculture. New York, USA: Springer.
- Reuter JA, Spacek DV, Snyder MP. High-throughput sequencing technologies. Mol Cell. 2015;58(4):586–597.
- Kukurba KR, Montgomery SB. RNA sequencing and analysis. Cold Spring Harb Protoc. 2015;2015(11):pdb.top084970. pdb. top084970.
- Almarza J, Morales S, Rincon L, et al. Urea as the only inactivator of RNase for extraction of total RNA from plant and animal tissues. Anal Biochem. 2006;358(1):143–145.
- Bekesiova I, Nap J-P, and, Mlynarova L. Isolation of high quality DNA and RNA from leaves of the carnivorous plant Drosera rotundifolia. Plant Mol Biol Rep. 1999;17(3):269–277.
- Chang S, Puryear J, Cairney J. A simple and efficient method for isolating RNA from pine trees. Plant Mol Biol Rep. 1993;11(2):113–116.
- Kiefer E, Heller W, Ernst D. A simple and efficient protocol for isolation of functional RNA from plant tissues rich in secondary metabolites. Plant Mol Biol Rep. 2000;18(1):33–39.
- Geuna F, Hartings H, Scienza A. A new method for rapid extraction of high quality RNA from recalcitrant tissues of grapevine. Plant Mol Biol Rep. 1998;16(1):61–67.
- Chomczynski P, Sacchi N. The single-step method of RNA isolation by acid guanidinium thiocyanate-phenol-chloroform extraction: twenty-something years on . Nat Protoc. 2006;1(2):581–585.
- Chomzynski P. Single-step method of RNA isolation by acid guanidinium thiocyanate-phenol-chloroform extraction. Anal Biochem. 1987;162(1):156–159.
- Puissant C, Houdebine LM. An improvement of the single-step method of RNA isolation by acid guanidinium thiocyanate-phenol-chloroform extraction. Biotechniques. 1990;8(2):148–149.
- Newbury HJ, Possingham JV. Factors affecting the extraction of intact ribonucleic Acid from plant tissues containing interfering phenolic compounds. Plant Physiol. 1977;60(4):543–547.
- Wan C-Y, Wilkins TA. A modified hot borate method significantly enhances the yield of high-quality RNA from cotton (Gossypium hirsutum L.). Anal Biochem. 1994;223(1):7–12.
- Jakovljević KV, Spasić MR, Mališić EJ, et al. Comparison of phenol-based and alternative RNA isolation methods for gene expression analyses. J Serb Chem Soc. 2010;75(8):1053–1061.
- Russell DW, Sambrook J. 2001. Molecular cloning: a laboratory manual. Vol. 1. Cold Spring Harbor, NY: Cold Spring Harbor Laboratory.
- Tavares L, Alves PM, Ferreira RB, et al. Comparison of different methods for DNA-free RNA isolation from SK-N-MC neuroblastoma. BMC Res Notes. 2011;4(1):3.doi:10.1186/1756-0500-4-3.
- Zhen L-N, Kang W, Ying-Jun Z, et al. A method for high-quality RNA extraction from tall fescue. Afr J Biotechnol. 2011;10(37):7161–7165.
- De Coaña YP, Parody N, Fernández-Caldas E, et al. A Modified Protocol for RNA isolation from high polysaccharide containing Cupressus arizonica Pollen. Applications for RT-PCR and phage display library construction. Mol Biotechnol. 2010;44(2):127–132.
- Wilfinger WW, Mackey K, and, Chomczynski P. Effect of pH and ionic strength on the spectrophotometric assessment of nucleic acid purity. Biotechniques. 1997;22(3):4746. 478-81.
- Pester D, Milcevicova R, Schaffer J, et al. Erwinia amylovora expresses fast and simultaneously hrp/dsp virulence genes during flower infection on apple trees. PLoS One. 2012;7(3):e32583.
- Schroeder A, Mueller O, Stocker S, et al. The RIN: an RNA integrity number for assigning integrity values to RNA measurements. BMC Mol Biol. 2006;7(1):3.
- Vasanthaiah HK, Katam R, Sheikh MB. Efficient protocol for isolation of functional RNA from different grape tissue rich in polyphenols and polysaccharides for gene expression studies. Electron J Biotechnol. 2008;11(3):0–51.
- Babu S, Gassmann M. 2011. Assessing integrity of plant RNA with the Agilent 2100 Bioanalyzer. California, USA: Agilent Technologies.
- Pereira MA, Imada EL, Guedes RLM. RNA-seq: applications and best practices. In Applications of RNA-Seq omics strategies-from microorganisms to human health. 2017. p. 3–36. London, United Kingdom: IntechOpen.
- Hall TC. 2018. Nucleic acids in plants: Volume I. Florida, USA: CRC Press.
- Smart M, Roden LC. A small-scale RNA isolation protocol useful for high-throughput extractions from recalcitrant plants. S Afr J Bot. 2010;76(2):375–379.
- Kim WS, Haj-Ahmad Y. Evaluation of Plant RNA Integrity Number (RIN) generated using an Agilent BioAnalyzer 2100. Application Note 80 Plant/Fungi RNA Sample Preparation - Norgen Biotek Corp. 2016. Retrieved from https://norgenbiotek.com/sites/default/files/resources/App-Note-80-Plant-RNA-RIN.pdf