
Abstract
Different feeding patterns exhibit completely different and heritable growth properties in livestock, but the underlying epigenetic mechanisms remain unclear. Here, we investigated genome-wide DNA-methylation and gene expression under grazing and confinement regimen feeding strategies with Lvliang Black goat. We identified 102 differently expressed genes and 7,833 differentially methylated regions (DMRs) between the two groups. Integrating DNA-methylation and gene expression showed that genes in DMRs exhibit significantly different expression level (FDR < 0.05). KEGG pathway analysis indicated that most of the genes involved in environment adaptation pathways like lipid transpor and metabolism immunity. In sum, our data provided insight into the epigenetic mechanism underlying growth property difference resulting from distinct feeding patterns in goat, and also offered theoretical basis for the rational utilization of germplasm resources of local breeds.
Supplemental data for this article is available online at https://doi.org/10.1080/13102818.2021.1914164 .
Introduction
Variation in environmental factors, including light, humidity, temperature and salinity, could alter the gene expressional patterns of individuals, which may lead to their morphological changes [Citation1]. The genetic mechanism underlying synchronous changes of environment-morphology may relate to epigenetic moditication, which could regulate gene expression patterns. In animals, DNA methylation preferentially occurs at the 5’position of cytosine in CpG dinucleotide agglomeration region, which is known as CpG islands (CGIs). Cytosine methylation is a kind of classical epigenetic marker and usually presents three forms (CG, CHG and CHH, where H is any base but G). DNA methylation is catalyzed and maintained by specific DNA methyl transferases like Dnmt3 and Dnmt1. The maintenance of DNA methylation can be heavily influenced by environment, diet, aging and behaviors [Citation2–6]. It has been reported that DNA methylation could affect gene expression levels by reducing the rate of transcriptional elongation [Citation7,Citation8]. Although gene expression and methylation exhibit complex relationships, high levels of gene expression usually associate with low levels of methylation in the promoter region of genes [Citation9]. Recently, numerous studies have investigated genome-wide DNA methylation patterns in livestock [Citation10–16], but most of these studies focus on the relevance between DNA methylation and economic traits [Citation17,Citation18]. The DNA methylation variation and relative gene expression changes underlying different feeding strategies in livestock still remains unknown.
The Lvliang Black goat (LBG) is an excellent economic breed of Capra hircus, which supply fleece, meat, leather and delicious mutton for aborigines. The LBG is mainly distributed in Lvliang mountainous area of Loess Plateau in Shanxi where the landscape is barren with serious soil erosion, little rain and sparse vegetation. The breed is famous for reliable resistance to crude feed and numerous diseases and having strong adaptability to extreme environmental habitats. Nowadays, with the rapid development of commercial feeding model, like other strains, LBGs are mainly reared in the comfortable conditions where they have enough food, water and favorable environment. Thus, the LBG strain provides a good model to investigate the genetic divergence resulting from different feeding strategies of livestock.
In the present study, we conducted a comparative analysis about the genome-wide DNA methylation pattern and transcriptome between the grazing and confinement regimen group to explore the genetic difference of difference feeding strategies of LBG.
Materials and methods
Ethics statement
Animal care and experiments were performed according to the guideline established by the Regulation for the Administration of Affairs Concerning Experimental Animals (Ministry of Science and Technology, China, 2004), and approved by the Animal Welfare and Research Ethics Committee at Shanxi Agricultural University.
Samples collection
Six LBG individuals were randomly collected from two groups of different rearing systems. Three individuals were obtained from a grazing group in the natural pasture. The other three individuals were obtained from the confined rearing group with enough hay and free access to feed and water. All the six individuals are female and two-year-old, with no significant differnces in body weight. Blood samples from jugular vein were collected via the precava from these individuals and immediately frozen in liquid nitrogen.
RNA isolation and library construction
The RNA sequencing design of this study is described in Scott et al. [Citation19]. Total RNA was extracted from the jugular vein blood of the six individuals. Concentration of RNA was measured using NanoDrop 2000 (ThermoFisher, USA), and its integrity was assessed using the RNA Nano 6000 Assay Kit of the Agilent Bioanalyzer 2100 system (Agilent, USA). Strand-specific RNA library was prepared using the NEBNext Ultra Directional RNA Library Prep Kit for Illumina (NEB, USA) according to the manufacturer’s instructions. Library validation and quantification was conducted using the Agilent Bioanalyzer High Sensitivity Kit (Agilent, USA Cat#5067-4626) and Qubit dsDNA HS Assay kit (ThermoFisher, USA). The 100 bp paired-end sequencing was performed on the Illumina HiSeq2500 platform (Illumina, USA).
DNA extraction and whole-genome bisulfite sequencing
The DNA extraction and whole-genome bisulfite sequencing in this study was performed as described [Citation20]. Three replicated DNA samples from the groups were pooled into one sample, respectively. Whole-genome bisulfite sequencing DNA libraries were prepared following the standard protocol. Briefly, a total amount of 5.2 μg DNA was spiked with 26 ng lambda DNA and was fragmented to 200–300 bp by a Covaris S200 sonicator (Covairs, USA). After the end repair and adenylation reaction, the fragments were ligated with the cytosine-methylated barcodes. Next, these DNA fragments were treated twice with bisulfite using an EZ DNA Methylation-GoldTM Kit (Zymo Research, USA). The generated single-strand DNA fragments were amplified by polymerase chain reactin (PCR) using the KAPA HiFi HotStart Uracil + ReadyMix (2×) and quantified by Qubit Fluorometern. Bisulfite sequencing library was sequenced at the Illumina Hiseq 2500 platform.
Quality control and mapping
The base calling of RNA-seq and whole-genome bisulfite sequencing was performed according to the standard Illumina pipeline. Paired-end reads with 100 bp length of 6 RNA-seq and 2 whole genome methylation sequencing (WGBS) libraries were generated. Raw reads of both DNA and RNA were firstly checked using the FastQC tool, and subsequently trimmed at the 3′ end to remove the adaptor and low-quality nucleotides by Trimmomatic. The obtained good-quality clean reads were reserved for futher analysis. The goat (Capra hircus) genome (GCA_001704415.1) was used as a reference genome for clean reads alignment and assembly. Software STAR and Bismark were used with default parameters for RNA-seq and WGBS reads mapping, respectively.
Expression analysis
The mapped short reads of RNA-seq data were extracted and processed to assemble transcripts. Transcripts quantification was performed by Cufflinks. Per Kilobase of transcript per Million fragments mapped (FPKM) was used to measure the expression level. FPKM values were logarithm transformed for further analysis for the right skew of transcriptional level distribution. The Spearman’s correlation coefficients of the expression pattern among the sample pairs were calculated to evaluate the similarity of the sample biological background. The significantly differentially expressed genes (DEGs) were identified by the cuffdiff tool in the Cufflinks software. FDR method was applied in P value adjustment in order to control the multiple testing error.
Identification of putative DMR
In order to evaluate the DNA methylation level (ML), the sliding-window approach, with window size of 3,000 bp and step size of 600 bp, was employed. The sum of methylated and unmethylated read counts was calculated in each window and the ML was calculated according to a previous study [Citation21]. The corrected ML was estimated as: ML (corrected) = ML-r/1-r (where r represents the non-conversion rate). The percentage of methylation levels was calculated as the proportion of mC sites (mCs) on the total C sites (). The relative proportion of mCs in three contexts was calculated as the proportion of mCG, mCHG and mCHH on the total mC sites, respectively. Differentially methylated regions (DMRs) were identified by swDMR software (http://122.228.158.106/swDMR/) with a sliding-window approach (window = 1,000 bp, step length = 100 bp). The Fisher test was applied to detect significant DMRs. After DMRs were identified, genes located in DMRs were characterized.
Table 2. Summary of methylation sequencing data.
Functional enrichment analysis
Gene Ontology (GO) and Kyoto Encyclopedia of Genes and Genomes (KEGG) enrichment were employed for DE genes and DMR-associated genes function clustering and pathway analysis. GO analysis was implemented by the GOseq R package, which corrects for gene length bias. GO terms with corrected P-value less than 0.05 were considered as significantly enriched by DMR-related genes. KOBAS software was used to test the statistical enrichment of DMR-related genes in KEGG pathways.
Integrative analysis
Genes that were expressed differentially between any pair of tissues were selected by cuffdiff, a tool package within Cufflinks. To explore whether these genes had methylation variation as well, we performed t tests for beta values between each pair of tissues, and performed analysis of variance (ANOVA) to compare beta values. The numbers of genes that show significant differences between tissues both in transcriptional and methylation levels were counted. The distance of CpG markers to TSS was used as a covariate factor for a regression analysis to test if it was a confounding factor in this analysis. To detect the correlation between DNA methylation and gene expression, we performed ANOVA to select the CpG markers that showed methylation variation. Regression analysis followed to test whether the changes in methylation were correlated with gene expression. All tests were controlled by FDR to adjust for multiple tests. The distribution of p values of regression analysis was drawn to check whether the distribution was uniform. CpG markers were then grouped into their locations, inside or outside CpG islands, and the effects of location on the distribution of Pearson’s correlation was tested. All data processing and analyses were conducted in a Dell PowerEdge R910 worktation.
Results
Transcriptome profiles of Lvliang Black goats under grazing and confined feeding conditions
To explore which genes respond to grazing and confined rearing feeding patterns, LBG blood cells transcriptome data from the 6 individuals were obtained by RNA-Seq. After filtering for low quality reads, the number of clean reads ranged with 22,030,293–29,015,974 with a relatively high base quality (Q30 > 92.70% at all samples) (). The mapping rate of all samples ranged from 84.60% to 87.25% when mapped against the Capra hircus reference genome. We obtained a total of 15971 expressed genes after transcript assembly. DEG analysis towards the genes revealed 102 genes which were differentially expressed between the two groups, with 74 of which were up-regulated and 28 were down-regulated in the confined rearing group ( and ). Five DEGs were randomly selected and examined by qRT-PCR using three additional goats from each group. The qRT-PCR results were in good agreement with the RNA-seq data, indicating the reliability of our RNA-seq data (). Functional enrichment analysis for the DEGs shows that 75 genes enriched in 45 GO terms involved in development and stress response like biological regulation, development process, immune system process, metabolic process and response to stimulus (). KEGG pathway analysis showed that 27 DEGs were mapped to 53 pathways which involved in cellular process, environmental information process, genetic information process, diseases, metabolism, organismal system ( and ).
Figure 1. Differentially expressed genes between LBG under grazing and confined feeding conditions. Six LBG individuals were randomly collected from the two groups under different rearing systems. Three individuals were obtained in grazing group in the natural pasture. The other three individuals were obtained from the confined feeding group with enough hay and free access to feed and water.
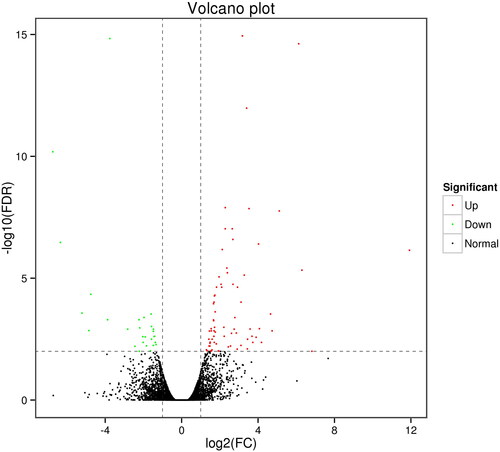
Figure 2. Validation of the RNA-seq data by qRT-PCR. Five DEGs were randomgly selected. The relative expression values were normalized to GAPDH.
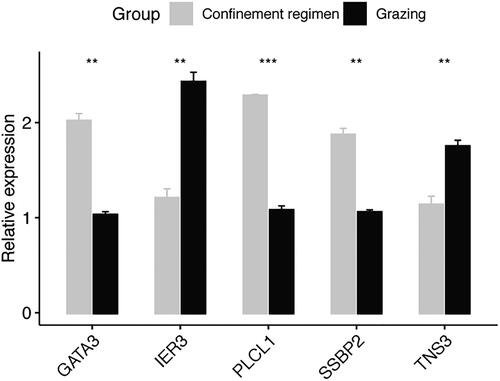
Table 1. Summary of clean reads of the transcriptome samples.
Genome-wide methylation profiles of Lvliang Black goats under grazing and confined rearing conditions
To explore genome-wide DNA methylation difference between grazing and reared groups, we performed methylation sequencing. High-quality data (confined rearing: 77.58% of raw reads; grazing: 79.39% of raw reads) was obtained by filtering out low quality reads/bases at each group. The high quality reads were mapped against the goat reference genome with an extremely high bisulfite conversion rate (> 99.52% at all samples). In addition, the average depth of the two groups was respectively 28× (grazing) and 27× (confined rearing) (). Over 92% regions on the genome were covered by at least one read and more than 83% regions in the whole genome were covered by at least 10 clean reads. These results indicated our methylation signals have a very low false positive rate and could be employed for the following analysis.
The overall distribution and levels of DNA methylation on the LBG genome were evaluated with a window size of 100 kb across every chromosome. Our results showed that all three types of DNA methylation were detected at the 5′ position of cytosine. The methylation at CG sites reached 87.95% in the grazing group and 88.7% in the confined rearing group ( and ). However, the CHG and CHH methylation occur in the LBG genome with a low level. The incidence rate of the CHG methylation was less than 3%, and the CHH methylation was less than 10% in both groups. The overall methylation level of CG sites was obviously higher than that of the CHG and CHH, suggesting that CG methylation is the dominant methylation type in LBG genome. Furthermore, the CG type methylation majorly emerged on the 2 kb up-stream of genes, and its level was gradually attenuated with the positions approaching to the 1st exon of genes and reached the lowest level in the TSS region (), while the CHH and CHG type methylation was uniformly distributed in gene regions. In accord with the differentially methylated regions (DMRs), sequences downstream and upstream of genes generally have higher level of differentially methylated positions (DMPs) than the gene body. However, DMPs generally enriched in transcription start site at both feeding patterns, which may indicate they play roles in the regulation of gene expression ().
Figure 3. Genome-wide DNA methylation distribution of LBG under grazing and confined feeding conditions.
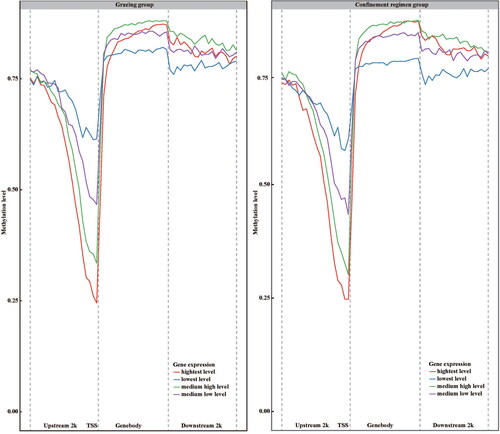
Table 3. Percentage of each type of methylation detected in grazing and confinement regimen groups.
Comparative analysis identified 7833 DMRs and 280,550 DMPs, with 7811 CG, 21 CHH and 1 CHG DMRs, and 273,322 CG, 1,717 CHH and 5511 CHG DMPs across the LBG genome. Interestingly, we observed that the grazing feeding pattern had a higher level of DNA methylation than the confined rearing feeding pattern. We observed that 2,057 genes were enriched by DMPs (FDR < 0.01) as well as 1,528 genes were enriched by DMRs (Supplemental Table S4), but 3432 genes had at least one DMR, which therefore were annotated as differentially methylated genes (DMGs) (Supplemental Table S4). Functional enrichment analysis showed that these genes are involved in cellular process, single-organism process, biological regulation, metabolic process, cell part, organelle terms and binding and catalytic activity ( and Supplemental Table S5). Interestingly, functional enrichment for the DMGs from CHH regions showed that they were enriched in the GO terms that were also enriched by DMGs from CG DMRs. However, genes in CHG regions did not enrich into any terms. KEGG analysis showed that 1034 out of the 3432 DMGs in CG DMRs were mapped to 282 pathways (Supplemental Tables S5 and S6), with large proportion of them being mapped to 49 pathways (Supplemental Figure S5).
Figure 4. Functional enrichment analysis of differentially expressed genes was obtained by integration analysis of DNA methylome and transcriptome sequencing under grazing and confined feeding conditions.
Integrative analysis of the transcriptome and methylome profiles
The correlation analysis was conducted to determine whether the expression level of genes was affected by DNA methylation. The distances of methylation sites to transcription initiation site (TSS) was used as a weighted coefficient for adjusting the methylation levels. Our results showed that the weighted methylation level of CG context across the region upstream to the gene body was significantly associated with the FPKM values both in the grazing and confined rearing group (Supplemental Table S7), which suggests that the methylation levels on upstream and gene body regions may affect the expression level of genes. However, the mechanism of the impact of DNA methylation on the gene expression level may unlikely be linear, as the values of the Pearson correlation coefficient were quite low (ranging from −0.03 to −0.11).
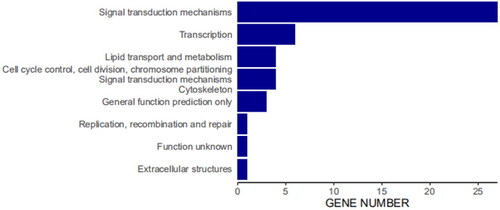
Furthermore, 48 DMRs were overlapped with 21 DEGs between the grazing and confinement regimen group (Supplemental Table S8), with 39 DMRs located in gene upstream regions and 9 DMRs in introns. Function annotation for the DEGs showed that they belonged to 9 functional categories (). Among them, 12 genes were involved in signal transduction mechanisms (NCALD、SAMSN1, TRAT1, GPR171, CD247, TNS3, BLK, MERTK, CADM1, INPP4B, IL6ST and IER3), and 3 genes in general function prediction only (RAPH1, ZNF462 and GPR183). Other genes respectively were involved in extracellular structure (FSTL1), lipid transport and metabolism (PLCL1), replication and repair (SSBP2), transcription (GATA3), and cell division (NCALD). Among the DEGs, 5 genes (NCALD, TRAT1, CD247, MERK and BLK) exhibited different methylation between grazing and confined rearing feeding groups at the intron regions. Correspondingly, NCALD, TRAT1 and CD247 were significantly up-regulated in the grazing group comparing with the confinement regimen group.
Discussion
It has been reported that many flora and fauna species exposed to extreme environmental conditions usually exhibit multi-aspect adaptation and genetic modifications [Citation1,Citation5,Citation22]. In this study, we conducted a transcriptome and genome-wide methylation profiling towards LBG under grazing and confinement regimen feeding conditions to exploit the genetic divergence underlying different feeding patterns.
Our results showed that 102 genes exhibit different expression between the grazing and confinement regimen feeding conditions. These differentially expressed genes were identified to be involved in various functional categories. Of these DEGs, 27 genes were involved in cellular process, environmental information process, genetic information process, diseases in human, metabolism and organismal system, which suggests that different feeding strategies may have a wide range of impact on individual condition, from genic and cellular process, metabolism, to tissue assembly and environment adaptation. On the other hand, we detected numerous DMRs, and both functional and pathway enrichment showed that the difference in genomic methylation between the two groups also involves various functional categories, which further confirms that different feeding methods result in genetic deviation in LBG.
Genomic methylation analysis showed that CG methylation is the major type of DNA methylation in LBG, which is consistent with a previous study [Citation5]. The significantly reduced CG methylation level from genic distal regions to TSS regions suggests that the methylation level may be negatively correlated with the transcriptional level in LBG, but their correlation is generally not strong. The hypothesis could be further confirmed by the low methylation level in highly expressed genes in the TSS. Our results are in agreement with the previous observations that gene expression is influenced by DNA methylation [Citation7,Citation8]. Although hyper-DNA methylation is generally associated with gene expression silencing, the intricate relationships among genes and relative pathways had made us unable to clarify their casual relationship unless we have large-scale multiple omics data. The complexity is also demonstrated by the low correlation level between DNA methylation and gene expression.
Integrative analysis of DNA methylation and transcriptome showed that 12 DEGs were identified in 48 DMR regions. These genes were involved in signal transduction mechanisms, lipid transport and metabolism and transcription, etc. Numerous studies have confirmed that all of these processes are crucial to organismal homeostasis and the response to the changed environment and various stress factors [Citation23,Citation24]. Thus, the methylation and expression changes of these genes may be associated with the genetic divergence of feeding strategies in LGB. Furthermore, PLCL1 gene which encodes Inactive Phospholipase C-like protein 1 is involved in the inositol phospholipid-based intracellular signaling cascade. This gene is also involved in the GABAergic synapse pathway. It has been reported that GABA is a predominant inhibitory neurotransmitter which regulates glutamatergic activity [Citation25]. Function analyses about GABA in rats showed that its different levels can regulate heat production and loss associated with the changes of ambient temperature [Citation26]. The climate of the Loess plateau is harsh with extreme torridity in summer and frigidity in winter. The grazing group has to cope to such serious climate switch, while the confined feeding group enjoys comfortable environment at any time. Therefore, the different expression of gene PLCL1 between the two groups may reflect the differences in the strategies in dealing with changing environment temperature.
The INPP4B gene (Inositol polyphosphate 4-phosphatase type II) is ubiquitously expressed in various tissues and acts as an important regulatory factor by regulating the PI3K/Akt signal pathway in various tumors [Citation27]. Both functional loss and overexpression of the gene would result in carcinogenesis. The different expression of INPP4B in LGB may reflect genetic discrepancy in the resistance to environment pathogens. The hypothesis is also supported by the other DEG, IL6ST gene. IL6ST (IL-6 signal transducer) is expressed in various tissues. The results showed that the gene is involved in Jak-STAT signaling pathway and pluripotency of stem cells. The Jak-STAT signaling pathway widely participates in many biological processes, including proliferation, differentiation, migration, apoptosis and cell survival [Citation28]. It has been reported that the pathway plays a very important role in numerous developmental and homeostatic processes, including hematopoiesis, immune cell development, stem cell maintenance, organismal growth, and mammary gland development [Citation29]. Thus, different expression levels of gene IL6ST may exhibit multiple aspects of divergence in biological processes such as immunity, homeostasis, growth and development.
Conclusions
In summary, the genetic and epigenetic basis underlying the response to different feeding strategies were investigated by whole genome methylation and transcriptomic profiling in Lvliang goat inhabiting the Loess Plateau. Several genes in DMRs exhibited significant differential expression patterns and were involved in lipid transport, metabolism and immunity. The results suggested that the two different feeding patterns may involve widely modified physiological processes at multiple hierarchies. Further elaborate functional studies about the candidate genes in the study would validate the systematic genetic and molecular basis associated with different feeding strategies in the livestock.
Authors’ contributions
Xi Wang and Sujun Wu conceived the experiments. Xi Li contributed samples. Kerong Shi analysed the data and prepared the original draft. Xi Wang and Yanghua He reviewed and edited the paper.
Disclosure statement
We declare that we do not have any commercial or associative interest that represents a conflict of interest in connection with the work submitted.
Data availability statement
All data that support the findings in this study are available from the corresponding author upon reasonable request.
Additional information
Funding
References
- Bijlsma R, Loeschcke V. Environmental stress, adaptation and evolution: an overview. J Evol Biol. 2005;18(4):744–749.
- Jaenisch R, Bird A. Epigenetic regulation of gene expression: how the genome integrates intrinsic and environmental signals. Nat Genet. 2003;33 Suppl:245–254.
- Goll MG, Bestor TH. Eukaryotic cytosine methyltransferases. Annu Rev Biochem. 2005;74:481–514.
- Teixeira FK, Colot V. Repeat elements and the Arabidopsis DNA methylation landscape. Heredity (Edinb). 2010;105(1):14–23.
- Namous H, Penagaricano F, Del Corvo M, et al. Integrative analysis of methylomic and transcriptomic data in fetal sheep muscle tissues in response to maternal diet during pregnancy. BMC Genomics. 2018;19(1):123:
- Giurgescu C, Nowak AL, Gillespie S, et al. Neighborhood environment and DNA methylation: implications for cardiovascular disease risk. J Urban Health. 2019;96(Suppl 1):23–34.
- Szyf M. Genes methylated in cancer that are resistant to activation by DNA demethylating agents and histone deacetylase inhibitors. Epigenomics. 2012;4(1):15.
- Lou S, Lee HM, Qin H, et al. Whole-genome bisulfite sequencing of multiple individuals reveals complementary roles of promoter and gene body methylation in transcriptional regulation. Genome Biol. 2014;15(7):408:
- Jones PA. Functions of DNA methylation: islands, start sites, gene bodies and beyond. Nat Rev Genet. 2012;13(7):484–492.
- Doherty R, Couldrey C. Exploring genome wide bisulfite sequencing for DNA methylation analysis in livestock: a technical assessment. Front Genet. 2014;5:126.
- Frattini S, Capra E, Lazzari B, et al. Genome-wide analysis of DNA methylation in hypothalamus and ovary of Capra hircus. BMC Genomics. 2017;18(1):476:
- Fan Y, Liang Y, Deng K, et al. Analysis of DNA methylation profiles during sheep skeletal muscle development using whole-genome bisulfite sequencing. BMC Genomics. 2020;21(1):327:
- Thompson RP, Nilsson E, Skinner MK. Environmental epigenetics and epigenetic inheritance in domestic farm animals. Anim Reprod Sci. 2020;220:106316.
- Sevane N, Martinez R, Bruford MW. Genome-wide differential DNA methylation in tropically adapted Creole cattle and their Iberian ancestors. Anim Genet. 2019;50(1):15–26.
- Yang Y, Zhou R, Mu Y, et al. Genome-wide analysis of DNA methylation in obese, lean and miniature pig breeds. Sci Rep. 2016;6(1):30160.
- Yang Y, Liang G, Niu G, et al. Comparative analysis of DNA methylome and transcriptome of skeletal muscle in lean-, obese-, and mini-type pigs. Sci Rep. 2017;7(1):39883.
- Li Y, Carrillo JA, Ding Y, et al. DNA methylation, microRNA expression profiles and their relationships with transcriptome in grass-fed and grain-fed Angus cattle rumen tissue. PLoS One. 2019;14(10):e0214559:
- Fu Y, Li J, Tang Q, et al. Integrated analysis of methylome, transcriptome and miRNAome of three pig breeds. Epigenomics. 2018;10(5):597–612. :
- Scott LJ, Erdos MR, Huyghe JR, et al. The genetic regulatory signature of type 2 diabetes in human skeletal muscle. Nat Commun. 2016;7:11764.
- Wang Q, Gu L, Adey A, et al. Tagmentation-based whole-genome bisulfite sequencing. Nat Protoc. 2013;8(10):2022–2032.
- Yang Y, Fan X, Yan J, et al. A comprehensive epigenome atlas reveals DNA methylation regulating skeletal muscle development. Nucleic Acids Res. 2021;49(3):1313–1329.
- Poscic N, Montanari T, D’Andrea M, et al. Breed and adaptive response modulate bovine peripheral blood cells’ transcriptome. J Anim Sci Biotechnol. 2017;8(11):1–16.
- Feige JN, Auwerx J. Transcriptional targets of sirtuins in the coordination of mammalian physiology. Curr Opin Cell Biol. 2008;20(3):303–309.
- Nestor A, Plaut DC, Behrmann M. Feature-based face representations and image reconstruction from behavioral and neural data. Proc Natl Acad Sci U S A. 2016;113(2):416–421.
- Takayama C, Inoue Y. Extrasynaptic localization of GABA in the developing mouse cerebellum. Neurosci Res. 2004;50(4):447–458.
- Ishiwata T, Saito T, Hasegawa H, et al. Changes of body temperature and thermoregulatory responses of freely moving rats during GABAergic pharmacological stimulation to the preoptic area and anterior hypothalamus in several ambient temperatures. Brain Res. 2005;1048(1–2):32–40.
- Hsu I, Yeh CR, Slavin S, et al. Estrogen receptor alpha prevents bladder cancer via INPP4B inhibited akt pathway in vitro and in vivo. Oncotarget. 2014;5(17):7917–7935.
- Taga T, Kishimoto T. Gp130 and the interleukin-6 family of cytokines. Annu Rev Immunol. 1997;15:797–819.
- Ghoreschi K, Laurence A, O’Shea JJ. Janus kinases in immune cell signaling. Immunol Rev. 2009;228(1):273–287.