
 ?Mathematical formulae have been encoded as MathML and are displayed in this HTML version using MathJax in order to improve their display. Uncheck the box to turn MathJax off. This feature requires Javascript. Click on a formula to zoom.
Abstract
Soybean plants have high protein content and can be used as a supplementary source of high-protein feed. To map quantitative trait loci (QTL) for the content of crude protein (CP), neutral detergent fibre (NDF), acid detergent fibre (ADF) and dry weight of plant (DWP) in R2 stage of soybean, two recombinant inbred lines, RIL3613 and RIL6013, containing 134 and 156 RILs, derived from the cross of Dongnong L13 × Heihe 36 and Dongnong L13 × Henong 60, were planted for two consecutive years. Based on a simple sequence repeat (SSR) linkage map, QTLs of CP, NDF, ADF and DWP were mapped by interval mapping (IM) and inclusive composite interval mapping method (ICIM) using additive effect, epistatic effect and environmental interaction model. The variance components of genotype, environment and genotype × environment (G × E) interaction for quality and yield traits in the two RIL populations were significant under multiple environmental conditions. Eighteen additive effect QTLs on 10 of 20 soybean chromosomes explained 7.02%–15.67% and 2.13%–11.42% of the phenotypic variation in RIL3613 and RIL6013, respectively. Three epistatic QTL pairs related to CP and six ones for DWP were identified. Eight additive effect QTLs for CP, eight ones for NDF, three ones for ADF, and another three ones for DWP were identified by genotype × environment interaction analysis. One epistatic QTL for CP, 11 epistatic QTL pairs for ADF and 38 ones for NDF were identified. These results can provide better understanding of the genetic basis of soybean feed quality and yield.
Introduction
Soybean [Glycine max (L.)] is not only an important source of edible protein and oil, but also has rich nutritional value. Like most legumes, soybean feeds tend to be high in protein and low in fibre content, and are considered to have similar nutritional value compared to alfalfa [Citation1]. Soybean as a feed crop has a long history of cultivation. Soybean was introduced to North America in 1765 and was grown primarily as a forage crop for the next 155 years. Starting from the 1920s, soybean has been grown as a seed crop mainly for seed protein and oil. With the growing demand for soybean oil and meal, in 1941, the acreage sown to seed soybeans in the United States exceeded that sown to forage soybeans for the first time [Citation2]. The traditional soybean breeding target is mainly the seed yield and quality, which is reflected in the seed protein and oil content and other quantitative traits [Citation3]. However, the progress made in the last two decades in improving the feed quality and biomass of soybeans indicates a growing interest in breeding forage soybeans [Citation1, Citation4–6].
In the study of biomass per plant, shoot dry weight is one of the acceptable indicators. This method is often used to estimate plant yield, but it is also an accurate measure of plant biomass [Citation7]. With the increasing demand for high quality feed, it is imperative to combine the dry weight of plant (DWP) per plant with crude protein content (CP), neutral degraded fibre content (NDF) and acid degraded fibre content (ADF) as a comprehensive evaluation index to evaluate the genetic variation of soybean feed quality and yield for the improvement of soybean varieties. Significant genetic variation in feed quality traits had been detected in soybean [Citation8–10]. With the objective to improve the feed quality and yield related traits in soybean efficiently, several studies on mapping quantitative trait locus (QTL) for feed quality and yield had been conducted based on a variety of genetic backgrounds, environments and statistical methods. Asekova et al. [Citation1] used a set of 188 recombinant inbred lines (RILs) derived from a cross between wild soybean (PI 483463) and cultivated soybean (Hutcheson) to locate QTL controlling feed quality traits. Six CP QTLs, six NDF QTLs and two ADF QTLs were identified. These QTLs were distributed on 8 out of 20 soybean chromosomes, and some QTLs for CF and ADF on L chromosome were identified stably in multiple environments. The results indicated that the genomic region labelled BARC-029975-06765 may carry a gene that has a significant effect on the expression of feed quality traits. Santos et al. [Citation11] used soybean varieties Bossier (high biological nitrogen fixation capacity) and Embrapa 20 (medium biological nitrogen fixation capacity) to obtain a RIL, and identified 2 DWP QTLs from it, explaining 15.4% of the total variation of DWP [Citation12]. Zhang et al. [Citation13] found eight QTLs controlling DWP using 152 RILs derived from a cross between Nannong94-156 and Bogao. A coincident QTL for SDW flanked by S506-Satt534 on linkage group B2-1 was detected across years at low phosphorus condition, which explained 41.4% of the phenotypic variation in combination. Up to date, 7 CP QTLs, 8 NDF QTLs, 2 ADF QTLs and 47 DWP QTLs have been integrated on the public genetic linkage map (http://www.soybase.org/).
The genetic effects include additive effects, epistasis and interactions of QTLs with the environment. Epistasis effects refer to additive × additive interaction components for RIL population, which may play an important role in the improvement of quantitative traits [Citation14]. Under the assumption that there is no epistasis, QTL mapping genetic models will lead to biased estimation of QTL parameters, therefore, models containing the epistasis are proposed [Citation12]. In quantitative genetics, additive × environment (AE) and epistasis × environment (AAE) are two major genetic components that contribute significantly to phenotypic variation of complex traits [Citation15, Citation16]. With advances in molecular techniques and statistical methods in recent decades, many studies on soybean have identified many pairs of epistatic QTLs [Citation17–23]. However, the studies on mapping QTL for forage quality and yield traits have mainly focused on the additive effect and neglected AA and AAE [Citation1, Citation11, Citation13].
With the objective to provides theoretical basis and to search technical support for forage soybean breeding, mapping QTLs for CP, NDF, ADF and DWP was conducted based on two soybean RIL populations derived from the crosses of Dongnong L13 × Henong 60 and Dongnong L13 × Heihe 36 in this study.
Materials and methods
Plant materials and field design
Two populations, RIL3613 and RIL6013, containing 134 and 156 RIL2:8, respectively, were obtained from crosses Dongnong L13 × Heihe 36 and Dongnong L13 × Henong 60. Field experiments were conducted in two environments (Baojia, 45°29′46. 6″N 126°26′30. 7″E, Shuangcheng District, Harbin, 2017; Animal husbandry science base, 45°30′54. 1″N 127°02′14. 5″E, Acheng District, Harbin, 2018). Both parents and recombinant inbred lines were planted in the field. The field experiment was carried out in a randomized block design and repeated 3 times. Each plot is 5 m long, the row spacing is 0.7 m, and the plant spacing is 0.06 m. The field management was similar as the general field cultivation. Three soybean plants from each plot of each RIL were collected at the R2 growth stage (full-bloom stage) [Citation24] for forage quality and dry weight measurements from individual plants.
Measurement of forage traits
Each harvested plant is placed in a separate paper bag and placed in a 60 °C forced-air oven (YS-120203N, Vision Scientific Co.,106 Ltd) until constant weight. Dried samples were ground with a cyclone mill (Hood Mixer, AC 220 Super grinder) and passed through a 1-mm sieve for traits of forage quality and yield determination. CP was determined by Kjeldahl nitrogen determination method (Kjeltec 8400, FOSS), NDF and ADF were determined by Van Soest method (Fibertec 8000, FOSS).
Statistical analysis
For forage quality and yield traits between parents and inbred lines Microsoft Excel 2016 were used to perform statistical analysis on the mean value, SD, CV and other parameters of parental samples and RILs samples, and Graph Prism 8 was used for plotting. The SAS program (Version 9.3;SAS Institute, 2013) was applied to conduct analysis on of variance and estimate generalized heritability (h2). The model of analysis of variance (ANOVA) included environment, genotype, genotype × environment interaction effect, and the following formula is used to estimate heritability.
For single environments:
For the multi-environment average values:
Where h2 is broad-sense heritabilit, is the variance of genotype,
is the variance of error,
indicates the variance of genotype by environment effect, r is the number of replications and e is the number of environments in the study.
QTL mapping
The SSR linkage map has been constructed in previous studies [Citation25]. The total lengths of the SSR linkage maps for RIL3613 and RIL6013 were 2849.54 cM and 1886.8 cM, respectively, and the mean interval lengths were 21.92 cM and 16.13 cM, respectively. QTL mapping was performed for the average of quality and yield traits of each line in each environment by interval mapping (IM) and inclusive composite interval mapping (ICIM) [Citation26, Citation27]. Using the software QTL IciMapping v4.2, firstly, the ICIM-ADD and ICIM-EPI algorithms in BIP were used to map the additive-effect and epistatic-effect QTLs in single environment and the average of two environments, and then MET model was used to analyze the additive and epistatic effect QTLs in two environments jointly. Recombination frequencies between linked loci were transformed into distances (cM) using Kosambi’s mapping function [Citation28]. The existence of QTL was determined by setting the minimum LOD threshold to 2.5. The naming of QTL follows the QTL nomenclature of McCouch et al. [Citation29].
Results
Phenotypic analysis
CP, NDF, ADF and DWP of soybean were measured in two RIL populations and three parents for two environments. Among RIL3613 and RIL6013 populations, four traits showed significant variation among individuals (), and the values of each trait were distributed normally ( and ). Compared with the phenotype of the parents (), transgressive inheritance existed in this four traits. Furthermore, the skewness and kurtosis values of most of the traits of RIL3613 and RIL6013 were less than 1, indicating that the four traits of RIL3613 and RIL6013 conform to the quantitative genetic model [Citation30]. Therefore, RIL3613 and RIL6013 are suitable for QTLs localization. The variance of genotype, environment and gene–environment interaction of the four traits was significant under two environments (p < 0.0001) (). The generalized heritabilities of soybean forage quality and yield traits under single environment was significantly higher than those under two combined environments. These results indicated that the genetic basis of feed quality and yield traits of soybean were different in various environments and specific QTL would be detected in multiple environments.
Figure 1. Histogram of RIL3613 population forage quality and dry weight of plant in two environments.
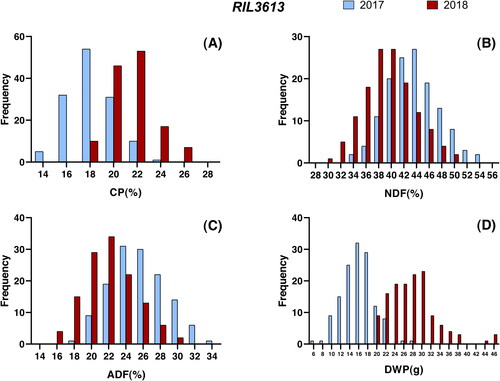
Figure 2. Histogram of RIL6013 population forage quality and dry weight of plant in two environments.
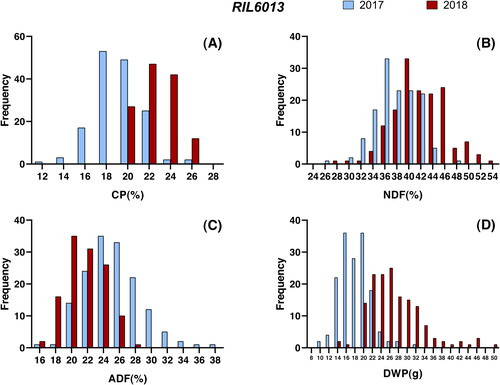
Table 1. Joint analysis of inheritance in multiple and single environments.
Table 2. Evaluation of the forage quality and dry weight of plant of the RIL populations and their parents in different environments.
Additive effect QTLs
Three and eleven QTLs controlling forage quality and yield traits were identified in RIL3613 and RIL6013 populations growing under three environments (2017,2018, AVE), which were located on 10 of 20 soybean chromosomes (A1, A2, B1, D1A, D1b, F, J, K, M, N). In RIL3613 population, three CP additive effect QTLs were identified in three linkage groups (D1A, K and N), with PVE values of 7.02%–15.67% ( and ). The PVE value of qCP-Gm16-2 was greater than 10%. qCP-Gm07-1, qCP-Gm16-2 and qCP-Gm19-3 all had positive additive effects, indicating that the alleles from the female parent Dongnong L13 could increase CP.
Figure 3. Additive and epstatic QTL identified in RIL3613 (above) and RIL6013 (bottom) populations.
Green colour represents protein content QTL; Red colour represents ADF QTL; Mazarine colour represents NDF QTL; Bluish colour represents DWP QTL
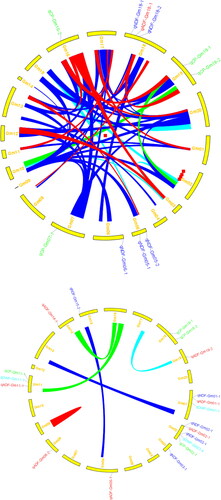
Table 3. Additive QTLs in RIL3613 and RIL6013.
Two CP, five ADF and four NDF additive effect QTLs were identified on eight chromosomes (linkage groups A1, A2, B1, D1b, F, J, M, N) in tRIL6013 population, with the PVE values were 7.61%–10.90%, 2.13%–5.51% and 3.54%–11.42%, respectively (). The PVE values of qCP-Gm02-1 and qNDF-Gm02-1 were both greater than 10%. The 2 QTLs of CP (qCP-Gm02-1 and qCP-Gm18-1) had a positive additive effect, which means that the alleles derived from Dongnong L13 enhanced CP, while the five ADF QTLs (qADF-Gm01-1, qADF-Gm02-1, qADF-Gm08-2, qADF-Gm11-1 and qADF-Gm19-2) and four NDF QTLs (qNDF-Gm01-1, qNDF-Gm02-1, QNDF-Gm03-1 and qNDF-Gm15-2) had a negative additive effect, indicating that the alleles of Henong 60 increase ADF or NDF.
In RIL6013 population, two QTLs with multiple effects simultaneously controlled NDF and ADF, and one QTL with multiple effects simultaneously controlled CP and NDF. Meanwhile, two QTL SSR intervals (sat_096-sat_289, Sat_413-Sat_160) simultaneously controlled NDF and ADF and one QTL SSR interval (satt546-staga002) simultaneously controlled CP and NDF. The additive effect of QTLs controlling CP was positive, while the additive effect of QTLs controlling NDF and ADF were negative, which means that the use of these QTLs may simultaneously increase CP and reduce ADF and NDF.
Epistatic effect QTLs
Nine epistatic effect QTL pairs for either CP or DWP were identified in two RIL populations under two environments ( and ). Among them, one epistatic effect QTL pair for CP showed PVE value of 11.587% in RIL3613 population, and two epistatic effect QTL pairs for CP showed PVE value of 6.921% and 7.286% in RIL6013 population, respectively. qCP-Gm10-1∼qCP-Gm19-2 showed positive epistatic effects, whereas qCP-Gm14-1∼qCP-Gm16-3 and qCP-Gm11-2∼qCP-Gm16-1 showed negative epistatic effects. Similarly, five and one epistatic effect QTL pairs for DWP with PVE values of 1.692%∼3.032% and 3.463% were identified in RIL3613 and RIL6013, respectively. qDWP-Gm05-1∼qDWP-Gm15-1 and qDWP-Gm17-1∼qDWP-Gm19-1 showed a positive epistatic effect, and the remaining 6 pairs showed a negative epistatic effect.
Table 4. Epistatic QTL in RIL3613 and RIL6013.
Additive × environment interaction QTL
The phenotypic data obtained in the two environments were used for QTL mapping of CP, ADF, NDF and DWP based on the multi-environment QTL mapping model, and a total of 22 additive × environment QTLs were detected (). Eight CP QTLs were located on six linkage groups, A2, D1A, F, K, M and N. Three ADF QTLs were mapped and distributed on three linkage groups, C2, I and M. Eight NDF QTLs were located on six linkage groups, A1, A2, B1, C1, C2 and M. Three DWP QTLs were located and distributed on three linkage groups, A1, A2 and F.
Table 5. Additive × environment QTLs in RIL3613 and RIL6013.
The additive effects of qCP-Gm02-1, qCP-Gm07-1, qCP-Gm11-1, qCP-Gm16-2, qCP-Gm18-1, qCP-Gm18-2, qCP-Gm19-1 and qCP-Gm19-2 ranged from 0.229 to 0.912, which suggested the alleles that increased CP were from the female parent Dongnong L13. The additive effect contribution rate for phenotype variation (ACPV) of qCP-Gm16-2 was less than that of the additive-by-environment interaction effect contribution rate for phenotype variation (AECPV), and AECPV of the remaining 7 QTLs were less than ACPV. The additive effects of qADF-Gm06-1 and qADF-Gm18-1 were both positive; that is, the alleles that increase ADF came from the female parent Dongnong L13. The additive effect of qADF-Gm14-1 was negative; that is, the alleles that increased ADF were from the male parent Henong 60, and ACPV of the above three QTLs was greater than AECPV.
The additive effects of qNDF-Gm01-1, qNDF-Gm02-1, qNDF-Gm03-1 and qNDF-Gm05-1 were all negative; that is, the alleles that increased NDF were derived from the male parent Henong 60 and Heihe 36. The additive effects of qNDF-Gm05-2, qNDF-Gm06-1, qNDF-Gm18-1 and qNDF-Gm18-2 were all positive, indicating that the alleles that increased NDF came from the female parent Dongnong L13. ACPV of these QTLs were greater than their AECPV.
The additive effects of qDWP-Gm01-1, qDWP-Gm02-4 and qDWP-Gm11-1 were all negative; that is, the alleles that increased DWP were from the male parent Hinong 60. AECPV was much greater than ACPV.
Epistatistic × environment interaction QTL
In the two RIL populations, 50 epistatic (additive × additive)-by-environment interaction effect (AAE) QTL pairs () were located. Among them, 31 epistatic effects QTL pairs were positive, and 19 epistatic effects showed negative effects.
Table 6. Epistatic × environment QTL in RIL3613 and RIL6013.
One epistatic effect QTL pair for CP was identified, qCP-Gm02-2∼qCP-Gm19-1. The epistatic (additive × additive) contribution rate for phenotype variation (AACPV) was greater than the epistatic × environment interaction contribution rate for phenotype variation (AAECPV), indicating that CP was strongly controlled by the epistatic effects.
A total of 11 epistatic-effect QTL pairs for ADF were identified, and the PVE of AA was 10.213%∼22.3%, while PVE of AAE was between 0.002% and 0.551%. For all of the 11 epistatic effect QTL pairs for ADF, the PVE of epistatic QTLs was greater than that of AAE interaction, indicating that it was strongly controlled by the epistatic effects. Seven pairwise interaction sites (qADF-Gm03-1∼qADF-Gm12-1, qADF-Gm05-1∼qADF-Gm13-1, qADF-Gm13-1∼qADF-Gm16-1, qADF-Gm01-2∼qADF-Gm17-1, qADF-Gm17-2∼qADF-Gm18-2, qADF-Gm08-1∼qADF-Gm18-3 and qADF-Gm18-2∼qADF-Gm19-2) showed positive epistatic effects, while the remaining four pairwise interaction sites showed negative epistatic effects.
Thirty-eight epistatic effect QTL pairs for NDF were identified, and the PVE of AA was 6.514%∼60.095%. The PVE range of AAE is between 0%∼0.287%. For all NDF epistatic-effect QTL pairs, the PVE for the epistatic QTLs was greater than the PVE for the AAE interaction; that is, it was deeply impacted by the epistatic effects. Among them, 15 pairwise interaction sites showed positive epistatic effects, while the remaining 23 pairwise interaction sites showed negative epistatic effects.
Discussion
Associated populations can improve the efficiency of QTL mapping
In previous studies, a recombinant inbred line derived from two parents was often used for QTL mapping. The number of polymorphism markers between parents may be limited, leading to low marker density, fewer detected intervals and low efficiency of QTL detection. To overcome this limitation, plant breeders had adopted a multi-population improvement strategy, which has been used in rice, arabidopsis, maize and soybean [Citation31–36]. In this study, we used two RIL populations with the same female parent (Dongnong L13) to locate QTLs for forage quality and yield traits ( and ). Ten additive effect QTLs were identified in the RIL3613 population, whereas 18 additive effect QTLs were identified in the RIL6013 population, and the intervals of these QTLs were not duplicated, indicating that the genetic mechanisms of CP, ADF, NDF and DWP in the two populations were different, and the detection efficiency could be improved by using two populations.
Multiple QTL statistical methods can improve the detection efficiency
Various QTL mapping methods have been used in research, among which IM and ICIM have been widely used in QTL detection. The main difference between these two statistical methods is the different statistical models used. IM does not control the background error in the analysis of inferred QTL, while ICIM method uses adjacent molecular markers to control the background error. Therefore, the results of QTLS mapping will differ. In this study, two different statistical methods were used to identify QTLs. A total of 100 and 15 QTLs were identified by ICIM and IM, respectively. Among them, 5 QTLs (qCP-Gm19-2, qCP-Gm16-2, qCP-Gm19-1, qNDF-Gm02-1 and qNDF-Gm03-1) were identified by both statistical methods, whereas the other QTLs were identified by a single method. Similarly, Ning et al. (2018) used single marker analysis (SMA), composite interval mapping (CIM) and inclusive composite interval mapping (ICIM) methods to identify QTLs of vertical distribution of pod number, and detected different QTLs with different methods [Citation25]. Therefore, it can be seen that multiple methods can verify the accuracy of QTL detection, and can also increase the detection efficiency of QTLs.
Multi-environment experiment could improve the detection efficiency of QTL for forage quality and yield
The quality of soybean forage is easily affected by environmental conditions[Citation1]. This study found that in addition to forage quality, DWP was also easily affected by environmental conditions (). In order to overcome the influence of the environment on the results of QTL mapping, identify the stable expression of QTLs in different environments, and accurately estimate the location and function of QTLs, it is necessary to conduct analysis in multiple environments over many years. There are two methods to analyze the results of multi-environment experiments. One is to analyze the results of a single environment alone. The other is to combine the data collected from multiple environments [Citation25, Citation37–40]. Compared with the single environmental analysis method, the statistical method combining multiple environments can accurately estimate the error, improve the detection ability of QTLs, and estimate the location and effect of QTLs more accurately [Citation41]. In this study, both single environment (BIP function) and multiple environment (MET function) methods were used to map QTLs for three forage quality traits and one yield trait. Fourteen additive effect QTLs and nine epistatic effect QTL pairs were identified in the single-environment genetic effect model (BIP) and 22 additive effect QTLs and 50 epistatic effect QTL pairs were identified in the multi-environment QTLs × environment model (MET), of which only eight additive effect QTLs were detected by both methods. These results indicate that the combination of the two methods can improve the efficiency of QTL localization.
Quantitative traits are controlled by both genetic factors and environmental influences. The sensitivity of a certain QTL effect to the environment can be evaluated by comparing the phenotypic contribution rate of QTL main effect and the phenotypic contribution rate of genotype × environmental interaction effect. In this study, the additive phenotypic contribution rates of 18 additive effect QTLs were higher than that of additive × environmental interaction effects, and the phenotypic contribution rates of 50 epistatic effect QTL pairs were higher than that of epistatic × environmental interaction effects ( and ). These QTLs showed stability in multiple environments, indicating that their effects could be expressed stably in multiple environments, which is of great significance for breeding with multiple environment stability. On the contrary, the phenotypic contribution rate of additive × environment interaction was higher than that of additive effect in four QTLs, and there were no epistatic QTL pairs in which the phenotypic contribution rate of epistatic × environment interaction was higher than that of epistatic effect in this study. In addition, 11 QTLs were even only identified in a single environment (). The QTLs that are only suitable for a single environment, are environment-specific QTLs, and have practical significance for breeding varieties in specific environments.
The epistasis effect QTL is an important genetic basis for forage quality and yield traits
The epistasis of QTL × QTL and its interaction with the environment play an important role in the genetic research of quantitative traits, and it is an important component of quantitative trait inheritance [Citation42]. It is of great significance to study the epistasis effect of complex quantitative traits for genetic breeding. Asekova et al. [Citation1] only studied the additive effect of QTLs, but did not study the epistatic effect of QTLs. Laurie et al. [Citation43] divided epistatic effect QTL pairs into three types: significantly additive QTL × significantly additive QTL, significantly additive QTL × non-significantly additive QTL, and non-significantly additive QTL × non-significantly additive QTL according to the two QTLs interacting with each other. In this study, we mapped a total of 59 epistatic effect QTL pairs by the epistatic effect model, including 4 CP QTL pairs, 11 ADF QTL pairs, 38 NDF QTL pairs and 6 DWP QTL pairs. A total of 64 QTLs were identified. Among them, 6 QTLs were identified as significant additive QTLs by the additive effect model, whereas the other 58 QTLs were non-significant additive QTLs. Therefore, through epistatic effect analysis, QTL locus that could not be identified by additive effect model could be found, providing genetic basis for further exploration of forage quality and yield traits. Therefore, QTL analysis of additive effect and epistatic effect should be carried out simultaneously when analyzing the genetic basis of forage quality and yield traits, which can improve the efficiency of molecular assisted selection and genetic analysis.
Breeding value of co-localization with QTLs
Some QTLs are localized to the same genomic region, and this pleiotropy is common in most QTLs [Citation44]. Most QTLs are aggregated, which is probably the result of close association of multiple genes. It is an important problem in genetic breeding to analyze whether a single gene affects multiple traits simultaneously. If pleiotropy is caused by the tight linkage of multiple genes, then the beneficial genes can be exploited by breaking the linkage. However, if a single effect controls multiple traits, it may not be possible to break the link between them because it carries some negative effects at the same time, thus limiting its effective use. In this study, some QTLs controlling multiple traits were identified. For example, in the Gm01 linkage group, qADF-Gm01-1, qNDF-Gm01-1 and qDWP-Gm01-1 share a genomic interval (satt482-Sat_160). In the Gm02 linkage group, the gene interval staga002-sat_289 affects CP, ADF, NDF and DWP simultaneously. In the Gm11 linkage group, the gene interval satt197-sat272 affects CP, ADF and DWP simultaneously. In the Gm18 linkage group, qADF-Gm18-1 and qNDF-Gm18-2 overlap in position and coexist in the intergenic region (Satt610-Satt570). The QTLs controlling ADF and NDF in satt482-Sat160, staga002-sat_289 and satt197-sat272 are all negative additive effects, and CP are all positive additive effects. The alleles of the female parent Dongnong L13 promoted simultaneous reduction of ADF and NDF and increased CP. Fibre is an important forage component that affects animal digestibility and energy utilization. An increase in fibre content will reduce the digestibility of the forage, ultimately leading to a decrease in energy content. Fibre content is usually determined by measuring NDF and ADF [Citation45, Citation46]. With the increase of ADF, the digestibility of forage decreased [Citation47]. Cell wall digestibility of grasses and legumes is often limited by the content and composition of lignin components. Since digestibility is negatively correlated with cell wall lignin and fibre content, reducing fibre content can help develop feed crops with higher digestibility [Citation48]. Since the protein content corresponds to the digestible portion of dry matter in hay [Citation49], increasing the crude protein content should improve the digestibility of hay. Therefore, using the gene regions of QTLs above can better achieve the purpose of improving the nutritional quality of forage soybean.
Comparison with previous studies
Comparing the QTLs identified in this study with the results of previous studies, it was found that the genetic regions of qDWP-Gm01-1 and qDWP-Gm02-4 overlap with the genetic interval of QTLs previously discovered by Zhang et al. [Citation50]. The genetic interval of qDWP-Gm11-1 overlaps with the genetic interval of QTLs mapped by Zhang et al. [Citation50] and Liang et al. [Citation20]. The genetic interval of qCP-Gm19-3 overlaps with the QTL previously discovered by Asekova et al. [Citation1]. The comparison with previous studies shows the authenticity of these QTLs. The other QTLs in this study are all reported for the first time and need further study in the future.
Conclusions
Eight CPs, eight ADFs, nine NDF and three DWP additive effect QTLs were identified in two soybean populations. Four epistatic effect QTL pairs for CP, 12 for ADF, 38 for NDF and 8 for DWP were also identified. Four QTLs were consistent with previous studies, and the rest were newly discovered QTLs. These results proved theoretical and practical significance for future maker assisted selection.
Disclosure statement
No potential conflict of interest was reported by the authors.
Data availability
The data that support the findings reported in this study are available from the corresponding author upon reasonable request.
Additional information
Funding
References
- Asekova S, Kulkarni KP, Kim M, et al. Novel quantitative trait loci for forage quality traits in a cross between PI 483463 and ‘Hutcheson’ in Soybean. Crop Sci. 2016;56(5):2600–2611.
- Hymowitz T. Soybeans: The success story. In: Janick J, Simon JE, editors. Advances in new crops. Portland, OR (USA): Timber Press; 1990. p. 159–163.
- Wang XZ, Jiang GL, Green M, et al. QTL analysis of unsaturated fatty acids in a recombinant inbred population of soybean. Mol Breeding. 2014;33(2):281–296.
- Koivisto JM, Devine TE, Lane GPF, et al. Forage soybeans (Glycine max (L.) Merr.) in the United Kingdom: test of new cultivars. Agronomie. 2003;23(4):287–291.
- Asekova S, Kulkarni KP, Patil G, et al. Genetic analysis of shoot fresh weight in a cross of wild (G. soja) and cultivated (G. max) soybean. Mol Breeding. 2016;36(7):103.
- Kulkarni KP, Tayade R, Asekova S, et al. Harnessing the potential of forage legumes, alfalfa, soybean, and cowpea for sustainable agriculture and global food security. Front Plant Sci. 2018;9:1314.
- Golzarian MR, Frick RA, Rajendran K, et al. Accurate inference of shoot biomass from high-throughput images of cereal plants. Plant Methods. 2011;7:2.
- Stombaugh SK, Jung HG, Orf JH, et al. Genotypic and environmental variation in soybean seed cell wall polysaccharides. Crop Sci. 2000;40(2):408–412.
- Stombaugh SK, Orf JH, Jung HG, et al. Relationships between soybean seed cell wall polysaccharides, yield, and seed traits. Crop Sci. 2003;43(2):571.
- Lee EJ, Choi HJ, Shin DH, et al. Evaluation of forage yield and quality for the accessions derived from inter-specific cross between wild and cultivated soybeans. Korean J Breed Sci. 2014;46(1):66–77.
- Santos MA, Geraldi IO, Garcia AA, et al. Mapping of QTLs associated with biological nitrogen fixation traits in soybean. Hereditas. 2013;150(2-3):17–25.
- Jannink JL, Moreau L, Charmet G, et al. Overview of QTL detection in plants and tests for synergistic epistatic interactions. Genetica. 2009;136(2):225–236.
- Zhang D, Cheng H, Geng L, et al. Detection of quantitative trait loci for phosphorus deficiency tolerance at soybean seedling stage. Euphytica. 2009;167(3):313–322.
- Holland JB. Genetic architecture of complex traits in plants. Curr Opin Plant Biol. 2007;10(2):156–161.
- Wang D, Salah El-Basyoni I, Stephen Baenziger P, et al. Prediction of genetic values of quantitative traits with epistatic effects in plant breeding populations. Heredity (Edinb)). 2012;109(5):313–319.
- Cao Y, Li S, Chen G, et al. Deciphering the genetic architecture of plant height in soybean using two RIL populations sharing a common M8206 parent. Plants. 2019;8(10):373.
- Hina A, Cao Y, Song S, et al. High-resolution mapping in two RIL populations refines major "QTL Hotspot" regions for seed size and shape in soybean (Glycine max L.). IJMS. 2020;21(3):1040.
- Wang Y, Han Y, Zhao X, et al. Mapping isoflavone QTL with main, epistatic and QTL × environment effects in recombinant inbred lines of soybean. PLoS One. 2015;10(3):e0118447.
- Jiang H, Li Y, Qin H, et al. Identification of major QTLs associated with first pod height and candidate gene mining in soybean. Front Plant Sci. 2018;9:1280.
- Liang H, Yu Y, Wang S, et al. QTL mapping of isoflavone, oil and protein contents in soybean (Glycine max L. Merr. Agricultural Sci China. 2010;9(8):1108–1116. https://doi.org/10.1016/S1671-2927(09)60197-8
- Pathan SM, Vuong T, Clark K, et al. Genetic mapping and confirmation of quantitative trait loci for seed protein and oil contents and seed weight in soybean. Crop Sci. 2013;53(3):765–774.
- Warrington CV, Abdel-Haleem H, Hyten DL, et al. QTL for seed protein and amino acids in the Benning × Danbaekkong soybean population. Theor Appl Genet. 2015;128(5):839–850.
- Qi Z, Zhang X, Qi H, et al. Identification and validation of major QTLs and epistatic interactions for seed oil content in soybeans under multiple environments based on a high-density map. Euphytica. 2017;213(8):162.
- Fehr WR, Caviness CE, Burmood DT, et al. Stage of development descriptions for soybeans, Glycine max (L) Merrill. Crop Sci. 1971;11(6):929–931.
- Ning H, Yuan J, Dong Q, et al. Identification of QTLs related to the vertical distribution and seed-set of pod number in soybean [Glycine max (L.) Merri]. PLoS One. 2018;13(4):e0195830.
- Lander ES, Botstein D. Mapping mendelian factors underlying quantitative traits using RFLP linkage maps. Genetics. 1989;121(1):185–199.
- Li H, Ye G, Wang J. A modified algorithm for the improvement of composite interval mapping. Genetics. 2007;175(1):361–374.
- Kosambi DD. The estimation of map distances from recombination values. Ann Eugen. 1943;12(1):172–175.
- Mccouch S, Cho Y, Yano M, et al. Report on QTL nomenclature. Rice Genet Newsl. 1997;14:11.
- Hammond K, James JW. Genes of large effect and the shape of the distribution of a quantitative character. Aust J Biol Sci. 1970;23(4):867–876.
- Zeng Y, Shi J, Ji Z, et al. Combination of twelve alleles at six quantitative trait loci determines grain weight in rice. PLoS One. 2017;12(7):e0181588.
- Bloomer RH, Lloyd AM, Symonds VV. The genetic architecture of constitutive and induced trichome density in two new recombinant inbred line populations of Arabidopsis thaliana: phenotypic plasticity, epistasis, and bidirectional leaf damage response. BMC Plant Biol. 2014;14:119.
- Li K, Yan J, Li J, et al. Genetic architecture of rind penetrometer resistance in two maize recombinant inbred line populations. BMC Plant Biol. 2014;14:152.
- Pan Q, Xu Y, Li K, et al. The genetic basis of plant architecture in 10 maize recombinant inbred line populations. Plant Physiol. 2017;175(2):858–873.
- Mao T, Jiang Z, Han Y, et al. Identification of quantitative trait loci underlying seed protein and oil contents of soybean across multi-genetic backgrounds and environments. Plant Breed. 2013;132(6):630–641.
- Kamfwa K, Zhao D, Kelly JD, et al. Transcriptome analysis of two recombinant inbred lines of common bean contrasting for symbiotic nitrogen fixation. PLoS One. 2017;12(2):e0172141.
- Teng W, Han Y, Du Y, et al. QTL analyses of seed weight during the development of soybean (Glycine max L. Merr.). Heredity (Edinb). 2009;102(4):372–380.
- Panthee DR, Pantalone VR, West DR, et al. Quantitative trait loci for seed protein and oil concentration, and seed size in soybean. Crop Sci. 2005;45(5):2015–2022.
- Rossi ME, Orf JH, Liu LJ, et al. Genetic basis of soybean adaptation to North American vs. Asian mega-environments in two independent populations from Canadian × Chinese crosses. Theor Appl Genet. 2013;126(7):1809–1823.
- Wang Y, Dong Q, Fang Y, et al. Identification of quantitative trait loci for seed protein and oil contents in soybean and analysis for epistatic and QTL × environment effects in multiple environments. Intl J Agric Biol. 2020; 24:493–504.
- Jansen RC, Van Ooijen JW, Stam P, et al. Genotype-by-environment interaction in genetic mapping of multiple quantitative trait loci. Theor Appl Genet. 1995;91(1):33–37.
- Specht JE, Chase K, Macrander M, et al. Soybean response to water: a QTL analysis of drought tolerance. Crop Sci. 2001;41(2):493–509.
- Laurie C, Wang S, Carlini-Garcia LA, et al. Mapping epistatic quantitative trait loci. BMC Genet. 2014;15:112.
- Zhang WK, Wang YJ, Luo GZ, et al. QTL mapping of ten agronomic traits on the soybean (Glycine max L. Merr.) genetic map and their association with EST markers. Theor Appl Genet. 2004;108(6):1131–1139.
- Soest PJV. Nutritional ecology of the ruminant. Cornell Univ P. 1994;44(11):2552–2561.
- Falkner LK, Casler MD. Preference for smooth bromegrass clones is affected by divergent selection for nutritive value. Crop Sci. 1998;38(3):690–695.
- Jung HJ. Analysis of forage fiber and cell walls in ruminant nutrition. J Nutr. 1997;127(5 Suppl):810S–813S.
- Xiong Y, Fei SZ, Brummer EC, et al. QTL analyses of fiber components and crude protein in an annual × perennial ryegrass interspecific hybrid population. Mol Breeding. 2006;18(4):327–340.
- Soest PJV. Development of a comprehensive system of feed analyses and its application to forages. J Anim Sci. 1967;26(1):119–120.
- Zhang D, Li H, Wang J, et al. High-density genetic mapping identifies new major loci for tolerance to low-phosphorus stress in soybean. Front Plant Sci. 2016;7:372.