
Abstract
Yeasts Saccharomyces cerevisiae, like other microbes in nature, respond to the unavailability of nutrients with entrance in quiescent/G0 state. These cells exist in non-dividing, latent form by maintaining the cellular metabolism at a low level but still able to sense and adapt to environmental stresses. Their quiescent status characteristics are likely close to those of tissues and organs in mammals and humans. This fact makes them an appropriate model system for investigation of the basic mechanisms underlying the toxicity of different chemical compounds. In this study, the toxic effect of H2O2 and menadione on quiescent S. cerevisiae cells was evaluated through the analysis of RNA polymerases transcription profile and ribosomal RNA content. Distinct RNA polymerases subunits were expressed in G0 yeast cells after short exposure to 0.1 mmol/L menadione and 5 mmol/L hydrogen peroxide. Significant transcription repression of RNA polymerases genes was observed as a response to menadione. Both stress agents induced changes in the 25S and 18S rRNA profile in quiescent and proliferating yeast cells. These results strongly suggest that the toxicological response of eukaryotic cells involves rapid alterations in RNA polymerases gene expression and changes in RNA transcriptome profiles, and depends on the specific mechanism of toxic action.
Introduction
Various toxic compounds are released into the environment with industrial and municipal wastes and pose a serious threat for human health and ecosystems. The cells of living organisms respond to a certain chemical with changes in gene and protein expression or metabolite level [Citation1, Citation2] in order to maintain the cellular redox homeostasis. Reprogramming the expression of many cellular RNAs can occur almost immediately after toxic exposure, of which the mRNA transcriptome profiles have been most widely studied [Citation3]. The global alteration in the gene expression determines a transient arrest of normal cellular processes, a decrease in protein synthesis and up-regulation of the genes encoding stress-response proteins [Citation4]. The assessment of these changes could potentially provide earlier and more sensitive biomarkers of a toxic response to a given harmful agent [Citation1, Citation5].
A lot of toxicological studies have been done with yeasts as a model eukaryotic system [Citation6, Citation7, Citation8, Citation9]. It has been reported previously that a large group of yeast genes (about 900) are involved in the cellular response to exogenous stress factors such as hydrogen peroxide, menadione, diamide, dithiothreitol [Citation10]. The budding yeasts Saccharomyces cerevisiae are used as a valuable tool for screening and prediction of the toxicological outcome of new or still unexplored chemicals and for studying the underlying toxicity patterns [Citation7]. Although many cytotoxic compounds exert their deleterious effect on complex organisms by affecting the physiological mechanisms that do not exist in yeast, the major mechanisms underlying the toxicity, adaptation and resistance to chemicals are phylogenetically conserved within distant organisms [Citation11–14]. This allows the prediction of action of similar compounds in other species, contributing to environmental risk assessment and development of detoxification strategies, while limiting the use of animal models for toxicity testing. Moreover, yeast microorganisms are presently the only biological system offering the possibility to evaluate different cellular targets simultaneously and in vivo [Citation15]. Up to now only actively proliferating cells (logarithmic phase of growth) of S. cerevisiae have been used for investigation of the eukaryotic cell response to chemicals. However, very little is known about the biomarkers of stress and the mechanisms of global toxicological response of quiescent S. cerevisiae cells to potential toxic substances. Such analyses could be a valuable source of information in the case of stress detection and prediction of toxicological response in higher eukaryotes.
The entry of S. cerevisiae cells into G0 phase is associated with a decrease in their metabolic activity, but in order to survive in this state, they must retain their basic transcriptional capacity in order to maintain basic transcript and protein level in the cell. This implies strict control over the synthesis of RNA polymerases (RNAPs) that participate in specific transcriptional mechanisms upon entry into quiescent state. Three major forms of multisubunit DNA-dependent RNA polymerase (RNAPs) are observed in all eukaryotes, which transcribe a different set of genes. RNAP I transcribes a single essential gene to generate the rRNA precursor that is processed into the three largest rRNAs. RNAP II synthesizes pre-mRNAs and a number of small RNAs involved in pre-mRNA splicing and rRNA modification. RNAP III is devoted to the synthesis of tRNAs, 5S rRNA and a few other non-translated RNAs participating in basic cellular functions such as pre-mRNA processing, tRNA maturation, or protein translocation [Citation16]. In actively proliferating cells, for each ORF about 0.01–10 molecules of Pol II are detected [Citation17]. According to Pelechano et al. [Citation18] only 6% of RNA Pol II molecules in S. cerevisiae’s cell perform productive transcription of yeast genes at a given moment. They actually transcribe around 14% of the 5900 ORF-containing S. cerevisiae genes [Citation18]. At the same time more than 120 Pol I molecules can be found at the transcribed region of each active rDNA repeat [Citation19, Citation20].
In quiescent yeast cells RNA pol II is responsible for mRNA transcription during G0, while RNA pol I and RNA pol III maintain an appropriate level of structural RNAs [Citation21]. Previous studies both in yeast and in higher eukaryotes have shown that RNAP III transcription is coordinately regulated with Pol I transcription under many circumstances, e.g. upon nitrogen starvation or in response to a nutritional upshift [Citation16, Citation22–25]. Recently it has been reported the role of RNAP II core subunit Rpb4 in non-stress specific transcription and in the regulation of stress response in yeast [Citation26]. According to the Garido-Godino et al. [Citation27] in yeast mutants in the conserved foot region of Rpb1 subunit of RNA pol II, the environmental stress response (ESR) has been activated under optimal growth condition. The ESR is controlled by a global post-transcriptional regulation mechanism and the RNA Pol II RpB4 subunit has a key modulation and coordination function related to the mRNA stability and transcription [Citation27]. Although these studies provide evidence for the modulation of yeast genome expression in response to environmental insults, little is known about the changes that occur in the genome of the Go S. cerevisiae cells and the expression of protein-coding RNA polymerases genes during stress response to toxic compounds.
In this study, the early changes in the RNA polymerase expression of quiescent yeast cells were characterized and the corresponding toxicological response mechanisms following exposure to menadione and hydrogen peroxide were proposed. The ribosomal RNA integrity and content in the presence of the selected chemicals were also examined.
Materials and methods
Microogranisms and growth conditions
Saccharomyces cerevisiae BY 4741 (MATa; his3Δ1; leu2Δ0; met15Δ0; ura3Δ0) obtained from the EUROSCARF collection was used for total RNA and RNAPs isolation. Yeast cells were grown on a standard YPD medium (2% glucose, 1% yeast extract, 1% bacto-peptone; pH = 6.5) at 30 °C using a reciprocal shaker (204 rpm) for 168 h. Samples were withdrawn at exponential (24 h) and late stationary phase (168 h).
Quiescent cells isolation
The isolation of quiescent cells from stationary phase yeast population (168 h) was performed in Percoll density gradient according to the protocol described by Allen et al. [Citation28].
Menadione and H2O2 treatment
The toxic effect of H2O2 and menadione (2-methyl-l,4-naphthoquinone, synthetic form of vitamin K) at LD50 concentrations on exponentially grown and quiescent S. cerevisiae BY 4741 cultures was studied after exposure of cells to 0.1 mmol/L menadione and 5 mmol/L H2O2, respectively. The cells were incubated with the stress-inducing agent for 60 min at room temperature (RT), and then washed twice with distilled water.
RNA polymerases isolation
The expression profile of RNA polymerases was analyzed in cell-free extracts obtained from treated and untreated (control) G0 cells. The isolated quiescent cells (0.3 g) were resuspended in 0.05 mol/L potassium phosphate buffer (KPB) pH 7.8 and mixed with polyester beads (0.5 mm) (Sigma-Aldrich, Germany) at a ratio of 1:2:1 w/v/w (0.3 g biomass: 0.6 mL KPB: 0.3 g polyester beads). The resuspended biomass was disintegrated by a Bullet Blender® Storm homogenizer at 8000 rpm, three times for 5 min. Cell debris was removed by centrifugation at 2,300 g for 15 min at 4 °C and the resulting supernatant was clarified after centrifugation at 15,500 g for 20 min at 4 °C. The obtained cell-free homogenate was concentrated in centrifuge tubes with a membrane of 10 kDa (11,000 g) for 15 and 30 min at 4 °C. For partial purification of yeast RNA polymerases ultrafiltration using centrifuge membranes of 100 kDa (11,000 g) for 15 and 30 min at 4 °C was carried out (Amicon® Ultra-4 Centrifugal Filter Unit, Regenerated Cellulose, 100,000 MWCO). The obtained fractions were used for electrophoretic analyses.
RNA extraction
The effective isolation of yeast RNA was enhanced by high-rate cell disintegration in the presence of denaturing agent phenol and polyester beads using the method of Collart and Oliviero [Citation29]. Briefly, untreated and treated with menadione and H2O2 proliferating and quiescent cells (0.1 g) were pelleted by centrifugation (2,300 g) in 1.5 mL sterile Eppendorf tubes and pre-frozen at −20 °C. Before disintegration they were thawed on ice and resuspended in 30 µL of RNA buffer (0.5 mol/L NaCl, 200 mmol/L Tris-HCl, 10 mmol/L EDTA, pH 7.5). The polyester beads (0.5 mm) were added to the resuspended biomass in quantity equivalent to 200 μL H2O. Prior to this step, the beads were treated for 1 h in concentrated HNO3, washed with distilled H2O, dried at 150-200ºC and then cooled at −20 °C. To each of the tubes, 300 μL of phenol saturated with RNA buffer (pH 7.5) was sterilely added. The tubes were vortexed twice at RT for 1 min at full speed (860 g) in a vortex and in the pause between the two vortexes, the samples were cooled on ice. The tubes were centrifuged at 15,500 g for 5 min. The upper layer was recovered and transferred to a new tube. To the samples, another 200-250 μL of phenol-RNA buffer was added, mixed by vortexing for 10 s and centrifuged at 2,750 g for 2 min. The aqueous upper phase containing RNA was recovered and transferred to a new tube. To this, 600 µL ice-cold ethanol (100%) was added, mixed and incubated at −20 °C for 30 min. The tubes were then centrifuged at 15, 500 g for 2 min at 4 °C. The RNA pellet was washed with ice-cold 70% ethanol and centrifuged at 15,500 g for 1 min at 4 °C. The pellet was then dried at RT for 20 min and dissolved in 50 µL distilled H2O.
Native gel electrophoresis
All fractions obtained were analyzed by 8% polyacrylamide gel electrophoresis (PAGE) under native conditions. The procedure, as described by Schägger and Jagow [Citation30], was used to characterize different forms of yeast RNA polymerases. Separation was performed at 4 °C temperature. Finally, the gels were fixed and stained with Serva blue G. The high molecular weight protein Ferritin (450 kDa) was used as a standard.
Sodium dodecyl sulfate gel electrophoresis
SDS PAGE was performed in 10% resolving gel as described by Laemmli [Citation31] and the protein bands were visualized by Coomassie blue R-250. A wide molecular weight protein standard (Serva Unstained SDS PAGE) including seven proteins (Myosin (200 kDa), β-Galactosidase (116 kDa), Albuminbovine (BSA, 67 kDa), Ovalbumin (45 kDa), Carbonic anhydrase (29 kDa), Trypsin inhibitor, soybean (21 kDa), Lysozyme (14.4 kDa), Aprotinin (6.5 kDa) was used as molecular mass marker.
Agarose gel electrophoresis
The isolated RNA from non-exposed (control) and exposed to harmful agents proliferating and G0 cells was visually assessed using standard TBE-based 1% agarose gel. In order to protect RNA from degradation of RNase A, 0.5% of commercial bleach was added to the agarose gel mix according to the procedure described by Aranda et al. [Citation32]. The gel was placed in a mini-gel electrophoresis unit (Hoefer HE 33) and submerged completely with 1 × TBE buffer. The samples consisting of 1× RNA Loading buffer (47.5% formamide, 0.01% bromophenol blue, 0.005% xylene cyanol, 30% glycerol) and approximately 0.3 µg of total RNA were run for ∼35 min with constant voltage (90 V). The gel was stained in ethidium bromide and was analyzed under UV transillumination.
Spectrophotometric measurement of isolated RNA
The concentration and purity of the total RNA isolated from S. cerevisiae BY 4741 treated and untreated cells was assessed by UV spectroscopy according to the method of Wilfinger et al [Citation33].
Results and discussion
Role of RNA polymerases in oxidative stress response
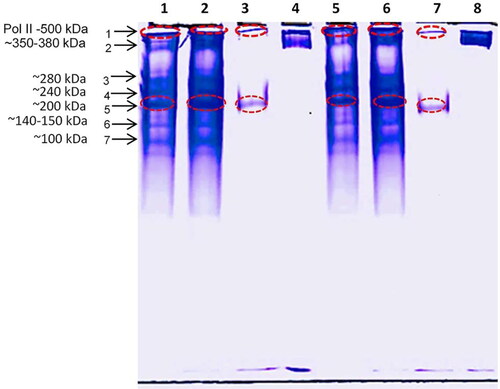
It was previously known that during entrance in quiescence the levels of transcription were significantly decreased. Several phenomena distinguish proliferating and G0 cells such as decreased levels of histone acetylation and specific gene association profiles of RNAP II [Citation34]. However, quiescent cells were also characterized with high levels of RNA polymerase II (RNAP II), but with low levels of the initiating and elongating forms of RNAP II [Citation35]. In order to assess the genome changes initiated in yeasts in response to toxic chemicals (menadione and hydrogen peroxide), the RNA polymerases expression profiles from untreated and treated S. cerevisiae BY 4741 cells were investigated by simultaneous native electrophoresis. The DNA-dependent RNA polymerases I, II and III are high molecular weight oligomer proteins with complex quaternary structure [Citation21, Citation36–38]. Thus, in order to obtain concentrated and partially purified RNAPs, the three crude extracts (untreated quiescent yeast cells; and quiescent yeast cells treated with either 5 mmol/L H2O2 or with 0.1 mmol/L menadione) were subjected to ultrafiltration using 10 and 100 kDa membranes in series for 15 and 30 min centrifugation (11,000 g). The fractions obtained after the use of 100 kDa membrane for 15 and 30 min centrifugation were analyzed by PAGE under non-denaturing conditions (). The results presented in clearly show the same profile of the proteins with molecular weight above 100 kDa between the fractions obtained after 15 min and 30 min centrifugation. However, significant differences in the response of G0S. cerevisiae BY4741 cells to menadione and H2O2 was observed in terms of RNA polymerases expression regulation. Previously it has been shown that in Saccharomyces cerevisiae various oxidative agents could disrupt the intracellular pro-oxidant balance and affect differentially the genome expression level [Citation39]. In the performed study the two toxic compounds were chosen based on the specific mode of cytotoxic actions. H2O2 increases the intracellular peroxide (O22-) levels, which leads to direct oxidation of the sulfur-containing amino acids and generation of OH• radicals, while menadione generates superoxide anions (O2•-) in a redox cycle, which destroys 4Fe-4S proteins producing of OH• [Citation40]. Menadione may also affect the glutathione level directly via a detoxification reaction catalyzed by glutatione-S transferase [Citation41]. For both compounds, previously determined LD50 concentrations were applied. The results obtained showed that in all three fractions, a band corresponding to approximately 500 kDa was detected, which according to the previous studies is consistent with the molecular weight of S. cerevisiae RNAPII [Citation36]. The involvement of the three RNA polymerases in the specific gene transcription depends on the growth phase. During diauxic shift and especially stationary phase a massive reprogramming of gene expression occurs with a downregulation of most genes transcribed by all three RNA polymerases. One of the main characteristics of quiescent yeast cells is the reduced level of mRNA and rRNA (up to about 30% and 20%, respectively), but still presence of a wide variety of transcripts and proteins [Citation21, Citation42]. Binding of RNA polymerase I to rDNA has been found to decrease over time in the G0 phase, reaching 10% that in cells transiting to the G0 phase. Conversely, the proportion of H3K9-methylated silent rDNA repeats is increasing [Citation21]. RNA polymerase II is present in G0 cells but loading upstream of several hundred genes, poised for transcriptional induction that is required for exit from the stationary phase when nutrients become available [Citation43]. The presence of RNA pol II containing Rpb4 subunit increases substantially as cells enter stationary phase [Citation44]. Cells in G0 phase have significantly reduced expression of RNA pol I and RNA pol III and increased RNA pol II expression [Citation42]. All this confirms that the band at ∼500 kDa detected in the three fractions is that of RNA pol II (Figure1 lane 1, band 1). Among the isolated RNA polymerases from S. cerevisiae BY4741 cells in Go phase, in addition to the band at ∼500 kDa, another band corresponding to 350 kDa (Figure1 lane 1, band 2) was observed. It was well represented in two of the extracts: extract 1 (untreated G0 cells) and extract 2 (G0 cells after H2O2 treatment). This band was not detected in the extract of G0 cells treated with menadione. Obviously, when cells are exposed to this stress agent, they lose their ability to synthesize all RNA pol II subunits. The RNA polymerase profile of untreated G0 cells (, lanes 1 and 5) showed three more dominant bands corresponding to molecular weight of ∼200 kDa, ∼240 kDa and ∼280 kDa, with two more bands with less expression observed corresponding to ∼150 kDa and ∼90-100 kDa. In hydrogen peroxide-treated G0 cells (, lanes 2 and 6), the same bands were dominant, but a change in the expression level of the proteins was observed: the highest expression was reported for a protein with a molecular weight of about 200 kDa. It was more highly expressed in peroxide treated cells in comparison to the untreated cells. The expression of proteins with molecular weights of ∼240 kDa and ∼280 kDa was equal to that observed in untreated G0 cells. The most significant changes in RNA polymerase expression were observed at lanes 3 and 7. Only a single band corresponding to ∼200 kDa was observed after 30 min exposure of G0S. cerevisiae BY4741 cells to menadione (, lane 7). It is known that at low concentrations this oxidizing agent (2 µmol/L) induces formation of oxidants in the cell, which trigger redox-dependent gene expression [Citation45]. However, applying LD50 concentration (100 µmol/L) obviously leads to stronger oxidative stress, which represses the RNA polymerase gene expression. This is probably due to the unbalanced accumulation of superoxide radicals that trigger a cascade of mechanisms leading to cell death. Since RNAPII transcribes all protein-coding genes in the cells, the reduced number of expressed RNA polymerase II subunits as a response to menadione suggests the negative effect of this agent on the transcription and gene expression in quiescent cells. In S. cerevisiae, RNAPII exists in a 10-subunit core and a dissociable subcomplex formed by Rpb4 and Rpb7 [Citation46]. The two largest subunits are Rpb1 (∼200 kDa) and Rpb2 (∼150 kDa) [Citation47] observing deviations from these values depending on the type of eukaryotes. The detected expression at ∼200 kDa is probably due to the first major RNA polymerase II subunit RPB1 of S. cerevisiae BY4741. The major catalytic component of RNA polymerase II is the RPB1, which is responsible for the synthesizes mRNA precursors and various functional non-coding RNAs. It forms the active center of the RNA II polymerase together with the second largest subunit RPB2 (∼140-150 kDa) (www.uniprot.org). RPB2 subunit takes part in the synthesis of mRNA precursors and highly functional non-coding RNAs. RPB2contributes to the catalytic activity of the RNA polymerase II. The two subunits form a polymerase complex, which has a molecular weight of about 350 kDa. The observed band of about 350 kDa in the control (untreated G0 cell free extract) and treated with hydrogen peroxide cells, probably corresponds to this enzyme complex formed by the two RNA pol II subunits. Comparing the alterations in the synthesis of RNA polymerases elicited by the two toxic agents reveal that the enzyme expression changes are specific to each of the tested compounds. When cells are shifted from optimal growth conditions to conditions thought to be stressful for the cell, they respond with changes in gene expression that are proportional to the magnitude of environmental change [Citation48]. The high degree of repression of RNA polymerases synthesis observed after exposure to menadione in comparison to that in untreated cells and treated with H2O2 indicate that G0S. cerevisiae BY4741 cells are more sensitive to this oxidizing agent than to hydrogen peroxide.
Figure 1. Native 8% PAGE. Samples: Lane: 1. untreated G0 cell-free extract >100 kDa (15 min centrifugation); 2. G0+H2O2 cell-free extract >100 kDa (15 min centrifugation); 3. G0 + Menadione cell free extract > 100 kDa (15 min centrifugation); 4. Standard Ferritin 450 kDa; 5. untreated G0 cell-free extract > 100 kDa (30 min centrifugation); 6. G0+H2O2 cell-free extract >100 kDa (30 min centrifugation);7. G0 + Menadione cell-free extract >100 kDa (30 min centrifugation); 8. Standard Ferritin 450 kDa.
RNA polymerase extract profile comparison in control (untreated G0 cell-free extract) and treated quiescent S. cerevisiae cells
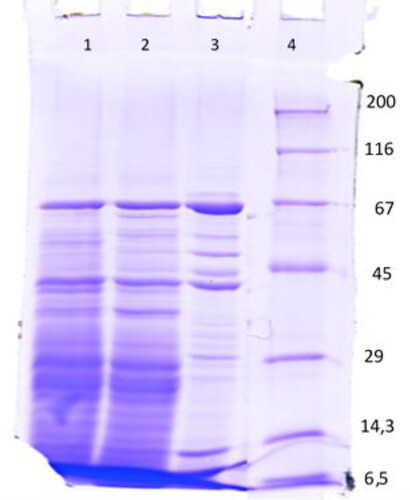
To better characterize the RNA polymerase extract profile in untreated and treated G0S. cerevisiae BY4741 cells, the fractions obtained after 100 kDa membrane were run in a 10% SDS-polyacrylamide gel (). Upon staining with Coomassie brilliant blue, two distinct proteins with a molecular weight of ∼66 kDa and 42-44 kDa were visible with high expression in the three studied fractions, and these proteins were best represented in the extract obtained after treatment of G0 cells with menadione. Menadione at concentration of 0.1 mmol/L induced the expression of another three proteins with molecular weight ∼45 kDa, ∼50 kDa and ∼55 kDa. Significant differences were observed in the extracts 1 and 2, in which the expressed proteins in the range between 45 and 66 kDa exhibited multiple bands but were less pronounced than the proteins in extract 3. In response to stress caused by 5 mmol/L H2O2, a ∼35-40 kDa protein (lane 2) was highly expressed, while the same band was less pronounced in the untreated G0 cells and completely absent in the G0 cells treated with menadione. Proteins with significant expression were observed at ∼28 kDa and ∼25 kDa in extracts 1 and 2 (lanes 1, 2), whereas in G0 cells treated with menadione (lane 3), an expressed protein was detected at ∼29 kDa. A low-molecular-weight protein (12-13 kDa) was expressed in higher level in quiescent cells exposed to menadione and was significantly lower in untreated and hydrogen peroxide treated G0 cells. Many protein bands in the range of 6.5-25 kDa were presented in the untreated cells and the cells treated with H2O2 (lanes 1 and 2, ). The expression of these proteins was not induced in the quiescent cells treated with menadione (lane 3). The protein of mass ∼7 kDa was best represented in the extracts 1 and 2 (lanes 1 and 2, ).
Figure 2. Denaturating 10% SDS–PAGE. Samples: Lane: 1. untreated G0 cell-free extract over 100 kDa; 2. G0+H2O2 cell-free extract over 100 kDa; 3. G0+Menadione cell-free extract over 100 kDa; 4. Protein marker.
Next, based on UniProt database search (https://www.uniprot.org/) a speculation was made about the identity of the detected proteins in the three studied fractions (untreated quiescent cells and quiescent cells subjected to 5 mmol/L H2O2 and 0.1 mmol/L menadione) (). As seen from the UniProt database prediction, most of these proteins had a key role in both survival in quiescent state and stress response adaptation. It was known that yeast cells possess distinctive proteome plasticity and correspondingly they adapt to each specific toxic environment with a unique ‘fingerprint’ of changes [Citation49]. Although hydrogen peroxide affected the RNA polymerases levels, essential difference in both profiles of untreated G0 cells and those subjected to H2O2 was not observed. Contrary, a clear negative effect of menadione on RNAP enzymes expression was detected, suggesting hypersensitivity and lower adaptability of quiescent cells to this toxic compound.
Table 1. UniProt prediction of RNA polymerases extracts profiles.
Ribosomal RNA profiling in S. cerevisiae cells exposed to menadione and hydrogen peroxide
Most responses to environmental stress factors are accompanied by changes in the total RNA level. The above presented results indicated that the toxicological response of quiescent S. cerevisiae BY4741 cells to hydrogen peroxide and menadione involve changes in the transcription of RNA polymerases and stress-response genes. Furthermore, the ribosomal RNA profile in G0 and actively proliferating yeast cells exposed to the selected toxic agents was also examined. The quantity and integrity of the isolated RNA was checked by denaturing agarose gel electrophoresis and spectrophotometric measurements. A significant difference in RNA quantity and electrophoretic profile was observed before and after treatment of both metabolic active and quiescent S. cerevisiae BY4741 cells (). The RNA patterns were similar in the non-exposed quiescent and proliferating cells (). Two major bands corresponding to high-molecular weight 25S and 18S rRNA were detected, but the quantity of RNA in G0 cells (27.2 µg/mL) was 1.4 times less than in actively dividing cells (39.2 µg/mL) (). These data are in accordance with results from other studies [Citation50], which reported reduced transcription rate in G0 cells. The H2O2 and menadione toxicity resulted in apparent changes in rRNA profile in both yeast cultures. Short time (1 h) exposure of yeast cells to 0.1 mmol/L superoxide-generating menadione led to significant reduction in the 25S and 18S rRNA level (). It was previously shown that in exponentially grown S. cerevisiae cells exposed to toxic substances (hydrogen peroxide, acetic acid, etc.), the two RNAs building the large ribosomal subunit, 25S and 5.8S, became extensively degraded [Citation3]. Our results revealed that treatment of proliferating cells with 5 mmol/L H2O2 leads to considerable reduction in the level of 25S rRNA and no changes in 18S rRNA (Figure3). A different RNA profile was observed for quiescent yeast cells, in which the early response to 5 mM H2O2 was accompanied by a decrease in the level of 18S rRNA, but no visible changes were observed in the 25S rRNA profile. According to Mroczek et al. [Citation3], the decrease in the rRNA level after exposure of yeast cells to oxidative agents is a result of endonucleolytic degradation of the ribonucleic acids which correspond to the elevated ROS in the cell. Shedlovskiy et al. [Citation51] reported that the early stages of oxidative stress response in budding yeast S. cerevisiae involve cleavage in the ES7 region of 25S rRNA in the large (60S) ribosomal subunit. In our case the oxidizing agent menadione apparently provokes more severe oxidative stress in both quiescent and metabolically active S. cerevisiae BY4741 cells than hydrogen peroxide, since in both yeast cells significant reduction in ribosome RNA level was observed after treatment. This result correlates with the above presented experiments for the suppressed synthesis of the enzyme RNA polymerase in the presence of menadione.
Figure 3. Total RNA isolated from untreated and treated G0 (168 h) and proliferating (24 h) S. cerevisiae BY4741 cells. Approximately 0.3 µg of total RNA was loaded in each well. Samples: Lane 1: untreated G0 cells; 2: G0 cells + H2O2; 3. G0 cells + menadione; 4. unloaded well; 5. untreated Log cells; 6. Log cells + H2O2; 7. Log cells + menadione.
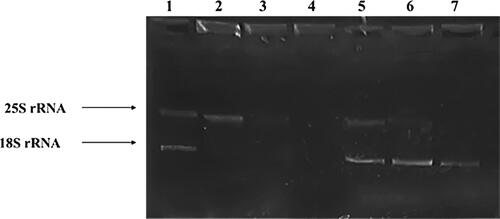
Table 2. Spectrophotometric analysis of RNA in quiescent (G0) and proliferating (Log) S. cerevisiae BY4741 cells.
Conclusions
The obtained results complement the existing studies in which yeast S. cerevisiae are explored as a biological model of higher eukaryotic cells for assessment of pollutant toxicity at different omics levels. However, the knowledge on toxicological studies with yeast cells in quiescent state is still scarce. They interact and function as mammalian and human cells of tissues and organs, and thus represent a suitable platform for studying cellular response mechanisms in the presence of toxic compounds and predicting their effect in humans. The transcriptional changes occurring during the transition from proliferating to quiescent state are mainly associated with alteration in the distribution and levels of RNAP II. Contrary, a change in the expression pattern of RNA polymerases of quiescent cells was observed during exposure to LD50 concentrations of different toxic compounds (menadione and hydrogen peroxide). Moreover, short duration of exposure to menadione triggered stronger toxicological stress, which was evident from the reduced number of expression form/subunit of RNA polymerase in comparison to the untreated cells. The severe toxicity of this chemical was confirmed also by rapid alterations in ribosomal RNA content and profile.
Authors contribution
VP, AK and PD conceived the idea and supervised the study. AD, LV performed, analyzed and interpreted the data regarding RNA polymerases expression profile. AT conducted the experiments and analyzed the data regarding ribosomal RNA profiling. VP, AD and AT wrote the manuscript. VP, PD and AK reviewed and approved the final manuscript.
Acknowledgements
The authors are grateful to the Bulgarian National Science Fund for the financial support of this work/Grant Agreement № Project ДН11/10 – 15.12.2017
Disclosure statement
All authors declare no conflict of interests.
Data availability statement
All data that support the findings reported in this study are available from the corresponding author upon reasonable request.
Additional information
Funding
References
- Hamadeh H, Amin R, Paules R, et al. An over view of toxicogenomics. Curr Issues Mol Biol. 2002;4:45–56.,
- North M, Vulpe C. Functional toxicogenomics: mechanism-centered toxicology. IJMS. 2010;11(12):4796–4813.
- Mroczek S, Kufel J. Apoptotic signals induce specific degradation of ribosomal RNA in yeast. Nucleic Acids Res. 2008;36(9):2874–2888.
- Rodrigues-Pousada C, Devaux F, Caetano S, et al. Yeast AP-1 like transcription factors (Yap) and stress response: a current overview. Microb Cell. 2019;6(6):267–285.,
- Simmons P, Portier C. Toxicogenomics: the new frontier in risk analysis. Carcinogenesis. 2002;23(6):903–905.
- Kim T, Liu C, Yassour M, et al. RNA polymerase mapping during stress responses reveals widespread nonproductive transcription in yeast. Genome Biol. 2010;11(7):R75.,
- Dos Santos S, Teixeira M, Cabrito T, et al. Yeast toxicogenomics: genome-wide responses to chemical stresses with impact in environmental health, pharmacology, and biotechnology. Front Genet. 2012;3:63.
- Braconi D, Bernardini G, Santucci A. Saccharomyces cerevisiae as a model in ecotoxicological studies: a post-genomics perspective. J Proteomics. 2016;137:19–34.
- Suarez-Diez M, Porras S, Laguna-Teno F, et al. Toxicological response of the model fungus Saccharomyces cerevisiae to different concentrations of commercial graphene nanoplatelets. Sci Rep. 2020;10(1):3232.,
- Gasch A, Spellman P, Kao C, et al. Genomic expression programs in the response of yeast cells to environmental changes. Mol Biol Cell. 2000;11(12):4241–4257.
- Foury F. Human genetic diseases: a cross-talk between man and yeast. Gene. 1997;195(1):1–10.
- Hohmann S, Mager W. Stress response mechanisms in the yeast Saccharomyces cerevisiae. In: Hohmann S, Mager W , editors. Yeast Stress Responses. Austin (TX): Molecular Biology Intelligence Unit, R.G. Landes Company; 1997. p. 1–5.
- Parsons L, Bonander N, Eisenstein E, et al. Solution structure and functional ligand screening of HI0719, a highly conserved protein from bacteria to humans in the YjgF/YER057c/UK114 family. Biochemistry. 2003;42(1):80–89.,
- Mager W, Winderickx J. Yeast as a model for medical and medicinal research. Trends Pharmacol Sci. 2005;26(5):265–273.
- Smith A, Ammar R, Nislow C, et al. A survey of yeast genomic assays for drug and target discovery. Pharmacol Ther. 2010;127(2):156–164.,
- Conesa C, Ruotolo R, Soularue P, et al. Modulation of yeast genome expression in response to defective RNA polymerase III-dependent transcription. Mol Cell Biol. 2005;25(19):8631–8642.,
- Bon M, McGowan SJ, Cook PR. Many expressed genes in bacteria and yeast are transcribed only once per cell cycle. Faseb J. 2006;20(10):1721–1723.
- Pelechano V, Chávez S, Pérez-Ortín JE. A complete set of nascent transcription rates for yeast genes. PLoS One. 2010;5(11):e15442.
- Osheim YN, French SL, Sikes ML, et al. Electron microscope visualization of RNA transcription and processing in Saccharomyces cerevisiae by Miller chromatin spreading. Methods Mol Biol. 2009;464:55–69.,
- Albert B, Léger-Silvestre I, Normand C, et al. RNA polymerase I-specific subunits promote polymerase clustering to enhance the rRNA gene transcription cycle. J Cell Biol. 2011;192(2):277–293.
- Roche B, Arcangioli B, Martienssen R. Transcriptional reprogramming in cellular quiescence. RNA Biol. 2017;14(7):843–853.
- Briand J, Navarro F, Gadal O, et al. Cross talk between tRNA and rRNA synthesis in Saccharomyces cerevisiae. Mol Cell Biol. 2001;21(1):189–195.,
- Clarke E, Peterson C, Brainard A, et al. Regulation of the RNA polymerase I and III transcription systems in response to growth conditions. J Biol Chem. 1996;271(36):22189–22195.
- Warner J. The economics of ribosome biosynthesis in yeast. Trends Biochem Sci. 1999;24(11):437–440.
- Zaragoza D, Ghavidel A, Heitman J, et al. Rapamycin induces the G0 program of transcriptional repression in yeast by interfering with the TOR signaling pathway. Mol Cell Biol. 1998;18(8):4463–4470.,
- Pillai B, Verma J, Abraham A, et al. Whole genome expression profiles of yeast RNA polymerase II core subunit, Rpb4, in stress and nonstress conditions. J Biol Chem. 2003;278(5):3339–3346.
- Garrido-Godino AI, Garcıa-Lopez MC, Garcıa-Martınez J, et al. Rpb1 foot mutations demonstrate a major role of Rpb4 in mRNA stability during stress situations in yeast. BBA - Gene Regulatory Mechanisms. 2016; 1859(5):731–743
- Allen C, Büttner S, Aragon A, et al. Isolation of quiescent and nonquiescent cells from yeast stationary-phase cultures. J Cell Biol. 2006;174(1):89–100.
- Collart M, Oliviero S. Preparation of yeast RNA. In: Current protocols in molecular biology. New York: John Wiley & Sons, Inc; 1993. p. 13.12.1–13.12.5.
- Schägger H, von Jagow G. Blue native electrophoresis for isolation of membrane protein complexes in enzymatically active form. Anal Biochem. 1991;199(2):223–231.
- Laemmli UK. Cleavage of structural proteins during the assembly of the head of bacteriophage T4. Nature. 1970;227(5259):680–685.
- Aranda P, La Joie D, Jorcyk C. Bleach Gel: A Simple Agarose Gel for Analyzing RNA Quality. Electrophoresis. 2012;33(2):366–369.
- Wilfinger W, Mackey K, Chomczynski P. Effect of pH and ionic strength on the spectrophotometric assessment of nucleic acid purity. Biotechniques. 1997;22(3):474–481.
- Young CP, Hillyer C, Hokamp K, et al. Distinct histone methylation and transcription profiles are established during the development of cellular quiescence in yeast. BMC Genomics. 2017;18(1):107.
- Aragon AD, Quinones GA, Thomas EV, et al. Release of extraction-resistant mRNA in stationary phase Saccharomyces cerevisiae produces a massive increase in transcript abundance in response to stress. Genome Biol. 2006;7(2):R9.,
- Carter R, Drouin G. Structural differentiation of the three eukaryotic RNA polymerases. Genomics. 2009;94(6):388–396.
- Cramer P. Multisubunit RNA polymerases. Curr Opin Struct Biol. 2002;12(1):89–97.
- Best A, Morrison H, McArthur A, et al. Evolution of eukaryotic transcription: insights from the genome of Giardia lamblia. Genome Res. 2004;14(8):1537–1547.
- Pócsi I, Miskei M, Karányi Z, et al. Comparison of gene expression signatures of diamide, H2O2 and menadione exposed Aspergillus nidulans cultures-linking genome-wide transcriptional changes to cellular physiology . BMC Genomics. 2005;6:182.
- Toledano M, Delaunay A, Biteau B, et al. Oxidative stress responses in yeast. In: Hohman S, Mager W, editors. Yeast Stress Responses. Berlin: Springer-Verlag; 2003. p. 305–387.
- Pócsi I, Prade R, Penninckx M. Glutathione, altruistic metabolite in fungi. Adv Microb Physiol. 2004;49:1–76.
- Roche B, Arcangioli B, Martienssen R. RNA interference is essential for cellular quiescence. Science. 2016;354(6313):aah5651.
- Galdieri L, Mehrotra S, Yu S, et al. Transcriptional regulation in yeast during diauxic shift and stationary phase. OMICS. 2010;14(6):629–638.,
- Choder M, Young R. A Portion of RNA Polymerase II molecules has a component essential for stress responses and stress survival. Mol Cell Biol. 1993;13(11):6984–6991.
- Chuang Y, Chen Y, Chandramouli V, et al. Gene expression after treatment with hydrogen peroxide, menadione, or t-butyl hydroperoxide in breast cancer cells. Cancer Res. 2002;62(21):6246–6254.,
- Allepuz-Fuster P, O’Brien M, González-Polo N, et al. RNA polymerase II plays an active role in the formation of gene loops through the Rpb4 subunit. Nucleic Acids Res. 2019;47(17):8975–8987.,
- Hampsey M. Molecular genetics of the RNA polymerase II general transcriptional machinery. Microbiol Mol Biol Rev. 1998;62(2):465–503.
- Gasch A, Werner-Washburne M. The genomics of yeast responses to environmental stress and starvation. Funct Integr Genomics. 2002;2(4-5):181–192.
- Breker M, Gymrek M, Schuldiner M. A novel single-cell screening platform reveals proteome plasticity during yeast stress responses. J Cell Biol. 2013;200(6):839–850.
- Choder M. A general topoisomerase I-dependent transcriptional repression in the stationary phase in yeast. Genes Dev. 1991;5(12A):2315–2326.
- Shedlovskiy D, Zinskie J, Gardner E, et al. Endonucleolytic cleavage in the expansion segment 7 of 25S rRNA is an early marker of low-level oxidative stress in yeast. J Biol Chem. 2017;292(45):18469–18485.