
Abstract
Pepper (Capsicum annuum L.) is one of the most important vegetable crops worldwide. The Balkans, including Bulgaria, are considered as the secondary centre of pepper diversity especially for C. annuum, where local forms with diverse phenotypes and qualities have formed due to the specific agro-climatic conditions and breeding traditions. Evaluation of the genetic diversity and structure of a pepper collection is an important tool for further development of new varieties and the maintenance of sustainable agriculture. In this study, a set of 179 C. annuum accessions collected from different locations in the Balkan Peninsula was genotyped with 21 simple sequence repeat (SSR; microsatellite) markers. In total, 146 alleles were amplified among which the majority were with low frequencies (<5%). The mean He, Ho and PIC for the 21 SSR loci in the whole set were 0.531, 0.249 and 0.483, respectively. Model-based structure analysis divided the collection into 3 main clusters (K = 3) that grouped accessions with distinct fruit traits like shape, size, pungency. Further genetic structure analysis at increasing Ks suggested the presence of sub-clustering within the three main clusters. A Balkan C. annuum mini core collection was constructed based on the allelic diversity and the inferred genetic structure. As far as the mini core collection captured substantial part of the allele richness, genetic and phenotypic diversity of the analysed 176 non-redundant accessions, while maintaining good representativeness, we believe it will be of high interest to pepper breeders and germplasm conservation specialists.
Supplemental data for this article is available online at https://doi.org/10.1080/13102818.2021.1946428 .
Introduction
Pepper (Capsicum spp.) is one of the most broadly cultivated and consumed vegetables worldwide with harvested area and production in the last five years reaching 3.7 million ha and over 40 million tonnes, respectively (www.fao.org). Its production continues to progressively grow because of the high nutritional value of pepper fruits. Pepper fruits have various applications in the human diet like fresh and processed vegetables, flavourings in food products, spice, but also in pharmaceutics, cosmetics and even as an ornamental plant [Citation1,Citation2]. The high content of bioactive compounds, such as capsaicinoids, carotenoids (capsanthin, capsorubin, β-carotene, β-cryptoxanthin, lutein, zeaxanthin, etc.), vitamins (C, E and provitamin A), dietary fibres and some essential mineral oils have made this vegetable crop an excellent source for protection against various chronic degenerative diseases and human health protection [Citation3,Citation4].
Capsicum genus is comprised of as many as 36 species [Citation5] of which five (C. annuum L., C. frutescens L., C. chinense Jacq., C. baccatum L. and C. pubescens Ruiz et Pav) are cultivated ones [Citation6,Citation7]. Among the domesticated Capsicum species, pungent (chilli or hot pepper) and non-pungent (sweet pepper) forms of Capsicum annuum L. are most popular and have a worldwide commercial distribution [Citation8]. Because Capsicum is of economic and nutritional importance, breeders have improved some agronomic traits, such as pungency, fruit shape, abiotic and biotic stress resistance. However, this leads to reduced genetic diversity of breeding lines, so some useful genes in the landraces (local forms) are lost due to the breeding activities [Citation3]. Conservation and sustainable utilization of genetic resources are keys to the continuous improvement of peppers in order to respond to climate change and increasing global food demand in the successive decades. Conservation of genetic diversity is an essential prerequisite to enhance plant breeding programmes and develop new varieties with desirable agronomic traits and to broaden the genetic basis of this economically important crop. There are a number of pepper germplasm collections around the world (the USA, South America, Asia and Europe). However, many of them are difficult to maintain due to their large size and a lack of adequate information about population structure and genetic diversity at the interspecific and intraspecific level. Selecting a representative core collection is a proven and effective tool for overcoming the expenses and difficulties of managing the huge genetic resources in the gene banks [Citation9]. The core collection is a subset of the germplasm collection that represents the genetic diversity of the entire collection, has no redundant accessions and is small enough to be easily managed [Citation10,Citation11].
Different types of descriptors like passport data, geographic origin, morphological, agronomical, biochemical and DNA markers can be used for phenotypic and genetic diversity evaluation and construction of core collections [Citation12–14]. There are already some core collections of Capsicum using phenotypic data [Citation15], genotypic data [Citation16,Citation17] as well as combined phenotypic and genotypic data [Citation18–20]. Core collections for disease resistance against northern root-knot nematode and Potato virus Y (PVY) have been constructed [Citation21,Citation22]. Hanson et al. [Citation23] developed Capsicum core collection to analyse the antioxidant (AO) content and antioxidant activity (AOA) in accessions from AVRDC-the World Vegetable Center.
The cultivated Capsicum species capture a broad diversity generated by evolution and natural selection, as well as domestication in different primary and secondary centres of diversity, and artificial selection in distinct agricultural environments [Citation24,Citation25]. The Balkans, including Bulgaria, are considered as the secondary centre of pepper diversity especially for C. annuum, where local forms (landraces) with diverse phenotypes and qualities have formed due to the specific agro-climatic conditions and breeding traditions [Citation26,Citation27]. Locally maintained and well adapted pepper landraces can still be found in small farms and villagers’ yards of Bulgaria and other Balkan countries. They have been maintained for centuries by passing down from generation to generation and preserving most important features including orientation, shape, size, colour and taste of the fruit, productivity and content of valuable bioactive components. Some of them in addition show good tolerance to biotic and abiotic factors and have been used in various breeding programmes to develop nutritionally improved and high yielding cultivars [Citation28,Citation29]. The high biodiversity of pepper represents a unique resource that could be used in future breeding programmes to increase the diversity and identify forms with increased resistance to a number of abiotic and biotic stress factors. Given the new priorities, it is relevant to study the biodiversity of Balkan pepper in the above-described aspects. Its in-depth characterization is of fundamental importance in order to avoid genetic erosion and to ensure maximum use of genetic variability in breeding programmes.
The Capsicum collection was created, developed and maintained as an initial step in the pepper breeding work at the Maritsa Vegetable Crops Research Institute (MVCRI), Plovdiv, Bulgaria many decades ago [Citation28]. It includes over 1500 pepper accessions which are collected in various ways: personal contacts, different expeditions, national and international exchange, etc. In recent years, the participation in different national and international projects enabled its increase with additional Balkan varieties, local forms (landraces) and breeding lines most of which have been collected from a large number of locations in six countries on the Balkan Peninsula (Bulgaria, Serbia, North Macedonia, Albania, Romania and Greece) under the SEE-ERA.NET PLUS project ERA 226. An important task of the research is the study and conservation of Balkan Capsicum resources. The large number of accessions of this collection greatly impedes the research process and the choice of genetic material to be included in the breeding programmes. This requires the creation of the core collection that includes a limited number of genetically diverse accessions to represent genetic diversity within the entire collection. This will ensure a more effective study of available pepper germplasm and the assessment of other important traits like productivity, the content of biologically active substances, minerals and trace elements, resistance to diseases and pests and a number of other biological characteristics that are relevant to the breeding process.
Up to now, part of the Capsicum annuum accessions with diverse phenotype have been characterized by conventional phenotyping, according to various Capsicum descriptors [Citation30,Citation31]; high-throughput fruit phenotyping using tomato analyser in combination with conventional analysis [Citation32], and by compilation of conventional and high-throughput phenotypic, biochemical and virus resistance analyses [Citation33]; testing for fungal [Citation34] and some important pest infestation [Citation35,Citation36].
However, a large part of this subset of accessions has never been analysed at the DNA level. To date only a small number of Bulgarian pungent small fruited red pepper landraces have been analysed by simple sequence repeat (SSR; microsatellite) markers [Citation37] and some commercial pepper varieties were recently analysed with inter simple sequence repeat (ISSR) markers [Citation29]. Therefore, more precise analysis using codominant microsatellite (SSR) markers is necessary to determine the genetic diversity and infer the population structure of Balkan peppers. This is a very important prerequisite for the next step aimed at development of a core collection with application in future breeding programmes and association mapping of important nutritional and environmental adaptation traits. Owing to the above considerations and the importance of more detailed pepper germplasm characterization, the aim of the present study was to evaluate the genetic diversity and to determine the genetic structure of 179 Balkan C. annuum accessions using 21 SSR markers and construct a mini core collection on the basis of these data.
Materials and methods
Plant material
The plant material consisted of 179 diverse Balkan pepper accessions, including local forms/landraces, varieties and 4 breeding lines (Capsicum annuum L.). The passport data for all 179 Balkan pepper accessions were described in previous studies [Citation32,Citation33]. They were maintained and phenotypically evaluated in Maritsa Vegetable Crops Research Institute (MVCRI), Plovdiv located in South-Central Bulgaria (42°10′35.3″N 24°45′50.5″E). Accessions were collected from Bulgaria, Serbia, North Macedonia, Albania, Romania and Greece. However, over 63% of them originated from Bulgaria. Some accessions collected from different regions of Bulgaria, Serbia and North Macedonia are known locally by the same name but appear to differ in their morphological characteristics and have been labelled differently (Supplemental Table S1). In addition, accessions showing segregation for some of the analysed phenotype traits were separated as distinct biotypes that were labelled with capital letters (A and B) in order to be genetically analysed and distinguished. Each accession was represented by 30 plants in three replications (10 plants/replication) in field trials at MVCRI in Plovdiv. The tested pepper accessions were divided into seven varietal groups according to their fruit shape, with conical, elongate, pumpkin shape, bell or blocky, conical to blocky, elongate to bell or blocky and round fruit types [Citation33].
DNA extraction
All DNA samples were extracted from freeze-dried leaf tissue (10–15 mg) of field-grown plants (10 individual plants/genotype) using a DNeasy PowerPlant ProHTP 96 Kit (Qiagen). The concentration and the purity of DNA samples were determined with a NanoDrop spectrophotometer (Thermo Fisher Scientific, Wilmington, DE, USA).
Primer synthesis
Published primers for pepper SSRs [Citation38–40], http://solgenomics.net (Supplemental Table S2) referred to as locus-specific primers (LSPs) were extended with generic non-complementary nucleotide sequences tagF 5’-ACGACGTTGTAAAA-3′ and tagR 5’-CATTAAGTTCCCATTA-3′, respectively, at their 5′ ends as described in Hayden et al. [Citation41]. Primer aliquots (50 pmol/µL) were prepared by mixing equimolar amounts of forward and reverse primers in miliQ H2O and were referred to as stock primer sets for each locus. In addition, two generic primers complementary to the LSP extension sequences, tagF’ 5′-ACGACGTTGTAAAA-3′ and tagR’ 5′-CATTAAGTTCCCATTA-3′, were also synthesized. The tagF’ primer was labelled at its 5′ end with one of the following fluorescent dyes: FAM, ATTO565 (PET) or ATTO550 (NED) to allow direct detection of alleles on the automated capillary sequencer (ABI3130, Thermo Fisher Scientific, Wilmington, DE, USA). All primers were synthesized by Microsynth (Microsynth AG, Balgach, Switzerland).
Polymerase chain reaction (PCR) assay
All uniplex PCR reactions (PCR) were performed according to Hayden et al. [Citation41] in a 6 µL reaction mixture containing 25–30 ng of genomic DNA, 2× MyTaq HS mix (Bioline), 75 nmol/L of each dye-labelled tagF’ and unlabelled tagR’ primers, and appropriate concentration (30–100 nmol/L) of unlabelled locus-specific primer (LSP), depending on the signal intensity of the markers used.
PCR was performed on a Veriti 96 Thermal Cycler (Thermo Fisher Scientific, Wilmington, DE, USA) using the following PCR conditions, depending on the melting temperature of the locus-specific primers. These were performed according to [Citation41–43] with some minor modifications:
The PCR programme 50°С included a denaturing step at 95°С for 3min, followed by 7 cycles of amplification, each including a denaturing step at 92°С for 30 s, an annealing step at 50°С for 1.30 min, and a synthesis step at 72°С for 1 min; 20 cycles: 92°С–30 s., 63°С–1.30 min, 72°С–1 min; 40 cycles: 92°С–15 s, 54°С–30 s, 72°С–1 min and final extension at 72°С for 10 min.
The PCR programme 61°С (62 or 63°С) included a denaturing step at 95°С for 3 min, followed by 25 cycles of amplification each including a denaturing step at 92°С for 30 s, 63°С (62 or 63°С) for 1.30 min and a synthesis step at 72°С for 1 min; 40 cycles: 92°С–15 s, 54°С–30 s, 72°С–1 min and final extension at 72°С for 10 min.
SSR analysis
Electrophoresis and visualization of SSR alleles was performed on an ABI3130 DNA analyser. A standardized multi-pooling procedure was used to prepare SSR products for electrophoresis. After PCR, a 3-fold initial dilution of the PCR products and subsequent mixing (1:1:0.5), respectively, FAM: PET: NED, was performed up to a final dilution of 1/25× to 1/75×. Seven mixed pools were developed according to the length of the PCR products (CAMS142_FAM, CAMS398_VIC and EPMS331_NED; HPMS2-24_FAM, GPMS29_PET and HPMS1-5_NED; HPMS1-6_FAM, CAMS405_PET and CAMS811_NED; CAMS153_FAM, EPMS376_PET and EPMS397_NED; HPMS2-13_FAM, EPMS335_PET and CAMS606_NED; HPMS1-143_FAM, CAMS234_PET and CAMS199_NED; CAMS864_FAM, EPMS418_PET and HPMS1-1_NED). In cases where the intensity of the amplified products was strong, a change in the mixing ratio of the labelled products was performed. Subsequently, the diluted products were mixed with labelled internal standards GeneScan™ 500 LIZ™ dye Size Standard (Thermo Fisher Scientific, Wilmington, DE, USA) and formamide, denatured and electrophoresed on an ABI3130 DNA analyser. SSR allele sizing was performed with the Gene Mapper v4 software (Thermo Fisher Scientific, Wilmington, DE, USA).
Data analysis
Allele number, frequency of alleles, observed heterozygosity (Ho), expected heterozygosity (He) and Polymorphic Information Content (PIC) were calculated with Power Marker v3.25 software [Citation44]. The chord distance matrix [Citation45] was used to construct a phylogenetic tree with the unweighted pair group method with arithmetic mean (UPGMA) module of Power Marker v3.25. The resulting tree was visualized and annotated by using the Evolview v3 webserver [Citation46]. The clades in the phylogenetic tree were visually identified as monophyletic groups that could be separated from the main tree with a single cut according to the clade definition provided in [Citation47].
Genetic structure analysis
A model-based population structure analysis was performed in STRUCTURE 2.3 [Citation48] using an admixture model with correlated allele frequencies. The tested number of possible K was set from 1 to 15 with 15 runs for each K. Each run had a burn-in period of 100,000 and 1,000,000 MCMC iterations. The most probable value of K was determined using the ΔK [Citation49] implemented in Structure Harvester v. 6.93 [Citation50]. The genotypes were assigned to a respective group if showing membership coefficient ≥70%. The graphical representation of the cluster analysis was done using the pophelper package in R version 4.0.4 [Citation51]. The degree of differentiation between the resulting genetic clusters was evaluated using pairwise Jost’s D [Citation52] and analysis of molecular variance (AMOVA) in R version 4.0.4 [Citation51].
In order to analyse the presence of patterns manifested by quantitative phenotypic traits in the groups established by the clustering, we performed a principal component analysis (PCA). The results from the PCA were visualized using colour codes for the structure clusters and geometric form codes for the fruit shape. For the analysis we used data for plant height, stem height, fruit length, fruit weight, fruit width and fruit wall thickness. The phenotype data used for the PCA are published in [Citation33]. The analysis was done and visualised in R version 4.0.4 [Citation51].
The SSR marker data were used for construction of a mini core collection with the Core Hunter 3 package in R [Citation53]. For this purpose, we tested two optimization strategies. The first one aimed to minimize the distance between each accession and the nearest entry from the core collection (A-NE). The second was a simultaneous optimisation of A-NE and maximization of allele richness, expressed as the percentage retained in the core collection alleles from the whole collection. Both approaches were done with the Cavali-Sforza distance matrix [Citation45]. The proportion of retained alleles was used as a direct measure for the preserved genetic diversity by the core collections. We also compared this metric of the collections to the mean of 1000 randomly selected samples of respective sizes.
Results
Genetic diversity of Balkan Capsicum annuum accessions using SSR markers
To explore the genetic diversity and population structure, we investigated the patterns of molecular diversity with 21 SSR markers in the Balkan C. annuum germplasm collection consisting of 179 accessions, phenotypically evaluated using various Capsicum descriptors.
The markers were selected to cover 8 of the 12 chromosomes of pepper with a minimum of 1 marker per chromosome. In this study, standardized PCR conditions at 4 different temperatures of annealing (50, 61, 62 and 63 °C) were optimized (Supplemental Table S2), which enabled amplification of markers in multiplexed PCR reactions. Standardized PCR conditions were achieved by performing an initial optimization step with five different LSP primer concentrations (30, 50, 60, 80 and 100 nmol/L). The adjusted LSP primer concentration enabled the PCR specificity and yield to be controlled and helped to prevent non-specific annealing of LSP during the first few PCR cycles [Citation41]. As previously observed [Citation42,Citation43], this optimization step was a prerequisite for correct and efficient amplification of microsatellite alleles in all tested genotypes and eliminated the need to use complex touchdown PCR or to adjust the annealing temperatures for each locus. The standardized procedure is cost-effective by enabling multiplexing of several loci in one PCR reaction.
Just a few accessions displayed undistinguishable multilocus genotypes at all analysed 21 SSR loci. These genetically redundant accessions (CAPS-021, CAPS-133 and CAPS-143) were removed from the subsequent analyses, leading to a final panel of 176 genotypes.
The diversity pattern of the 21 SSR loci across the whole set of accessions revealed a total of 146 distinct alleles ranging from 2 in locus HPMS1-6 to 18 in locus CAMS864, with a mean of 6.95 alleles per locus (). Several genotypes showed null alleles in 7 out of the 21 loci tested. Out of the 146 detected SSR alleles, 63 were ‘common alleles’ (frequency of >5% in the analysed set), 43 were ‘less common alleles’ (frequencies between 1% and 5%), 40 were very rare alleles (frequency of <1% in the analysed set). The fact that about a half of the alleles were with frequencies of less than 5% is evidence for the presence of a broad level of genetic diversity in the studied set of 176 C. annuum genotypes. The mean PIC for all 21 SSR markers was 0.483, with values ranging from 0.022 for marker HPMS2-13 on chromosome P1 to 0.873 for marker CAMS864 on chromosome 7.
Table 1. SSR markers, chromosome location, major allele frequency, number of genotypes, allele number, expected (He or GD), observed heterozygosity (Ho) and Polymorphic information content (PIC).
The genetic diversity index (He or GD) ranged from 0.022 (HPMS2-13) to 0.879 (CAMS864) with a mean of 0.531. The average observed heterozygosity (Ho) across all 21 loci was 0.249, with the highest values of 0.994 in loci HPMS1-1 and CAMS234, and 0.972 in locus CAMS153. Absence of heterozygous accessions was observed only in the locus HPMS2-13, which showed the lowest level of He.
Genetic structure of the Balkan Capsicum annuum collection
The SSR genotyping results were used to perform population structure analysis for 176 accessions under an admixture model using the STRUCTURE software [Citation48]. The optimal number of clusters by Evano method [Citation49] was defined as K = 3 (). Two additional peaks were detected in the Evano graph, one at K = 4 and a lower one at K = 11. A genotype was considered a member of a particular cluster if the probability for the membership was at least 70%. For K = 3 (), the resulting clusters consisted of 35, 53, 51 and 35 genotypes for clusters 1, 2, 3 and admixed accessions, respectively. Cluster 1 included 4 Albanian, 16 Bulgarian, 2 Greek, 3 Macedonian, 7 Romanian, 2 accessions from Serbia and one accession of unknown origin, CAPS-151A. More than a half (51.4%) of the genotypes in Cluster 1 had big pumpkin-shaped fruits, 34.4% had bell- or blocky-shaped fruits, three accessions had round fruit shape and two had a conical shape. Cluster 2 contained 3 Albanian, 36 Bulgarian, 1 Macedonian and 13 Serbian pepper genotypes. Ninety-four percent of the accessions in Cluster 2 had a conical fruit shape. This group included one representative of each of the three fruit types: elongate, round and bell or blocky (CAPS-166, CAPS-068, and CAPS-160). All of the accessions in Cluster 2 with the exception of CAPS-068 had non-pungent fruits. Cluster 3 consisted of 35 Bulgarian, 9 Macedonian, 1 Romanian and 6 Serbian accessions. It was the most diverse in respect of fruit shape types and fruit sizes. The cluster included all the types of fruit shapes in the collection. However, genotypes with elongate and conical fruits were prevalent with 47.06% and 39.2%, respectively (). This cluster was very diverse in terms of fruit tastes, as it included accessions with non-pungent fruits and ones showing different levels of pungency. The majority of genotypes (almost 63%), however, had pungent fruit taste. The accessions that were not assigned to any of the three clusters formed a group of 24 Bulgarian, 3 Macedonian, 2 Romanian, 6 Serbian accessions and two accessions of unknown origin (CAPS-151 and CAPS-151B). The group consisted of genotypes with various fruit shapes and sizes. Fifty-nine percent of the genotypes in this admixed group were with conical fruits, 27% with elongate, about 11% with pumpkin and one genotype (CAPS-136) with bell or blocky shaped fruits. Most of them were non-pungent but 12 (34.3%) showed different levels of pungency.
Figure 1. Populations inferred by model-based approach in the whole Balkan Capsicum annuum collection based on the allelic variants at 21 SSR loci. (A) Optimal K by the method of Evanno et al. [Citation49]. (B) Classification of the 176 C. annuum accessions using Structure 2.3.4 at K = 3 (upper barplot) and K = 4 (lower barplot); the distribution of the individuals into distinct clusters by the model-based method is indicated by the colour code in the legend. (C) Distribution of different fruit types in the model-based clusters; colour codes for the distinct fruit types are shown in the legend.
![Figure 1. Populations inferred by model-based approach in the whole Balkan Capsicum annuum collection based on the allelic variants at 21 SSR loci. (A) Optimal K by the method of Evanno et al. [Citation49]. (B) Classification of the 176 C. annuum accessions using Structure 2.3.4 at K = 3 (upper barplot) and K = 4 (lower barplot); the distribution of the individuals into distinct clusters by the model-based method is indicated by the colour code in the legend. (C) Distribution of different fruit types in the model-based clusters; colour codes for the distinct fruit types are shown in the legend.](/cms/asset/a69e5515-b76e-4758-833d-32cd828de4f2/tbeq_a_1946428_f0001_c.jpg)
The presence of secondary and tertiary smaller peaks at increasing Ks pointed at underlying sub-clustering within the 3 main clusters. In order to further explore this hypothesis, we also examined the population structure at K = 4 and K = 11. Clear separation of Cluster 3 into two subclusters, Cluster 3.1 and Cluster 3.2, was evident at K = 4 ( and Citation2). Cluster 3.1 consisted of 11 accessions having relatively smaller fruits in comparison to Cluster 3.2, which comprised 41 genotypes with predominantly elongate and conical fruits. Additional sub-clustering in the other main clusters was also observed at K = 11 (). The two main clusters, Cluster 1 and Cluster 2 that remained intact at K = 4, were also each split into three distinct subclusters at K = 11. The two sub-clusters at K = 4 derived from the most diverse main Cluster 3, were further subdivided at K = 11. Cluster 3.1 was separated into distinct subclusters, Cluster 3.1.1 and a group of admixed accessions with more than 50% membership to Cluster 3.1.2. The larger sub-cluster (3.2) was also split into two distinct sub-clusters (3.2.1 and 3.2.2) and a group of admixed genotypes sharing between 20 and 30% membership with both Cluster 3.2.2 and Cluster 3.2.3 (). Notably, Cluster 3.2.3 did not form distinct separation at K = 11 but only participated in admixed accessions.
Figure 2. Phylogenetic tree of the Balkan C. annuum germplasm collection. The tree was produced using the UPGMA method based on chord distance [Citation45] computed from the allele frequencies at 21 SSR loci. The tree is drawn and annotated using the Evolview v3 [Citation46] with the following additional data starting from right to left: barplots of the group membership from the model based genetic structure analysis at K = 3, K = 4 and K = 11; fruit shapes of the accessions annotated with text and different colours; cl-1 to cl-17B represent the main clades in the tree. Different fruit shapes are additionally indicated by different shapes and colours of the tree leaves.
![Figure 2. Phylogenetic tree of the Balkan C. annuum germplasm collection. The tree was produced using the UPGMA method based on chord distance [Citation45] computed from the allele frequencies at 21 SSR loci. The tree is drawn and annotated using the Evolview v3 [Citation46] with the following additional data starting from right to left: barplots of the group membership from the model based genetic structure analysis at K = 3, K = 4 and K = 11; fruit shapes of the accessions annotated with text and different colours; cl-1 to cl-17B represent the main clades in the tree. Different fruit shapes are additionally indicated by different shapes and colours of the tree leaves.](/cms/asset/aa5559f9-21ee-449e-8e60-d24b4ae03a22/tbeq_a_1946428_f0002_c.jpg)
Genetic structure and quantitative phenotypes
To analyse the distribution of the genotypes in the clusters inferred by the model-based approach, a biplot analysis of several quantitative traits was performed. The greatest contribution to the first composite axis had the fruit width and fruit wall thickness, while stem height, plant height and fruit length contribute to the second axis. The biplot graph (Supplemental Figure S1) clearly illustrated the characteristics of the genotypes grouped together, representing three consecutive zones each dominated by members of one of the inferred genetic clusters. The majority of the accessions from Cluster 1 were situated to the right end mainly in quadrant 4, but some of them fell into quadrant 1. They had wide fruits with average or below the average length, thick fruit wall and a low fruit length-to-width ratio, whose values in most of the genotypes were close to 1 or lower. The accessions from Cluster 2 are situated to the left of the genotypes from Cluster 1, in both quadrants 1 and 4. The group has a greater length to width ratio and a lower average fruit wall thickness compared to the genotypes from Cluster 1, but still higher than the whole collection mean. The genotypes from Cluster 3, a highly diverse group with small round or elongate fruits, had three features in common: the small fruit width and weight and thin fruit wall. The genotypes with elongate fruits also had low fruit length-to-width ratio. The members of the two subclusters at K = 4 (Cluster 3.1 and Cluster 3.2, ) were interspersed in quadrants 2 and 3 on the biplot figure, and there is no obvious difference between them. However, the accessions from Cluster 3.1 had more than twice as small fruit length-to-width ratio, and much lower weight. The admixed accessions were scattered in all of the four quadrants.
Genetic structure and genetic diversity
The analysis of genetic diversity in the clusters derived using the model-based approach at K = 3 revealed that Cluster 3 was the most diverse group (). It had the highest number of alleles, allele richness and gene diversity followed by the group of admixed accessions, Cluster 1 and Cluster 2. All clusters had numerous private alleles: 21 in Cluster 3, 11 in both, Cluster 1 and the admixed group, and 6 in Cluster 2. Most of these private alleles were with very low frequencies and just eight of them exceeded 5% frequency in the respective cluster: four in Cluster 2 and four in Cluster 3 (Supplemental Table S3). To analyse the level of genetic differentiation between the clusters, we evaluated Jost’s D index and AMOVA. These analyses were done using only the accessions with more than 70% membership to one of the three main clusters, excluding the admixed genotypes. The observed values of D index ranged between 0.15, for Clusters 1 and 2, and 0.186, between Clusters 1 and 3 (Supplemental Table S4). The results from the AMOVA showed that 15.4% of the genetic variance was partitioned among the populations, 41.1% among the samples within populations and 43.5% within the samples (Supplemental Table S5). When considering K = 4, the differentiation between the clusters was more pronounced. We estimated higher values for D, ranging between 0.15 for the cluster consisting predominantly of bell or blocky fruits and the one with conical ones (Clusters 1 and 2), and 0.29 between the new subcluster 3.1 and the one with predominantly bell and blocky fruits. According to the AMOVA results, the differentiation between the clusters also increased at K = 4, as the percentage of the between-cluster variation was estimated to be 17.6% (Supplemental Table S5). It is worth noting that the smallest group, Cluster 3.1 had 72 alleles.
Table 2. Pattern of genetic diversity in four C. annuum clusters from the model-based analysis.
Phylogenetic analysis
A phylogenetic tree based on chord genetic pairwise distances [Citation45] was constructed using the UPGMA procedure. The tree grouped the accessions into 17 Clades including two subclades, Clade 17a and Clade 17b. It shows generally good congruence with the three main clusters inferred by the model-based approach at K = 3 and the substructures at K = 4 and K = 11 (), providing finer resolution of the population structure. This is best visible in Clade 17, where most of the conical fruit accessions belonging to the main Cluster 2 of the model based clustering were grouped into two large subclades. These were further separated into smaller subclades, grouping together accessions belonging to substructure clusters at K = 11. Some of the admixed accessions that cannot be associated with a single substructure cluster were also grouped in distinct subclades in the phylogenetic tree. It is worth noting that four accessions (CAPS-009, CAPS-049, CAPS-114 and CAPS-018) were separated into single accession clades (cl.-3, cl.-7, cl.-8 and cl.-15, )
Construction of a mini core collection
In order to construct a ‘multi-purpose’ or CC-I type of core collection, according to the classification described by Odong et al. (2013) [Citation11], we constructed two series of core collections. Each of the series consisted of six core collections with an increasing number of individuals from 5% to 30% of the whole collection with increments of five percent. The series differed by the optimization method used for the selection of the entries in the core collections. One of them was constructed using minimization of accession-to-nearest-entry distance (A-NE), and the other was optimized by combining the A-NE with the maximization of allele coverage (CV). The metrics from both approaches were compared to the means of 1000 randomly selected groups of the same sizes. The selection resulted in six mini core collections consisting of 9, 18, 26, 35, 44 and 53 individuals.
The genetic diversity was preserved at significantly higher levels in the collections constructed combining A-NE and allele richness as construction criteria. The approach using just A-NE minimisation as an optimization method resulted in selection of collections which retained much lower proportions from the alleles discovered in the whole collection; their numbers were commensurable with the means of the randomly selected collections of the same sizes (). On the other hand, A-NE as a sole optimization criterion provided a better representativeness of the accessions from the whole panel, as manifested by the lower average A-NE distances ().
Figure 3. Comparison of the two methods used for sampling core collections with increasing number of entries to random samples of the same size: (A) Proportion of retained alleles; (B) Average distance from accession to the nearest entry.
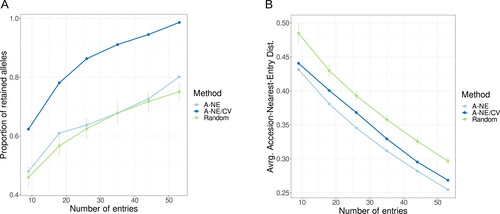
The analysis showed that the method based on the combination of the two criteria was superior for preserving allele richness while keeping the representativeness at an acceptable level. Therefore, we choose the A-NE/CV method for final sampling of the core collections. By using the combined method, samples of 9, 18, 26, 35, 44 and 53 individuals captured 62, 75, 86, 91, 95 and 99% of the alleles from the whole collection (). The final mini core collection of 44 accessions captured nearly 95% of the SSR alleles, including all common alleles, all less common alleles and 32 out of 40 very rare alleles (Supplemental Figure S2(A)). Out of the 44 entries, 9 were from Cluster 1, 8 from Cluster 2, 18 from Cluster 3 and 9 from the admixed accessions (, Supplemental Table S6) and they were relatively evenly distributed among different clades of the phylogenetic tree (Supplemental Figure S2(B)).
Table 3. Core collections of different sizes sampled by simultaneously applying two criteria (minimising distance from a selected accession to the nearest entry and maximizing allele coverage).
Discussion
Genetic resources are an important tool for overcoming the current challenges posed by climate change and the need to provide food security for the growing human population. However, the large size of these collections is a serious drawback for their proper use in conservation and management practices.
Establishment of a core collection is a primary objective of many gene banks around the world because of the reduced cost and the efforts for its conservation. One of the most important issues is to develop a subset of accessions in which the gene diversity of the whole collection is preserved.
The Balkan Capsicum collection analysed in this study is a part of the large collection developed through many years of exchange of genetic material among the gene banks, breeding efforts and expeditions in Bulgaria and neighbouring countries on the Balkan Peninsula. In this study, 179 accessions of C. annuum L. most of which representing local forms adapted to the specific agro-climatic conditions and selected through many years’ traditions of cultivation in small private farms on the Balkan Peninsula, cultivars and breeding lines were subjected to molecular and phenotypic evaluation as a step towards the development of a mini core collection. The number of accessions in our study is much smaller than those reported in other studies. However, it includes only C. annuum genotypes. For example, Gu et al. [Citation17], Nicolaï et al. [Citation18], Lee et al. [Citation19] and Carvalho et al. [Citation20] have used a higher number of accessions collected from wider geographic areas and included different Capsicum species like C. annuum L., C. frutescens L., C. chinense Jacq., C. eximium, C. praetermissum, C. baccatum L., C. pubescens, C. cardenasii, C. galapagoense and C. tovarii. Although the genus Capsicum has a broad genetic base among species [Citation18], this of C. annuum is much narrower. Searching for C. annuum accessions with high levels of genetic and phenotypic diversity is a prerequisite for development of core collections with broad applicability. The studied collection consists of a large number of C. annuum landraces which constitute about 2/3 of the accessions and represent a valuable reservoir for improvement of the present pepper germplasm.
Genetic diversity in the studied C. annuum collection
To assess the genetic diversity and structure of the selected number of accessions, we used 21 SSR markers distributed on 8 pepper chromosomes. Most markers showed high PIC values with the highest one for CAMS864 and CAMS606 on chromosome 7 and CAMS234 on chromosome 6 which warrants their further use in pepper diversity studies in Bulgaria. The overall genetic diversity (He) of the studied C. annuum accessions is 0.531 with a mean number of alleles (MNA) of 6.952. These values are higher than the ones reported for 3 338 C. annuum accessions by Lee et al. [Citation19] using SNP markers (He = 0.44), 222 accessions of C. annuum genotyped at 32950 SNP loci by Taranto et al. [Citation54] (He = 0.048) and for 1 904 Capsicum spp. accessions by Gu et al. [Citation17] using 29 SSR markers (He = 0.486), but lower than those identified by Nicolaï et al. [Citation18] for 908 C. annuum accessions with 28 SSR markers (He = 0.59, MNA = 12.57) and by Zhang et al. [Citation55] for 372 accessions of which 369 of C. annuum using 28 SSR markers (He = 0.63, MNA = 13.79).
The mean Ho value (0.249) in our study is higher than the one observed by Nicolaï et al. [Citation18], Lee et al. [Citation19], Taranto et al. [Citation54] and Gu et al. [Citation17] (<0.085, 0.12, 0.023 and 0.119, respectively). The higher level of Ho observed in Bulgarian C. annuum collection is due to the higher natural outcrossing rate of pepper, especially in landraces which constitute about 2/3 of the studied C. annuum collection. The lower Ho values observed by other authors could be explained by maintaining and multiplication of accessions through selfing [Citation18] or by long time inbreeding process including artificial selection, non-random mating between individuals, population structure and size as well as Wahlund effect (mixing of individuals from different genetic sources) [Citation56,Citation57].
Genetic structure of the studied C. annuum collection
The model-based analysis of the genetic structure of the collection established that the most probable number of clusters given the marker data is three. The genotypes were combined in the resulting groups irrespective of the country of origin. Although the clusters were dominated by accessions of one or two fruit shape types, there were no clusters consisting entirely of a particular fruit type. Further analysis of the phenotypic diversity within and across clusters, using several quantitative traits, revealed that there are phenotypic features common for the genotypes that grouped together. The quantitative traits of the fruits were the most pronounced, as the patterns of the diversity were mainly imposed by the thickness of the pericarp and the width and weight of the fruits, which was very well demonstrated by the biplot chart (Supplemental Figure S1), where the genotypes from the different clusters prevailed in certain areas depending on the values of these traits. The number of detected clusters in our study is in good agreement with those reported by Oh et al. [Citation37] in a collection of 61 Bulgarian mostly pungent small fruited red pepper landraces and other authors studying the genetic diversity in collections of Capsicum annuum of larger sizes [Citation55] and larger places of origin [Citation18]. It should be noted that unlike us, Oh et al. [Citation37] found no relationship between the STRUCTURE derived clusters and the morphological traits of the fruits. The lack of such a relationship is probably due to similarity in the fruit shape and size of most studied accessions. In regard to the relationship between the distribution of genotypes by clusters and the fruit morphology Zhang et al. [Citation55] and Nicolaï et al. [Citation18] observed very similar patterns of clustering. Several authors reported genetic structures in C. annuum collections, consisting of different numbers of underlying clusters ranging from 2 [Citation25,Citation58] to 6 or 8 [Citation59]. However, González-Pérez et al. [Citation25] found that the division into two clusters was mainly geographical and when the analysis was confined to the local Spanish accessions they also established the presence of three clusters in which the genotypes were distributed according to the fruit and plant traits. We also observed additional peaks of ΔK at K = 4 and 11. In our model-based analysis, when the K was set to K = 4, Cluster 3 was divided into two new sub-clusters of accessions with distinct fruit sizes. The division of these sub-clusters led to an increase in the values of pairwise metric (Jost’ D) for population differentiation, defining sub-structure Cluster 3.1 as the most divergent group. The AMOVA also showed increased values of the between-cluster variation from 15.36% at K = 3 to 17.64% at K = 4. Although much lower than the between-cluster variation reported by Rivera et al. [Citation59], it is close to the value between wild and domesticated populations in northwestern Mexico reported by Oyama et al. [Citation60]. These results show that the clusters could potentially be subdivided into more genetic sub-clusters as suggested by the presence of the additional peak of ΔK at K = 11.
Construction of a Balkan mini core collection
The Balkan Peninsula is an early centre of adaptation of the species from the so-called Mesoamerican food complex in Europe [Citation61]. According to Andrews [Citation61], these species found their way from the markets of the Ottoman Turkish Empire through the Balkans to Central Europe. His hypothesis was supported by the results of Nicolaï et al. [Citation18], defining the accessions from these parts of Europe as a ‘distinct genetic pool’. To facilitate the conservation of the C. annuum genetic diversity represented in the current collection from the Balkans, we aimed at constructing a multipurpose mini core collection. Of the two tested approaches, the one combining minimization of accession-to-nearest-entry distance and maximization of allele richness performed significantly better in encompassing the genetic diversity present in the whole collection in terms of percentage of retained alleles and the number of rare alleles captured in the mini core collection. Several C. annuum core collections have been constructed for different purposes. Nicolaï et al. [Citation18] established a core collection of 332 entries that captured 97% of the genetic and phenotypic diversity for further association studies. Recently, Gu et al. [Citation17] constructed a core collection based on SSR data consisting of 248 entries which covered 75.6% of the SSR alleles for further genotyping and gene-mining research. The final mini core collection of 44 entries proposed in the present study was sampled solely on the basis of the genetic data including allele diversity of 176 C. annuum accessions at 21 SSR loci and the genetic structure inferred from these data. Still, it captured nearly 95% of all alleles and 80% of the very rare alleles while maintaining good representativeness of the accessions, indicating that it could be very useful both in C. annuum improvement by breeding and in germplasm conservation. However, to construct and optimize most suitable mini core collections for specific purposes, the important phenotypic traits must also be considered. Therefore, further research, focused on optimization and testing of most suitable core collections for different purposes, based on different combinations of both genotypic and phenotypic data and comparing various sampling criteria is required to complete this task.
Conclusions
In the present study, a Balkan mini core collection of Capsicum annuum was constructed based on the allele information at 21 SSR loci and the genetic structure inferred from these data. The mini core collection is composed of 44 C. annuum accessions from several geographic locations on the Balkan Peninsula that retained a large proportion of the gene diversity present in the germplasm collection of 176 non-redundant accessions analysed in this study. The proposed mini core collection was also found to have good representativeness of the studied germplasm and therefore could be very useful in both C. annuum improvement by breeding and germplasm conservation. Further studies, including a larger sample of the more than 1500 Capsicum germplasm accessions currently maintained at the Maritsa Vegetable Crops Research Institute could allow selection of larger diverse core collections that will be suitable for gene mining and genome-wide association studies.
Author contributions
Elena G. Todorovska (EGT) conceptualized and designed the experiment, analysed data, prepared tables, prepared original draft and reviewed drafts, approved the final draft. Nikolai K. Christov (NKC) performed experiments, analysed data, prepared figures and tables, prepared and reviewed drafts of the paper, and approved the final draft. Stefan Tsonev (ST) performed experiments, analysed data, prepared figures and tables, prepared and reviewed drafts, and approved the final draft. Velichka Todorova (VT) maintained, evaluated phenotypically, described and contributed the material, reviewed drafts of the paper, and approved the final draft.
Supplemental Material
Download Zip (434.5 KB)Disclosure statement
No potential conflict of interest was reported by the authors.
Additional information
Funding
Related Research Data
References
- Hayman M, Kam PCA. Capsaicin: a review of its pharmacology and clinical applications. Curr Anaesth Crit Care. 2008;19(5-6):338–343.
- Pathirana R. Peppers: vegetable and Spice Capsicums, 2nd edition, by Paul W. Bosland and Eric J. Votava. N Z J Crop Hortic Sci. 2013;41(2):102–103.
- Chhapekar SS, Jaiswal V, Ahmad I, et al. Progress and prospects in Capsicum breeding for biotic and abiotic stresses. In: Vats S, editor. Biotic and abiotic stress tolerance in plants. Singapore: Springer; 2018. p. 279–322.
- Mohd Hassan N, Yusof NA, Yahaya AF, et al. Carotenoids of Capsicum fruits: pigment profile and health-promoting functional attributes. Antioxidants. 2019;8(10):469.
- Eshbaugh WH. The taxonomy of the genus Capsicum. In: Russo V, editor. Peppers: botany, production and uses. Wallingford: CABI; 2012. p. 14–28.
- Pickersgill B. Cytogenetics and evolution of Capsicum L. In: Tsuchiya T, Gupta PK, editors. Chromosome Engineering in Plants: Genetics, Breeding, Evolution. Developments in plant genetics and breeding. Amsterdam: Elsevier; 1991. p. 139–160.
- Pickersgill B, Heiser CB, McNeill J. Numerical taxonomic studies on variation and domestication in some species of Capsicum. In: Hawkes J, Lester R, Skelding A, editors. The biology and taxonomy of the Solanaceae. London: Academic Press for the Linnean Society; 1979. p. 679–700.
- Bosland PW, Votava EJ. Peppers: vegetable and spice Capsicums. 2nd ed. Cambridge, MA: CABI; 2012.
- Borrayo E, Takeya M. Signal-processing tools for core-collection selection from genetic-resource collections. F1000 Res. 2015;4:97.
- Frankel OH. Genetic perspectives of germplasm conservation. In: Arber W, Illmensee K, Peacock WJ, editors. Genetic manipulation : impact on man and society. Cambridge: Cambridge University Press; 1984. p. 161–170.
- Odong TL, Jansen J, van Eeuwijk FA, et al. Quality of core collections for effective utilisation of genetic resources review, discussion and interpretation. Theor Appl Genet. 2013;126(2):289–305.
- Dias GB, Gomes VM, Moraes TMS, et al. Characterization of Capsicum species using anatomical and molecular data. Genet Mol Res. 2013;12(4):6488–6501.
- Tripodi P, Greco B. Large scale phenotyping provides insight into the diversity of vegetative and reproductive organs in a wide collection of wild and domesticated peppers (Capsicum spp.) Plants (Basel). 2018;7(4):103.
- Pereira-Dias L, Vilanova S, Fita A, et al. Genetic diversity, population structure, and relationships in a collection of pepper (Capsicum spp.) landraces from the Spanish centre of diversity revealed by genotyping-by-sequencing (GBS). Hortic Res. 2019;6(1):13.
- Zewdie Y, Tong N, Bosland P. Establishing a core collection of Capsicum using a cluster analysis with enlightened selection of accessions. Genetic Resour Crop Evol. 2004;51(2):147–151.
- Mongkolporn O, Hanyong S, Chunwongse J, et al. Establishment of a core collection of chilli germplasm using microsatellite analysis. Plant Genet Resour. 2015;13(2):104–110.
- Gu X, Cao Y, Zhang Z, et al. Genetic diversity and population structure analysis of Capsicum germplasm accessions. J Integ Agricult. 2019;18(6):1312–1320.
- Nicolaï M, Cantet M, Lefebvre V, et al. Genotyping a large collection of pepper (Capsicum spp.) with SSR loci brings new evidence for the wild origin of cultivated C. annuum and the structuring of genetic diversity by human selection of cultivar types. Genet Resour Crop Evol. 2013;60(8):2375–2390.
- Lee H-Y, Ro N-Y, Jeong H-J, et al. Genetic diversity and population structure analysis to construct a core collection from a large Capsicum germplasm. BMC Genet. 2016;17(1):142
- Carvalho S, Ragassi CF, Faleiro FG, et al. Establishment of Capsicum frutescens core collections based on morphological and molecular descriptors and on virus incidence. Genet Mol Res. 2020;19(1):gmr18503.
- Thies J, Fery R. Evaluation of a Core of the U.S. Capsicum Germplasm Collection for Reaction to the Northern Root-knot Nematode. HortSci. 2002;37(5):805–810.
- Quenouille J, Saint′Felix L, Moury B, et al. Diversity of genetic backgrounds modulating the durability of a major resistance gene. Analysis of a core collection of pepper landraces resistant to Potato virus Y. Mol Plant Pathol. 2016;17(2):296–302. doi:
- Hanson PM, Yang R, Lin S, et al. Variation for antioxidant activity and antioxidants in a subset of AVRDC-the World Vegetable Center Capsicum core collection. Plant Genet Resour. Cambridge University Press. 2004;2(3):153–166.
- DeWitt D, Bosland PW. Peppers of the world: an identification guide. Berkeley USA: Ten Speed Press; 1996.
- González-Pérez S, Garcés-Claver A, Mallor C, et al. New insights into Capsicum spp relatedness and the diversification process of Capsicum annuum in Spain. He G, editor. PLoS One. 2014;9(12):e116276.
- Krasteva L, Stoilova T, Varbanova K, et al. Bulgarian Landrace inventory – significance and use. In: Veteläinen M, Negri V, Maxted N, editors. European landraces: on-farm conservation, management and use. Rome: Biodiversity International; 2009. p. 53–68.
- Krasteva L, Pandeva R, Rodeva R, et al. Pepper as a target object of see-era.net project. Acta Hortic. 2012;960_21:151–158.
- Todorov Y, Todorova V, Results and perspectives in the breeding and research work with pepper (C. annuum L.). Proceedings of first symposium on horticulture. Ohrid: Faculty of Agriculture Skopje University st Cyril and Methodius–Skopje; 2002. p. 214–218.
- Tsonev S, Todorova V, Groseva S, et al. Evaluation of diversity in Bulgarian pepper cultivars by agronomical traits and ISSR markers. Genetika. 2017;49(2):647–662.
- Todorova V, Lidansky T, Todorov Y. Stability and adaptability differences among green pepper cultivars (Capsicum annuum L.). J Scientific Agricult Res, Serbia Montenegro. 2004;65:27–36.
- Todorova V. Fruit characterization and influence of variation factors in pepper Kapiya type varieties and breeding lines (Capsicum annuum L.). Bulgarian J Agricult Sci. 2007;13:309–315.
- Nankar AN, Tringovska I, Grozeva S, et al. Application of high-throughput phenotyping tool Tomato Analyzer to characterize Balkan Capsicum fruit diversity. Sci Hortic. 2020;260:108862.
- Nankar AN, Todorova V, Tringovska I, et al. A step towards Balkan Capsicum annuum L. core collection: phenotypic and biochemical characterization of 180 accessions for agronomic, fruit quality, and virus resistance traits. Ezura H, editor. PLoS One. 2020;15(8):e0237741
- Vasileva K, Todorova V, Masheva S. Evaluation of collection of pepper (Capsicum spp.) resources for resistance to Verticillium dahliae Kleb. Bulgarian J Agricult Sci. 2019;25:1030–1038.
- Yankova V, Todorova V, Markova D. Screening of pepper (Capsicum spp.) accessions for infestation by pests in. Bulgarian J Agricult Sci. 2020;26:841–846.
- Yankova V, Todorova V, Markova D. Evaluation of pepper (Capsicum annuum L.) accessions for infestation by pests. Bulgarian J Agricult Sci. 2021;27:350–356.
- Oh S-J, Song J-Y, Lee J, et al. Evaluation of genetic diversity of red pepper landraces (Capsicum annuum L.) from Bulgaria using SSR markers. Kor J Intl Agri. 2012;24(5):547–556.
- Minamiyama Y, Tsuro M, Hirai M. An SSR-based linkage map of Capsicum annuum. Mol Breeding. 2006;18(2):157–169.
- Nagy I, Stágel A, Sasvari Z, et al. Development, characterization, and transferability to other Solanaceae of microsatellite markers in pepper (Capsicum annuum L.). Genome/National Research Council Canada = Génome/Conseil National de Recherches Canada. 2007;50(7):668–688.
- Lee JM, Nahm SH, Kim YM, et al. Characterization and molecular genetic mapping of microsatellite loci in pepper. Theor Appl Genet. 2004;108(4):619–627.
- Hayden M, Nguyen TM, Waterman A, et al. Multiplex-ready PCR: a new method for multiplexed SSR and SNP genotyping. BMC Genomics. 2008;9:80
- Tsonev S, Velichkova M, Todorovska E, et al. Development of multiplex primer sets for cost efficient SSR genotyping of maize (Zea mays) mapping populations on a capillary sequencer. Bulgarian J Agricult Sci. 2013;19:5–9.
- Todorovska E, Ivanova A, Ganeva D, et al. Assessment of genetic variation in Bulgarian tomato (Solanum lycopersicum L.) genotypes, using fluorescent SSR genotyping platform. Biotechnol Equip. 2014;28(1):68–76.
- Liu K, Muse SV. PowerMarker: an integrated analysis environment for genetic marker analysis. Bioinformatics. 2005;21(9):2128–2129.
- Cavalli′Sforza LL, Edwards AWF. Phylogenetic analysis: models and estimation procedures. Evolution. 1967;21(3):550–570.
- Subramanian B, Gao S, Lercher MJ, et al. Evolview v3: a webserver for visualization, annotation, and management of phylogenetic trees. Nucleic Acids Res. 2019;47(W1):W270–W275.
- Baum D. Phylogenetic Trees and Monophyletic Groups | Learn Science at Scitable [Internet]. [cited 2021 May 26]. Available from: https://www.nature.com/scitable/topicpage/reading-a-phylogenetic-tree-the-meaning-of-41956/.
- Pritchard JK, Stephens M, Donnelly P. Inference of population structure using multilocus genotype data. Genetics. 2000;155(2):945–959.
- Evanno G, Regnaut S, Goudet J. Detecting the number of clusters of individuals using the software structure: a simulation study. Mol Ecol. 2005;14(8):2611–2620.
- Earl DA, vonHoldt BM. STRUCTURE HARVESTER: a website and program for visualizing STRUCTURE output and implementing the Evanno method. Conserv Genet Resour. 2012;4(2):359–361.
- R: The R Project for Statistical Computing [Internet]. [cited 2021 Apr 28]. Available from: https://www.r-project.org/.
- Jost L. G(ST) and its relatives do not measure differentiation. Mol Ecol. 2008;17(18):4015–4026.
- De Beukelaer H, Davenport GF, Fack V. Core Hunter 3: flexible core subset selection. BMC Bioinformatics. 2018;19(1):203
- Taranto F, D’Agostino N, Greco B, et al. Genome-wide SNP discovery and population structure analysis in pepper (Capsicum annuum) using genotyping by sequencing. BMC Genomics. 2016;17(1):943
- Zhang X, Zhang Z, Gu X, et al. Genetic diversity of pepper (Capsicum spp.) germplasm resources in China reflects selection for cultivar types and spatial distribution. J Integ Agricult. 2016;15(9):1991–2001.
- Hernández-Verdugo S, Luna-Reyes R, Oyama K. Genetic structure and differentiation of wild and domesticated populations of Capsicum annuum (Solanaceae) from Mexico. Plant Syst Evol. 2001;226(3-4):129–142.
- Johnson M, Black R. The Wahlund effect and the geographical scale of variation in the intertidal limpet Siphonaria sp. Mar Biol. 1984;79(3):295–302.
- Solomon AM, Han K, Lee J-H, et al. Genetic diversity and population structure of Ethiopian Capsicum germplasms. PLoS One. 2019;14(5):e0216886
- Rivera A, Monteagudo AB, Igartua E, et al. Assessing genetic and phenotypic diversity in pepper (Capsicum annuum L.) landraces from North-West Spain. Sci Hortic. 2016;203:1–11.
- Oyama K, Hernández-Verdugo S, Sánchez C, et al. Genetic structure of wild and domesticated populations of Capsicum annuum (Solanaceae) from Northwestern Mexico analyzed by RAPDs. Genet Resour Crop Evol. 2006;53(3):553–562.
- Andrews J. Diffusion of mesoamerican food complex to Southeastern Europe. Geographical Rev. 1993;83(2):194–204.