
Abstract
As an essential micronutrient, manganese (Mn) participates in diverse processes during plant growth and development. Excess accumulation of Mn in plants is toxic, and soybean (Glycine max) growth and production are severely limited by Mn toxicity. However, the molecular basis in adaptation to Mn toxicity for soybean remains largely unknown. In this study, RNA-seq analysis on soybean leaves was conducted, more than 44 million reads were generated, and a total of 38,022 expressed genes were identified. Compared to control, 2258 differentially expressed genes (DEGs), including 744 up-regulated and 1514 down-regulated ones, were obtained. Cellular process, cell part and binding function were the most enriched terms by GO analysis. Furthermore, 49 DEGs were identified in plant hormone signal transduction pathways by KEGG analysis. Among them, Mn toxicity up-regulated AHK, PIF, JAZ and TGA family DEGs might play important roles in the adaptation of soybean leaves to Mn toxicity.
Supplemental data for this article is available online at https://doi.org/10.1080/13102818.2021.1950566 .
Keywords:
Introduction
Manganese (Mn) is one of the essential trace elements for plants. Mn is an integral component of the Mn-cluster structure, directly involved in plant photosynthesis [Citation1, Citation2]. Mn also acts as the cofactors of multiple enzymes such as superoxide dismutase (SOD), catalase (CAT), phosphoenolpyruvate carboxylase (PEPC) and so on, which are involved in diverse metabolic pathways in plants [Citation3, Citation4]. However, being a heavy metal, excess Mn can be toxic for plants. Mn toxicity seriously affects the growth and development of plants. The major effects of Mn toxicity are destruction of the thylakoid structure of chloroplasts, impairment of the electron transport chain of photosynthesis, leading to the accumulation of reactive oxygen species in leaves [Citation5, Citation6]. Studies have shown that high Mn treatment significantly decreased the photosystem’s electron transfer and the assimilation of carbon dioxide in perennial ryegrass (Lolium perenne) leaves [Citation7]. Mn toxicity can also increase the production of reactive oxygen free radicals and cause oxidative stress [Citation8, Citation9]. Furthermore, the absorption, transportation and distribution of other nutrients including calcium, magnesium and iron can be inhibited by Mn toxicity [Citation10, Citation11]. Mn toxicity has been considered a major factor limiting plant growth and yield, especially in acidic soils that will increase manganese availability [Citation9, Citation12].
Plants have developed some mechanisms to adapt to Mn toxic stress, such as activating the antioxidant system, regulating Mn translocation and distribution, sequestering Mn at the subcellular level, increasing the chelation of Mn through organic acids [Citation13–16]. Recently, several Mn toxicity response genes have been identified and characterized. For example, Fe–SOD, a superoxide dismutase gene, has been reported to contribute to Mn toxicity tolerance in perennial ryegrass [Citation17]. OsMTP8.1 and OsMTP8.2 in rice (Oryza sativa) have been identified as involved in sequestering Mn into vacuoles to adapt to Mn toxicity [Citation18, Citation19]. In Arabidopsis, AtECA1 and AtECA3 have been suggested to deliver excess Mn into the endoplasmic reticulum and Golgi apparatus [Citation20, Citation21]. A stylo (Stylosanthes guianensis) malate dehydrogenase gene, SgMDH1, has also been reported to play an important role in Mn toxicity tolerance by regulating the synthesis of malate to promote the chelation of Mn ion [Citation14].
Soybean is an important oil and protein crop in the world. However, soybean is more sensitive to Mn toxicity, making soybean growth easily affected by Mn toxicity [Citation22–24]. It has been reported that the treatment of 25 μmol/L Mn concentration could significantly decrease the biomass of soybean shoots and roots [Citation24]. Brown spots with chlorotic tissue appearing on leaves are major symptoms that can be observed when soybean plants suffer from Mn toxicity [Citation9, Citation24]. Although the molecular mechanisms for adaptation to Mn toxicity have been reported in model plants Arabidopsis and rice [Citation9, Citation18–21], little information is known on soybean, especially for the key regulators such as transcription factors or plant hormone-related genes.
In the past decade, large-scale omics studies have generated transcriptomes and proteomes data to reveal the mechanisms of plants response to heavy metal toxicity as comprehensively as possible. For example, a total of 31 differentially expressed proteins were identified in response to Mn toxicity in soybean roots through proteomic analysis [Citation24]. Using transcriptome analysis, a total of 2670 cadmium toxicity response genes were obtained in soybean roots [Citation25]. A recent transcriptomic analysis in stylo leaves identified a total of 4094 responsive genes involved in Mn toxicity response [Citation26]. However, transcriptome analysis on soybean response to Mn toxicity is rare. With the developments of second-generation sequencing technology, RNA-seq transcriptome analysis was used in this study to investigate the changes of the whole-genomic gene expression profiles in soybean leaves suffering from Mn toxicity. Our results will provide helpful information and candidate genes to understand the Mn toxicity responsive mechanisms in soybean.
Materials and methods
Plant materials and treatments
The plant material used in this study was soybean with genotype YC03-3. After seeds germination, soybean seedlings were cultured by hydroponics using soybean nutrient solution with two different Mn concentration treatments, 5 (control) or 100 (Mn toxicity) µmol/L MnSO4·H2O as described before [Citation27]. After 15 days of treatment, the soybean leaves were harvested and frozen in liquid nitrogen for further analysis. Each treatment had three separate biological replicates.
RNA-seq analysis
In total, six samples of leaves from control and Mn toxicity treatments were used for performing transcriptome sequencing through RNA-seq technology at Annoroad Gene Technology Company, Beijing, China (http://www.annoroad.com/). The sequencing platform was Illumina HiSeq X Ten with the PE150 program. The used soybean reference genome was Glycine max Williams82.a2.v1 (https://phytozome.jgi.doe.gov/pz/portal.html#!info?alias = Org_Gmax). The gene expression level was expressed by fragments per kilobase of transcript per million reads mapped (FPKM). Differentially expressed genes (DEGs) were identified through DESeq according to the 2-fold or greater change of expression and less than 0.05 of the corrected p-value. The GO functional classification analysis was conducted by the DAVID (Database for Annotation, Visualization and Integrated Discovery) software [Citation28].
qRT-PCR analysis
Plant total RNA was extracted by Trizol reagent (Takara, Japan). The complementary DNA (cDNA) was synthesized using the reverse transcription kit (Promega, USA). Quantitative Real-time polymerase chain reaction (qRT-PCR) was conducted by the Applied Biosystems Steponeplus Real-time PCR system (ABI, USA), and the GmEF-1α (Glyma.17G186600) was used as the internal reference according to an early report [Citation29]. The primers for each gene analyzed by qRT-PCR are listed in .
Table 1. Raw reads and clean reads obtained from soybean leaves based on the RNA-Seq data.
Data analysis
Statistical analysis was performed using Microsoft Excel 2010, and the statistical comparison was performed by Student’s t-test.
Results
Data analysis of RNA-seq
To explore the changes in the gene expression profile in soybean leaves when suffering from Mn toxicity at the whole genome level, RNA-seq technology was used in this study to perform transcriptome sequencing on leaves under control conditions and Mn toxicity treatment, respectively. The sequencing data are shown in . A total of 6718 million and 6883 million bases were obtained by RNA-seq from the control and Mn toxicity samples. Among them, the ratio of quality value greater than 30 (Q30) bases was 92.75% and 93.01% in control and manganese toxicity treatment samples, respectively (). After filtration, the clean bases were 6398 million and 6613 million, among which the Q30 bases accounted for 93.18% and 93.47% in control and Mn toxicity treatment samples, respectively. Corresponding to this, the raw reads number of the control and Mn toxicity treatment samples were about 44,786,923 and 45,884,007 respectively; after removing low-quality reads, high nitrogen content (NS) reads and low-quality reads, the obtained clean reads were 42,652,844 and 44,087,699, respectively, with clean reads rates of 95.18% and 96.10% in control and Mn toxicity treatment samples, respectively ().
Tophat is software specially used for transcriptome data alignment. Its advantage is that it can perform secondary alignment after segmentation of the sequence in the previous alignment, thus identifying the Intron-Exon splicing site. Therefore, in this study, clean data were compared to soybean reference genome through Tophat V2.0.12, and the results are shown in . The results showed that 38,315,622 and 39,806,101 clean reads in the control samples and Mn toxicity samples could be mapped to the reference genome, with mapping rates of 89.83% and 90.29%, respectively. Unmapped rates were 10.17% and 9.71%, and multimap rates were 1.45% and 1.58% in the control and Mn toxicity samples, respectively (). Further analysis showed that the control and Mn toxicity group had unique sequences to the reference exon region, about 20,587,561 (89.95%) and 22,980,325 (89.74%), respectively. The ratio of sequences uniquely matched to the reference intron and intergenic region was relatively low in both the control and the Mn toxicity treatment groups, which was below 6% ().
Figure 1. Mapping region analysis for the clean reads from control and Mn toxicity samples.
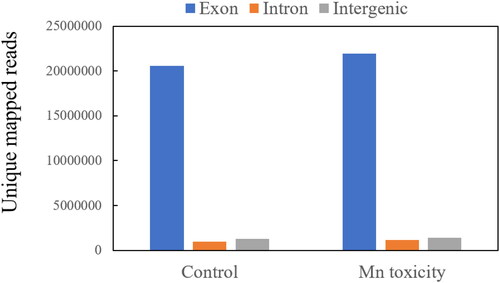
Table 2. Summary statistics for clean reads mapped to soybean reference genome.
DEGs identified in soybean leaves response to Mn toxicity
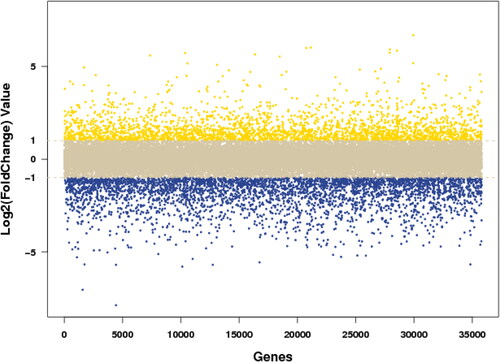
A total of 38,022 expressed genes were identified by RNA-seq, and the differences in the expression levels of the same gene in the leaves of the control plants and the Mn toxicity treatments were analyzed. The genes whose expression levels varied more than twice and were statistically significantly different were defined as DEGs. As shown in , there were a total of 2258 DEGs under Mn toxicity stress, among which, 744 were up-regulated by Mn toxicity treatment (i.e. Log2(Foldchange) >1), and 1514 were down-regulated (Foldchange)<-1) (). Furthermore, 12 genes were up-regulated more than 32 times, and 40 genes were down-regulated more than 32 times under Mn toxicity stress ().
Figure 2. The log2(FoldChange) value distribution scatter plot of the difference comparison between control and Mn toxicity. Fold Change represents the ratio of gene expression value in the control to that in the Mn toxicity treatment. The yellow is the gene with log2(Fold Change) greater than 1, which represents Mn toxicity up-regulated gene; the blue is the gene with log2(Fold Change) less than −1, which represents Mn toxicity down-regulated gene; and the gray is the gene in the middle, which represents not-regulated gene by Mn toxicity.
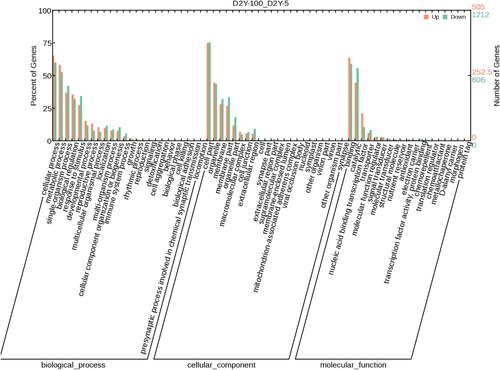
To investigate the functions of the DEGs between control and Mn toxicity treatment, GO enrichment analysis was conducted (). All the DEGs were assigned into three categories, including biological process, cellular component and molecular function. Among the biological process category, the cellular process was the most abundant term, which included 329 up-regulated genes and 725 down-regulated genes, and followed by the metabolic process with 293 up-regulated genes and 637 down-regulated genes (). The cell part was the most abundant term for the cellular component category, which included 378 up-regulated genes and 914 down-regulated genes, followed by organelles with 224 up-regulated genes and 528 down-regulated genes (). In the molecular function category, binding was the most abundant term, including 321 up-regulated genes and 712 down-regulated genes, followed by catalytic with 225 up-regulated genes and 673 down-regulated genes ().
Figure 3. GO Enrichment analysis of the differentially expressed genes.
Plant hormone signal transduction related DEGs involved in Mn toxicity tolerance
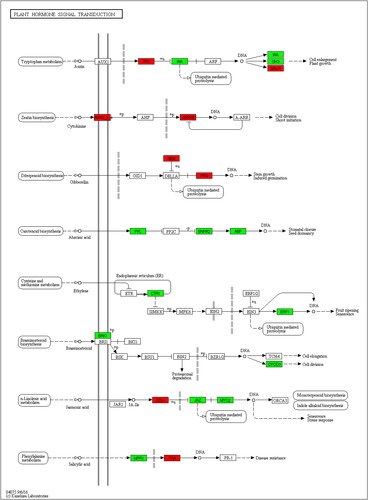
Furthermore, the Kyoto Encyclopedia of Genes and Genomes (KEGG) analysis was conducted to study the changes of the metabolic pathway response to Mn toxicity in soybean leaves. The results showed that a total of 49 DEGs, including 14 upregulated genes and 35 down-regulated genes were involved in 8 plant hormone signal transduction pathways (, ). Among them, there were 17 DEGs including TIR1, IAA, GH3 and SAUR family that are involved in the auxin signal transduction pathway; 17 DEGs including COI, JAZ and MYC family that are involved in jasmonic acid signal transduction pathway; 6 DEGs in the abscisic acid signal transduction pathway including PYL, SNRK and ABF family; 4 DEGs involved in brassinosteroid signaling including BAK and CYCD family; 3 DEGs involved in ethylene signaling including CTR and ERF family; 2 DEGs involved in cytokine signaling including AHK and ARR-B family; and 2 DEGs involved in gibberellin signaling including GID and PIF; and 2 DEGs in the salicylic acid signal transduction pathway including NPR and TGA family (, ).
Figure 4. KEGG analysis of the differentially expressed genes involved in plant hormone signal transduction. The red borders indicated up-regulated expression and the green borders indicated down-regulated expression.
RNA-seq results verified by qRT-PCR
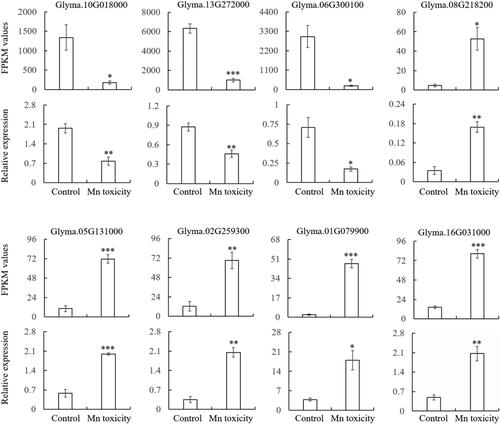
To investigate the accuracy of the RNA-seq, qRT-PCR analysis from eight randomly selected DEGs was conducted (). The expression results of all the eight selected genes including three down-regulated and five up-regulated in response to Mn toxicity were similar temporal patterns with the results of RNA-seq (). Some small variability on the abundance and differential multiples of gene expression may occur because of the different detection methods between qRT-PCR and RNA-seq. These results indicated that the RNA-seq data were reliable.
Figure 5. Validation of RNA-seq results by qRT-PCR. Eight DEGs were randomly selected for qRT-PCR analysis. FPKM values were determined from the RNA-seq. The data were the mean and standard error of three independent biological replicates. The significant difference between control and Mn toxicity was determined by the Student’s t test (*p < 0.05, **p < 0.01, ***p < 0.001).
Discussion
Mn is an essential element for several metabolic pathways in plants [Citation1–4]. On the other hand, plants easily suffer from the toxicity of excess Mn, especially growing on acidic soils [Citation5–9, Citation12]. Thus, it has great significance to excavate the genes that are associated with responses to Mn toxicity and reveal the mechanism of plant adaption to Mn toxicity stress. As an important grain and oil crop, soybean production is severely limited by Mn toxicity. However, the mechanisms for soybean adaptation to Mn toxicity remain largely unknown. In our study, RNA-seq transcriptome analysis was used to explore the differentially expressed genes in soybean leaves in response to Mn toxicity.
In this study, a total of six samples of leaves from normal and Mn toxicity conditions were used for RNA-seq analysis. About 42 million and 44 million clean reads were obtained from the normal conditions leaves and Mn toxicity treatment leaves, respectively, which was similar to previous research in soybean roots which reported about 45 million clean reads obtained through RNA-seq [Citation30]. It has been reported that about 77.31% of clean reads could be aligned to the reference genome on average [Citation31, Citation32]; in our study, more than 89% of clean reads were mapped to the reference genome (). These results suggested that RNA-seq was successful and that the sequencing data were of good quality. Through RNA-seq, a total of 2258 DEGs including 744 up-regulated and 1514 down-regulated ones were identified in response to Mn toxicity (). The RNA-seq technique has also been used on soybean leaves before, and a total of 2016 DEGs were identified in response to simulated acid rain [Citation32]. These results indicated that complex gene regulations exist in soybean leaves for Mn toxicity response.
Plant hormones play key roles in plant growth and abiotic and biotic stresses. Plant hormone signal transduction related genes have been reported in adaptation to environmental stress, such as Arabidopsis AHK1 in drought and salt stress responses [Citation33], maize (Zea mays) ZmPIF3 in drought tolerance [Citation34], OsJAZ8 in salt stress [Citation35], Arabidopsis TGA2/5/6 in antioxidant or detoxifying response to abiotic stress [Citation36], wheat (Triticum aestivum) TaERF3 in salt and drought stresses [Citation37]. In this study, a total of 49 DEGs including AHK, PIF, JAZ and TGA family genes were identified to be involved in plant hormone signal transduction pathways in response to Mn toxicity (, ). These results suggested that the AHK, PIF, JAZ and TGA genes may also be involved in soybean leaves adaptation to Mn toxicity.
Conclusions
In our study, 2258 DEGs were identified in soybean leaves response to Mn toxicity stress by RNA-seq, including 744 up-regulated and 1514 down-regulated DEGs. GO enrichment analysis showed that most of these DEGs were enriched in cellular process, cell part and binding function. A total of 49 DEGs were enriched in plant hormone signal transduction pathways. AHK, PIF, JAZ and TGA family DEGs were suggested to play important roles in soybean leaves adaptation to Mn toxicity.
Disclosure statement
The authors have declared that no competing interests exist.
Funding
This research was funded by the Natural Science Foundation of Guangdong Province (2018A030310057 and 2020A1515011570), Nanhai Youth Scholar Project of Guangdong Ocean University (002029001012), Program for Scientific Research Start-up Funds of Guangdong Ocean University (R17023 and R19031), Foundation of Education Department of Guangdong Province (2019KTSCX059), the Project of Science and Technology of Zhanjiang City (2020B01019), the National Natural Science Foundation of China (32002131).
Data availability statement
The data that support the findings of this study are openly available in Mendeley Data at http://doi.org/10.17632/p4sr6zh84h.1
References
- Goussias C, Boussac A, Rutherford AW. Photosystem II and photosynthetic oxidation of water: an overview. Philos Trans R Soc Lond B Biol Sci. 2002;357(1426):1369–1381; discussion 1419–1420.
- Li P, Song A, Li ZJ, et al. Transcriptome analysis in leaves of rice (Oryza sativa) under high manganese stress. Biologia. 2017;72(4):388–397.
- Chen ZH, Walker RP, Acheson RM, et al. Phosphoenolpyruvate carboxykinase assayed at physiological concentrations of metal ions has a high affinity for CO2. Plant Physiol. 2002;128(1):160–164.
- Ducic T, Polle A. Transport and detoxification of manganese and copper in plants. Braz J Microbiol. 2005;17:103–112.
- Gonzalez A, Steffen KL, Lynch JP. Light and excess manganese. Implications for oxidative stress in common bean. Plant Physiol. 1998;118(2):493–504.
- Lidon FC, Barreiro MG, Ramalho JC. Manganese accumulation in rice: implications for photosynthetic functioning. J Plant Physiol. 2004;161(11):1235–1244.
- Ribera AE, Reyes-Díaz MM, Alberdi MR, et al. Photosynthetic impairment caused by manganese toxicity and associated antioxidative responses in perennial ryegrass. Crop Pasture Sci. 2013;64(7):696–707.
- Shi QH, Zhu ZJ, Xu M, et al. Effect of excess manganese on the antioxidant systemin Cucumis sativus L. under two light intensities. Environ Exp Bot. 2006;58(1-3):197–205.
- Li J, Jia Y, Dong R, et al. Advances in the mechanisms of plant tolerance to manganese toxicity. Int J Mol Sci. 2019; 20(20):5096.
- Lee TJ, Luitel BP, Kang WH. Growth and physiological response to manganese toxicity in Chinese cabbage (Brassica rapa L. ssp. campestris. Hortic Environ Biotechnol. 2011;52(3):252–258.
- Marschner P. Mineral nutrition of higher plants. Boston, MA: Academic Press, 2012.
- Führs H, Behrens C, Gallien S, et al. Physiological and proteomic characterization of manganese sensitivity and tolerance in rice (Oryza sativa) in comparison with barley (Hordeum vulgare). Ann Bot. 2010; 105(7):1129–1140.
- Peiter E, Montanini B, Gobert A, et al. A secretory pathway-localized cation diffusion facilitator confers plant manganese tolerance. Proc Natl Acad Sci USA. 2007;104(20):8532–8537.
- Chen Z, Sun L, Liu P, et al. Malate synthesis and secretion mediated by a manganese-enhanced malate dehydrogenase confers superior manganese tolerance in Stylosanthes guianensis. Plant Physiol. 2015;167(1):176–188.
- Sheng H, Zeng J, Liu Y, et al. Sulfur mediated alleviation of Mn toxicity in polish wheat relates to regulating Mn allocation and improving antioxidant system. Front Plant Sci. 2016;7:1382.
- Yang S, Yi K, Chang MM, et al. Sequestration of Mn into the cell wall contributes to Mn tolerance in sugarcane (Saccharum officinarum L.). Plant Soil. 2019;436(1-2):475–487.
- Ribera-Fonseca A, Inostroza-Blancheteau C, Cartes P, et al. Early induction of Fe-SOD gene expression is involved in tolerance to Mn toxicity in perennial ryegrass. Plant Physiol Biochem. 2013;73:77–82.
- Chen Z, Fujii Y, Yamaji N, et al. Mn tolerance in rice is mediated by MTP8.1, a member of the cation diffusion facilitator family. J Exp Bot. 2013;64(14):4375–4387.
- Takemoto Y, Tsunemitsu Y, Fujii-Kashino M, et al. The tonoplast-localized transporter MTP8.2 contributes to manganese detoxification in the shoots and roots of Oryza sativa L. Plant Cell Physiol. 2017;58(9):1573–1582.
- Wu Z, Liang F, Hong B, et al. An endoplasmic reticulum-bound Ca(2+)/Mn(2+) pump, ECA1, supports plant growth and confers tolerance to Mn(2+) stress. Plant Physiol. 2002;130(1):128–137.
- Sasaki A, Yamaji N, Xia J, et al. OsYSL6 is involved in the detoxification of excess manganese in rice. Plant Physiol. 2011;157(4):1832–1840.
- Andrew CS, Hegarty MP. Comparative responses to manganese excess of eight tropical and four temperate pasture legume species. Aust J Agric Res. 1969;20(4):687–696.
- Yan W, Liu GD, Tian J. Effects of manganese availability on acquisition and distribution of manganese, iron and phosphorus in soybean [Glycine max (L.) Merr.]. Plant Physiol Commun. 2010;46:923–927. (in Chinese)
- Chen Z, Wei Y, Sun L, et al. Proteomic analysis reveals growth inhibition of soybean roots by manganese toxicity is associated with alteration of cell wall structure and lignification. J Proteomics. 2016;143:151–160.
- Zhang XN, Piao CL, Dong YK, et al. [Transcriptome analysis of response to heavy metal Cd stress in soybean root]. Ying Yong Sheng Tai Xue Bao. 2017;28(5):1633–1641.
- Jia Y, Li X, Liu Q, et al. Physiological and transcriptomic analyses reveal the roles of secondary metabolism in the adaptive responses of Stylosanthes to manganese toxicity. BMC Genomics. 2020;21(1):861.
- Liu Y, Xue Y, Xie B, et al. Complex gene regulation between young and old soybean leaves in responses to manganese toxicity. Plant Physiol Biochem. 2020;155:231–242.
- Huang DW, Sherman BT, Lempicki RA. Systematic and integrative analysis of large gene lists using DAVID bioinformatics resources. Nat Protoc. 2009;4(1):44–457.
- Xue YB, Xiao BX, Zhu SN, et al. GmPHR25, a GmPHR member up-regulated by phosphate starvation, controls phosphate homeostasis in soybean. J Exp Bot. 2017;68(17):4951–4967.
- Yin X, Hiraga S, Hajika M, et al. Transcriptomic analysis reveals the flooding tolerant mechanism in flooding tolerant line and abscisic acid treated soybean. Plant Mol Biol. 2017;93(4-5):479–496.
- Schmutz J, Cannon SB, Schlueter J, et al. Genome sequence of the palaeopolyploid soybean. Nature. 2010;463(7278):178–183.
- Yang L, Xu Y, Zhang R, et al. Comprehensive transcriptome profiling of soybean leaves in response to simulated acid rain. Ecotoxicol Environ Saf. 2018;158:18–27.
- Tran LS, Urao T, Qin F, et al. Functional analysis of AHK1/ATHK1 and cytokinin receptor histidine kinases in response to abscisic acid, drought, and salt stress in Arabidopsis. Proc Natl Acad Sci USA. 2007;104(51):20623–20628.
- Gao Y, Wu M, Zhang M, et al. Roles of a maize phytochrome-interacting factors protein ZmPIF3 in regulation of drought stress responses by controlling stomatal closure in transgenic rice without yield penalty. Plant Mol Biol. 2018;97(4-5):311–323.
- Peethambaran PK, Glenz R, Höninger S, et al. Salt-inducible expression of OsJAZ8 improves resilience against salt-stress. BMC Plant Biol. 2018;18(1):311.
- Herrera-Vásquez A, Fonseca A, Ugalde JM, et al. TGA class II transcription factors are essential to restrict oxidative stress in response to UV-B stress in Arabidopsis. J Exp Bot. 2020;72(5):1891–1905.
- Rong W, Qi L, Wang A, et al. The ERF transcription factor TaERF3 promotes tolerance to salt and drought stresses in wheat. Plant Biotechnol J. 2014;12(4):468–479.