
 ?Mathematical formulae have been encoded as MathML and are displayed in this HTML version using MathJax in order to improve their display. Uncheck the box to turn MathJax off. This feature requires Javascript. Click on a formula to zoom.
Abstract
Salt stress is an important factor restricting crop growth. Thus, genes related to plant responses to high salinity at the sprout stage of common bean (Phaseolus vulgaris) should be identified and characterized. In this study, on the basis of the common bean germination index, 0.4% NaCl and day 5 of the incubation period were selected as the optimal salt concentration and sampling time, respectively. Salt-tolerant and salt-sensitive plant materials suitable for the local region were selected as representative common bean materials with contrasting salt-related phenotypes. A total of 441 differentially expressed genes (DEGs) were identified by analyzing the generated RNA-seq data. The enriched Gene Ontology terms and Kyoto Encyclopedia of Genes and Genomes pathways indicated the DEGs were associated with oxidoreductase activities and phenylpropanoid biosynthesis. Furthermore, the superoxide dismutase, peroxidase, and catalase activities and the lignin content, which are related to oxidoreductase activities and phenylpropanoid biosynthesis, were revealed to be significantly associated with common bean salt tolerance. The six DEGs with salt tolerance-related Arabidopsis thaliana homologs may be important candidate genes mediating the salt stress responses of common bean during the sprout stage.
Supplemental data for this article is available online at https://doi.org/10.1080/13102818.2021.1954091 .
Introduction
Salinization is a serious environmental issue. There are more than 800 million hectares of saline–alkaline land worldwide, including approximately 20% of all irrigated land [Citation1], and this is expected to reach approximately 50% in the near future [Citation2]. Salinization is a major abiotic stress factor limiting agricultural productivity. Soil salt stress is different from other abiotic stresses in that it affects germination, and early growth conditions greatly influence later growth. Most plants, such as common bean (Phaseolus vulgaris L.), are sensitive to salt. Because it is an edible crop consumed worldwide, the growth mechanisms of common bean in salinized soil should be investigated. Additionally, salt-tolerant common bean varieties will need to be developed.
Excessive soil salinity decreases the ability of plants to absorb water [Citation3]. Salt stress directly affects plant growth by inhibiting photosynthesis, which is detrimental to the synthesis of nutrients. The severity of the inhibitory effects of salinity increases as the salt concentration increases [Citation4]. Salt stress also inhibits plant growth by altering cell division and extension as well as by shortening the extension time [Citation5]. An exposure to high salinity results in the accumulation of many reactive oxygen species, leading to DNA degradation, membrane lipid peroxidation, membrane junction destruction, and eventually cell death [Citation6]. One of the most serious consequences of salt stress is the increase in cell membrane permeability caused by membrane lipid peroxidation. Catalase (CAT), peroxidase (POD) and superoxide dismutase (SOD) are important antioxidant enzymes in plants that scavenge reactive oxygen species [Citation7]. Plants have diverse defense mechanisms that alleviate the damage caused by salt stress, including the accumulation of some osmotic regulatory substances (e.g. soluble sugars, proline and betaine) [Citation8]. High-throughput methods for studying gene expression profiles are important for determining how plants respond to biotic and abiotic stresses [Citation9,Citation10]. Recently, RNA-sequencing (RNA-seq) data for model plants and important agricultural crops have been used to identify genes involved in stress responses [Citation11–13]. A high-throughput transcriptome assembly was recently initiated for legumes, with some transcriptome-based analyses published for soybean [Citation14], adzuki bean [Citation15] and common bean [Citation16] exposed to abiotic stresses. However, there has been very little research on the sprout stage of common bean under abiotic stress conditions. Combined with the available common bean reference genome sequences [Citation17], an RNA-seq analysis can provide valuable information for identifying and cloning stress tolerance genes, which may be relevant for breeding new salt-tolerant common bean varieties.
Common bean, which is a genetically diverse legume species that originated in Central America, has undergone multiple domestication events, which have contributed to its genomic differentiation [Citation18,Citation19]. The primary objective of this study was to identify genes related to salt tolerance in common bean. The optimal salt concentration to mimic salt stress was established by screening plant responses to six salt concentrations. Additionally, salinity-induced differentially expressed genes (DEGs) in salt-tolerant and salt-sensitive varieties were identified by analyzing the transcriptome sequences. These genes may be salt-related genes with important functions during the common bean sprout stage. Hence, they may be applicable for breeding common bean varieties with enhanced salt tolerance.
Materials and methods
Plant material preparation and NaCl treatment
The seeds of three common bean varieties, Syrian White (A), Jiyin1 (B) and Landrace-60-Day Harvest (C), were randomly selected from the National Engineering Technology Research Center for Coarse Cereals (Daqing, Heilongjiang, China). The seeds were surface-sterilized in 10% NaClO for 0.5 h and then rinsed four times with sterile water before they were subjected to the various treatments. Six NaCl concentrations (0.1%, 0.2%, 0.3%, 0.4%, 0.5% and 0.6%) were selected for treatments (Supplemental Table S1), with water used as the control (CK). Filter paper sheets moistened with the solutions were applied to the common bean seed beds. Each treatment was repeated five times. The seed beds were placed in an incubator set at 28 °C without light for 7 days. The germination rate, germination index and vitality index were calculated using the following equations:
On the basis of the suitable salt concentration determined in the salt-stress system, two locally grown varieties, black common bean (salt-tolerant variety R) and milky common bean (salt-sensitive variety N), were chosen as the representative plant materials exhibiting extreme salt-related phenotypes for the subsequent tests.
Phenotypic examination of salt-tolerant and salt-sensitive materials
The common bean materials R and N treated with water (W) are herein designated as WR and WN, respectively, whereas the materials treated with 0.4% NaCl (S) are herein designated as SR and SN, respectively (Supplemental Table S2). All materials were placed in an incubator set at 28 °C without light for 7 days. The number of germinated seeds was recorded for 7 consecutive days. The germination rate, germination index and vitality index were determined on day 5 of the incubation (sampling time-point). Additionally, the root length, root surface area, root volume and number of lateral roots were determined using a V700 Epson scanner. The images produced by the scanner were processed and analyzed using WinRHIZO Pro (version 2004a) to generate data [Citation20].
RNA-seq analysis
On day 5 of the incubation, three biological replicates of hypocotyls were collected from the WR, WN, SN and SR seedlings. Each sample was immediately frozen in liquid nitrogen and then ground to a powder. Total RNA was extracted from all samples using the method of TRIzol (Transgen, Beijing, China), while the method was as previously described [Citation21]. The RNA quality was assessed by 1% agarose gel electrophoresis and by an analysis using a NanoDrop spectrophotometer [Citation22], which was also used for determining the RNA concentration and purity. High-quality RNA with an OD260/280 of 1.8–2.2 and a 28S/18S ratio ≥ 1.0 were retained for further use. The 2100 Bioanalyzer (Agilent Technologies, Carlsbad, CA, USA) was used to assess RNA integrity. All sequencing samples were rated as A-level, which satisfies the requirements for library construction. The generated libraries were sequenced using the Illumina HiSeq 2500 system (150-bp paired-end reads). The raw data were filtered during a quality control step. More specifically, reads with an N rate > 10% and bases with Q ≤ 20 were eliminated. The remaining high-quality clean reads were used for the subsequent analyses. The P. vulgaris reference genome sequence (PRJNA221782) was obtained from the National Center for Biotechnology Information database. The TopHat2 program was used to align reads to the common bean reference genome [Citation23]. The default parameters of the program were applied, with the exception of the number of acceptable mismatches, which was set to 2. The fragments per kilobase of exon model per million reads mapped (FPKM) value was used to reflect the transcription level [Citation24]. The read count data derived from the analysis of gene expression levels served as the input data for the genes.
Using DESeq [Citation25], |log2(Sample 1/Sample 2)| was set as the criterion for screening DEGs. The read count data were used as the sample data for the genes. Specifically, genes with |log2(fold-change)| > 1 were considered to be DEGs. Heatmaps were constructed using Tbtools [Citation26].
Genes were functionally annotated by screening the Kyoto Encyclopedia of Genes and Genomes (KEGG) (http://www.genome.jp/kegg) and Phytozome (https://phytozome.jgi.doe.gov/pz/portal.html) databases. Gene Ontology (GO) annotations were predicted using the Blast2GO software [Citation27]. Additionally, genes were functionally classified using the WEGO program [Citation28]. The gene coding sequences obtained from the RNA-seq data were compared with those of Arabidopsis thaliana genes in the Phytozome database to identify Arabidopsis thaliana homologs.
Validation of gene expression by quantitative real-time (qRT)-PCR analysis
Nine genes were randomly selected from among the DEGs for a qRT-PCR analysis to verify the accuracy of the RNA-seq data for SN, SR, WN and WR samples. The qRT-PCR primers were designed using Primer Premier (version 6.0) (http://www.premierbiosoft.com/primerdesign/index.html) and are listed in Supplemental Table S3. The common bean PvACTIN-11 gene was selected as the internal reference control [Citation29]. All samples were collected on day 5 of the incubation. Total RNA was extracted using TRIzol, after which residual genomic DNA was removed using the 4 × gDNA Wiper Mix (Vazyme, Nanjing, China). The RNA was converted into single-stranded cDNA using 5 × HiScript II qRT SuperMix II (Vazyme). The qRT-PCR analysis was performed using the LightCycler 480 system (Roche Diagnostics, Switzerland) as previously described [Citation30]. The analysis was completed with three biological replicates. The relative expression levels of the candidate genes were calculated using the following formula [Citation31]:
Physiological parameters used for verifying salt-related phenotypes
The physiological indices of the two common bean varieties treated with water or salt were measured on day 5 of the incubation. Additionally, physiological indicators, including POD, SOD and CAT activities as well as the lignin content, were analyzed using commercially available enzyme-linked immunosorbent assay kits (Kenuodi Biotechnology, Fujian, China) [Citation32].
Data analysis
Data were analyzed using the SPSS 19.0 and R programs. Significant differences were determined on the basis of an ANOVA, with p < 0.05 set as the threshold for significance [Citation33,Citation34].
Results
Determination of the optimal salt treatment
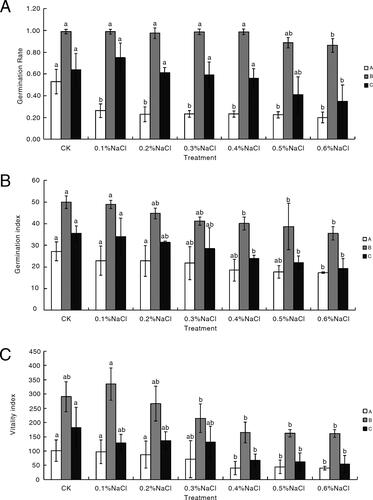
The number of germinated seeds, which indicated the regularity of seed germination, was recorded daily. As the NaCl concentration increased, the germination rates of A and C trended downward, but that of B was not significantly affected (). The germination rate, germination index and vitality index for A, B and C did not change after day 5 of the incubation. Therefore, day 5 was used as the optimal sampling time-point for analyzing physiological and morphological characteristics. In response to the 0.4% NaCl treatment, the seed germination rates of A, B and C had changed. The germination index values were respectively lower for A, B and C than for the control on day 5 of the incubation. The vitality index values of the three varieties on the sampling day were also significantly lower than those of the control (). The 0.4% NaCl treatment significantly inhibited the germination of A and C seeds. It also inhibited the germination of B seeds, but not significantly. Thus, the 0.4% NaCl solution was used to effectively simulate saline environmental conditions.
Figure 1. Variations in the germination rate (A), germination index (B) and vitality index (C) among three common bean varieties under different conditions. White, grey, and black represent P. vulgaris lines A, B and C, respectively. Significant differences are indicated by different lowercase letters (p < 0.05). The letters a and b indicate significant differences, and the differences between bars indicated by letters a and ab, ab and b are not statistically significant.
Phenotypic analysis of common bean materials
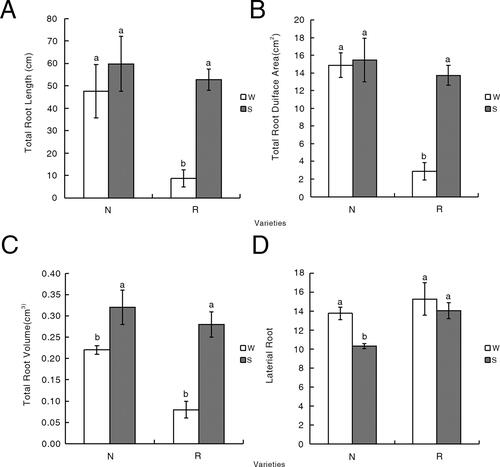
Details regarding the germination of R and N under S and W conditions are presented in . Differences were observable on day 5 of the incubation. The number of germinated seeds for N, but not for R, differed between the W and S conditions on day 5 of the incubation. Regarding the germination rate, the difference between the W and S conditions was greater for N than for R. Additionally, the germination index of N decreased significantly, whereas it was unchanged for R. Salinity stress decreased the vitality index of R, but it remained higher than that of N (). Under salt stress conditions, the total root length of R increased significantly, in contrast to the relatively minor increase in the total root length of N. The total root surface area and volume increased more for R than for N. These results indicate that salt stress promotes root system development, with R better able to resist the harmful effects of high salinity than N, which exhibited minimal changes in response to the salt treatment. Furthermore, an increase in the number of lateral roots is associated with an increase in salt tolerance. Under salt stress conditions, N had significantly fewer lateral roots than R ().
Figure 2. Variations in the germination rates (A), germination indices (B) and vitality indices (C) of two common bean varieties, N and R, under W and S conditions. White represents the water (W) treatment (control), whereas grey represents the salt (S) treatment. Different letters (a, b) indicate statistically significant differences (p < 0.05).
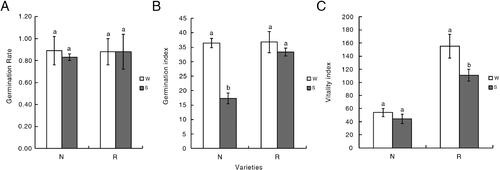
Figure 3. Variations in the total root length (A), total root surface area (B), total root volume(C) and the number of lateral roots (D) during the sprout stages of N and R under W and S conditions. Significant differences are indicated by different lowercase letters (p < 0.05). White represents the water (W) treatment (control), whereas grey represents the salt (S) treatment. Different letters (a, b) indicate statistically significant differences (p < 0.05).
RNA-seq analysis
Raw RNA-seq data were generated for two common bean varieties with contrasting salt-related phenotypes. After filtering, 53.03–40.20 million clean reads remained for all libraries, with Q20 and Q30 values for all raw data exceeding 94% and 87%, respectively. More than 70% of the reads of each sample were aligned to the reference genome sequence, reflecting the quality of the sequenced reads (Supplemental Table S4). The clean RNA-seq data were deposited in the National Center for Biotechnology Information database (accession number PRJNA558376) (http://www.ncbi.nlm.nih.gov/bioproject/).
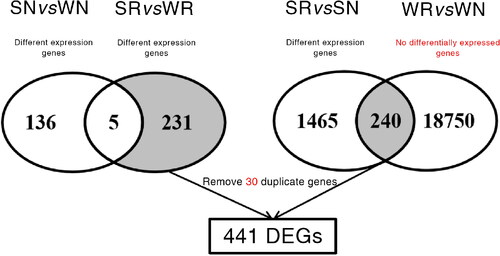
To identify genes related to the salt stress responses of common bean during the sprout stage, the differential expression of genes among samples was analyzed. The DEGs among the four libraries (WN, WR, SR and SN) were identified using the following criteria: |log2(fold-change)| > 1 and a false discovery rate < 0.05. The SR vs WR and SN vs WN comparisons revealed 236 and 141 DEGs, respectively. Of the genes that were differentially expressed between the SR and WR samples, those that were also detected as DEGs in the SN vs WN comparison were removed. The remaining genes may be responsive to salt stress. However, the changes in the expression levels of the latter five DEGs (differentially expressed in SR vs WR and also expressed in SN vs WN) did not appear to have any effect on the responses to salinity. Consequently, 231 genes that were differentially expressed between SR and WR samples, but not between SN and WN samples were selected as candidate DEGs. Additionally, there were 1,705 DEGs in the SR vs SN comparison, 5,825 DEGs in the WR vs WN comparison, and 18,990 genes that were not differentially expressed. The genes that were identified as DEGs in the SR vs SN comparison were not among the DEGs in the WR vs WN comparison, implying that their expression might affect the salt tolerance of common bean. Accordingly, they were selected as candidate DEGs. A total of 441 DEGs (30 duplicated DEGs were eliminated) associated with salt stress responses were selected for further research (). The 30 repeated DEGs will be used as key genes in future experiments. The expression levels of the 441 unique DEGs are presented in . Details regarding their up- and down-regulated expression in each comparison are provided in Supplemental Table S5.
Figure 4. Venn diagrams for the selection of 441 unique DEGs. The comparisons on the left resulted in the selection of 231 DEGs, whereas the comparisons on the right resulted in the selection of 240 DEGs. These DEGs were then combined and 30 duplicated genes were removed to obtain the final set comprising 441 DEGs.
qRT-PCR analysis of RNA-seq data
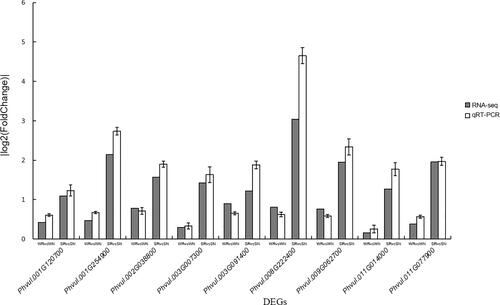
To verify the accuracy of the RNA-seq data, nine of the 441 unique DEGs, differentially expressed in SR vs SN, but not in WR vs WN, were randomly selected for a qRT-PCR analysis. Although there was some variation in their expression levels, their |log2(fold-change)| values were less than 1 for the WN vs WR comparison (i.e. not significant), but greater than 1 for the SR vs SN comparison. The overall variation trends were consistent with the RNA-seq data (). Hence, the RNA-seq results were considered to be accurate.
Figure 5. Results of the qRT-PCR analysis of nine randomly selected DEGs to verify the transcriptome data. The gray squares represent RNA-seq data and the white squares represent qRT-PCR data. The |log2(fold-change)| values > 1 reflect differential gene expression, whereas the |log2(fold-change)| values < 1 reflect a lack of differential gene expression.
Oxidoreductase activity was included among the enriched GO terms
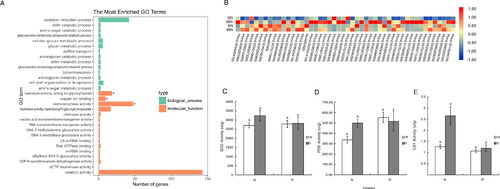
The 441 unique DEGs were functionally characterized by a GO enrichment analysis. The background level represented all genes in the genome annotated with GO terms, and enrichment was determined according to Fisher’s exact test. Of the 30 enriched GO terms revealed by Blast2GO, 14 and 16 belonged to the biological process and molecular function categories. A q-value of less than 0.05 was the threshold for significance. Hydrolase activity, copper ion binding and oxidoreductase activity were among the significantly enriched GO terms (). Oxidoreductase activities were measured to test the results of the GO enrichment analysis. The RNA-seq data revealed the expression levels of the genes annotated with the enriched GO terms varied among the control and salt-treated samples (). An examination of the SOD, POD and CAT activities indicated the differences between the W and S conditions were considerably smaller for R than for N, implying the salt stress did not lead to major physiological changes in R. However, for N, the significant differences in the SOD, POD and CAT activities between the W and S conditions reflected the substantial effects of salt stress. The antioxidant enzyme activities in N were enhanced to limit the damages caused by salt stress ().
Figure 6. Results of the GO enrichment analyses of DEGs. Significant differences are indicated by different lowercase letters (p < 0.05). White and gray squares represent the W and S treatments, respectively. (A) Enriched GO terms among the DEGs. The asterisk indicates significantly enriched terms. (B) Heatmap of the expression of the DEGs annotated with enriched GO terms. Red and blue indicate high and low expression levels, respectively. (C) Variations in SOD activities (oxidoreductase activity). (D) Variations in POD activities (oxidoreductase activity). (E) Variations in CAT activities (oxidoreductase activity).
Phenylpropanoid biosynthesis was included among the enriched KEGG pathways
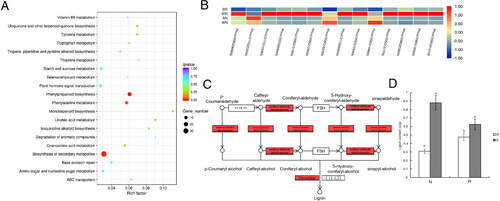
The 441 unique DEGs also underwent a KEGG pathway enrichment analysis. The background level represented all genes assigned to KEGG pathways. Twenty KEGG pathways were enriched among the 441 DEGs. Using a q-value of less than 0.05 as the threshold for significance, ‘phenylpropanoid biosynthesis’ and ‘biosynthesis of secondary metabolites’ were identified as significantly enriched pathways (). The RNA-seq data indicated the genes assigned to the ‘phenylpropanoid biosynthesis’ pathway were differentially expressed among the control and salt-treated samples (). Moreover, many of the DEGs associated with the ‘phenylpropanoid biosynthesis’ pathway contributed to lignin synthesis (). Thus, the lignin contents of N and R under W and S conditions were examined. Although the salt treatment increased the lignin content of both varieties, the increase was 131% in R, whereas it was 284% in N (). Accordingly, the expression levels of the different genes might affect the lignin content.
Figure 7. Results of the KEGG pathway enrichment analyses of DEGs. Significant differences are indicated by different lowercase letters (p < 0.05). White and gray squares represent the W and S treatments, respectively. (A) Enriched KEGG pathways among the DEGs. (B) Heatmap of the expression of the DEGs assigned to enriched KEGG pathways. Red and blue indicate high and low expression levels, respectively. (C) Enzymes in the ‘phenylpropanoid biosynthesis’ KEGG pathway encoded by DEGs. Coniferyl-aldehyde dehydrogenase, cinnamyl-alcohol dehydrogenase, and peroxidase (in red) were DEG-enriched points which may affect the lignin content. (D) Variations in the lignin content in response to the water (W) and salt (S) treatments.
Identification and analysis of candidate genes
All 441 unique DEGs were compared with A. thaliana homologs in the Phytozome database to clarify their functions (Supplemental Table S6). Of the identified A. thaliana homologs, 31 were related to defense, 70 were related to cold, heat and other environmental stresses, 50 were related to redox reactions and 26 were related to salt stress. These 26 genes included six genes that were annotated with enriched GO terms or assigned to enriched KEGG pathways (). Hence, they should be more thoroughly investigated as important candidate genes in future studies.
Table 1. Functional analysis of candidate genes.
Discussion
Common bean, which is an important legume, is the main source of dietary protein in many developing countries. Environmental factors, such as drought [Citation35], salt [Citation36], cold [Citation37] and a lack of phosphorus [Citation38], affect common bean growth. The identification of stress resistance genes has been critical for breeding common bean varieties with enhanced tolerance to drought [Citation19,Citation39,Citation40] and heat [Citation16]. High salinity is an important abiotic stress, and most of the affected regions have mildly or moderately saline soils, especially in China [Citation41]. Salt stress differs from other abiotic stresses (e.g. drought, cold and heat) because plants are already exposed to it during the sprouting period, which is when plants are most susceptible to abiotic stresses [Citation42]. Therefore, there is an urgent need for improving the salt tolerance of common bean during the sprout stage [Citation21]. Radicle length has been used as a physiological indicator of salt-induced damage in the sprout stage of Medicago sativa [Citation43] and Glycyrrhiza uralensis [Citation44]. The root volume is also affected by salt stress. For example, an earlier investigation proved that an exposure to salinity stress can increase the total length, surface area and volume of peanut roots [Citation45]. The number of lateral roots is highly correlated with salt stress tolerance in Brassica napus [Citation46] and rice [Citation47]. In the present study, the salt tolerance phenotypes of two common bean varieties at the sprout stage were determined. The radicle length, radicle surface area, radicle volume and number of lateral roots varied significantly in response to an exposure to salt stress. Hypocotyls have often been used to analyze the effects of high salinity during germination. For example, Rossi [Citation48] reported that the hypocotyl growth rate under saline conditions is correlated with plant salt tolerance. Additionally, some salt stress-related genes also modulate hypocotyl growth [Citation49,Citation50].
Different varieties may exhibit distinct salt tolerance-related traits because of genetic polymorphisms, interactions and mutations [Citation51–54]. These differences have been exploited to identify salt tolerance genes and some salt-related genes during RNA-seq analyses of materials with extreme salinity stress-induced phenotypes. A previous RNA-seq study detected six DEGs between two asparagus bean (Vigna unguiculata) cultivars with contrasting salt-induced phenotypes that were grown under saline and control conditions [Citation55]. In another study, two faba bean varieties with contrasting salt tolerance during the germination stage underwent salt and control treatments to investigate the genome-wide transcription profiles via RNA-seq [Citation56]. Moreover, 13 genes responsive to salinity during the germination stage were revealed by a genome-wide association analysis and the RNA sequencing of 196 upland cotton genotypes [Citation57]. Furthermore, 21 DEGs were detected by an RNA-seq investigation of salt-tolerant and salt-sensitive genotypes exposed to highly saline conditions [Citation58]. In the present study, R (salt-tolerant) and N (salt-sensitive) common bean varieties were compared to identify salt-related genes.
Oxidoreductase activities are crucial for plant responses to abiotic stresses. The fact that oxidoreductase activity was included among the enriched GO terms is consistent with the results of earlier research on Antarctic mosses under salt stress conditions [Citation59] and Caragana korshinskii seedlings [Citation60]. The SOD, POD and CAT activity levels have been applied as physiological indicators of oxidoreductase activity to evaluate plants exposed to salt stress [Citation61–63]. The results of this study indicated that oxidoreductase activities differed substantially between N and R in response to salt stress. More specifically, the SOD, POD and CAT activities changed minimally in R between the W and S conditions, which was in contrast to the significant change in activities in N induced by the S treatment. These findings are in accordance with those reported for salt-stressed grape (Vitis vinifera L.) [Citation64], Kandelia candel [Citation65] and maize (Zea mays) [Citation66]. Genes encoding oxidoreductases can enhance the salt tolerance of plants, including DgWRKY2 in Chrysanthemum [Citation67], TaPRX-2A in wheat (Triticum aestivum)[Citation68] and ZmMYB3R in maize [Citation69]. In this study, Phvul.002G300800, which was annotated with the oxidoreductase activity GO term, was revealed as a homolog of the A. thaliana gene AT5G38710. The expression of AT5G38710 is reportedly up-regulated by salt stress [Citation70]. We observed that Phvul.002G300800 expression levels differed significantly between SR and SN, but not between WR and WN, implying that this gene might influence salt tolerance. Accordingly, further analyses of this potentially important candidate gene are warranted.
Phenylpropanoid biosynthesis is closely associated with plant responses to abiotic stresses, especially excessive salinity. Several studies revealed that the phenylpropanoid biosynthesis pathway is important for the salt tolerance of diverse plant species such as bread wheat [Citation71], garlic [Citation72], strawberry [Citation73] and date palm (Phoenix dactylifera L.) [Citation74]. In this study, ‘phenylpropanoid biosynthesis’ was an enriched KEGG pathway among the DEGs, including those associated with cinnamyl-alcohol dehydrogenase, coniferyl-aldehyde dehydrogenase, and POD, all of which affect lignin synthesis. There were significant differences in the lignin contents of the two common bean varieties examined in this study. Lignin in the phenylpropanoid biosynthesis pathway reportedly affects salt stress responses [Citation75]. Kong [Citation73] suggested that lignin accumulation might play an important role in the adaptation of plants to salt stress. Some genes related to lignin synthesis or phenylpropane synthesis might influence the salt tolerance of plants [Citation76]. A lignin synthesis gene, CCoAOMT1, which encodes a protein with functions affecting lignin biosynthesis related to plant salt tolerance, was identified in A. thaliana, and mutations to this gene substantially increase the susceptibility of plants to salt stress [Citation76]. In apple, MdSND1, which participates in signal transductions in response to high salt concentrations, may contribute to lignin synthesis, thereby enhancing stress tolerance [Citation77]. In celery, AgNAC1, which is a transcription factor gene, helps mediate lignin biosynthesis and salt tolerance [Citation78]. In this study, the phenylpropanoid biosynthesis pathway-related genes that had A. thaliana homologs with known salt stress-associated functions were selected as candidate genes. These genes included Phvul.011G105900, which is a homolog of the A. thaliana cationic POD-encoding gene (AT5G44640) implicated in the lignin and suberin deposition in root tissues in response to osmotic-related stresses. The overexpression of AT5G44640 increases A. thaliana salt tolerance, whereas silencing this gene has the opposite effect [Citation79]. Furthermore, Phvul.011G202000, Phvul.011G056000, Phvul.005G151800 and Phvul.005G151700 were revealed as homologs of A. thaliana genes with functions related to salt stress responses, as determined by phylogenetic-based functional annotations [Citation80].
Conclusions
In this study, a 0.4% NaCl treatment effectively simulated the moderately saline environments common bean is often exposed to. A total of 441 unique DEGs were identified following an RNA-seq analysis of two P. vulgaris varieties with contrasting tolerance to high salinity. The accuracy of the data was verified by qRT-PCR. The functional characterization of the DEGs revealed that many of them encode proteins with oxidoreductase activities and functions that contribute to the phenylpropanoid biosynthesis pathway. Moreover, SOD, POD and CAT activities as well as lignin contents, which are associated with oxidoreductase activities and phenylpropanoid biosynthesis, were analyzed. Arabidopsis thaliana homologs were identified for six genes annotated with enriched GO terms or belonging to enriched KEGG pathways. Whether these genes mediate salt tolerance will need to be more comprehensively investigated in common bean, especially during the sprout stage. Nevertheless, the data presented herein may be relevant for future crop improvements and the breeding of salt-tolerant common bean varieties.
Author contributions
Z.Q., L.M. C-Y.X and J-D.D designed and managed the experiments. W-J.Z., Z-G.Y., Y-L.Z. and H.Z. provided the plant lines. Y-C.L., M-Y.Z, Q-X.F. and W-H.Z. performed the trials, collected data, completed the statistical analyses of the phenotypic data and wrote the paper. Z.Q. L.M. W-H.Z. Y-L.D and J-D.D all contributed to writing the paper.
| Abbreviations | ||
| CK | = | cytokinin |
| RT-qPCR | = | Real-time quantitative PCR |
| QC | = | quality control |
| Q20 | = | represents a 1% probability of base detection errors |
| Q30 | = | represents a 1‰ probability of base detection errors |
| DEG | = | differentially expressed gene |
| GO | = | Gene Ontology |
| KEGG | = | Kyoto Encyclopedia of Genes and Genomes |
| SOD | = | superoxide dismutase |
| POD | = | peroxidase |
| CAT | = | catalase |
Acknowledgement
We thank the financial support by Heilongjiang Bayi Agricultural University (XDB2011-02)
Disclosure statement
No conflicts of interest.
Data availability statement
All data that support the findings reported in this study are available from the corresponding authors upon reasonable request.
Supplemental data
The following are available online. Table S1: Treatment numbers and reagents present in the salt-stress system used to analyze common bean; Table S2: Varieties having opposing phenotypic traits and treatment methods; Table S3: Quantitative real-time PCR primer design; Table S4: Raw transcriptome data quality analysis; Table S5: Comparisons of DEGs between different treatments; Table S6: Functional analysis of DEGs among Arabidopsis homologs; Table S7: The 26 candidate genes related to salt stress in sprout stage; : The variation among the germination numbers of three common bean varieties (A, B and C) treated with different NaCl concentrations; : The dynamic variation in germination numbers between the two common bean varieties N and R; : Analysis of the expression levels of 441 DEGs using a heatmap analysis.
Additional information
Funding
References
- Munns R, Tester M. Mechanisms of salinity tolerance. Annu Rev Plant Biol. 2008;59:651–681.
- Mahajan S, Tuteja N. Cold, salinity and drought stresses: an overview. Arch Biochem Biophys. 2005;444(2):139–158.
- Mäser P, Eckelman B, Vaidyanathan R, et al. Altered shoot/root Na + distribution and bifurcating salt sensitivity in Arabidopsis by genetic disruption of the Na + transporter AtHKT1. FEBS Lett. 2002;531(2):157–161.
- Munns R. Physiological processes limiting plant growth in saline soils: some dogmas and hypotheses. Plant Cell Environ. 1993;16(1):15–24.
- Royce TE, Rozowsky JS, Gerstein MB. Toward a universal microarray: prediction of gene expression through nearest-neighbor probe sequence identification. Nucleic Acids Res. 2007;35(15):e99.
- Evans MJ, Choi WG, Gilroy S, et al. A ROS-assisted calcium wave dependent on the AtRBOHD NADPH oxidase and TPC1 cation channel propagates the systemic response to salt stress. Plant Physiol. 2016;171(3):1771–1784.
- Roxas VP, Lodhi SA, Garrett DK, et al. Stress tolerance in transgenic tobacco seedlings that overexpress glutathione S-transferase/glutathione peroxidase. Plant Cell Physiol. 2000;41(11):1229–1234.
- Qi W, Zhang L, Xu H, et al. Physiological and molecular characterization of the enhanced salt tolerance induced by low-dose gamma irradiation in Arabidopsis seedlings. Biochem Biophys Res Commun. 2014;450(2):1010–1015.
- Postnikova OA, Shao J, Nemchinov LG. Analysis of the alfalfa root transcriptome in response to salinity stress. Plant Cell Physiol. 2013;54(7):1041–1055.
- Xu P, Liu Z, Fan X, et al. De novo transcriptome sequencing and comparative analysis of differentially expressed genes in Gossypium aridum under salt stress. Gene. 2013;525(1):26–34.
- Parra-González LB, Aravena-Abarzúa GA, Navarro-Navarro CS, et al. Yellow lupin (Lupinus luteus L.) transcriptome sequencing: molecular marker development and comparative studies. BMC Genomics. 2012; 13:425.
- Wu N, Matand K, Wu H, et al. De novo next-generation sequencing, assembling and annotation of Arachis hypogaea L. Spanish botanical type whole plant transcriptome. Theor Appl Genet. 2013;126(5):1145–1149.
- Teshome A, Byrne SL, Didion T, et al. Transcriptome sequencing of Festulolium accessions under salt stress. BMC Res Notes. 2019;12(1):311.
- Zhao L, Cui J, Cai Y, et al. Comparative transcriptome analysis of two contrasting soybean varieties in response to aluminum toxicity. IJMS. 2020;21(12):4316.
- Li WY, Wang C, Shi HH, et al. Genome-wide analysis of ethylene-response factor family in adzuki bean and functional determination of VaERF3 under saline-alkaline stress. Plant Physiol Biochem. 2020;147:215–222.
- López-Hernández F, Cortés AJ. Last-generation genome-environment associations reveal the genetic basis of heat tolerance in common bean (Phaseolus vulgaris L.). Front Genet. 2019; 10:954.
- Schmutz J, McClean PE, Mamidi S, et al. A reference genome for common bean and genome-wide analysis of dual domestications. Nat Genet. 2014;46(7):707–713.
- Blair MW, Soler A, Cortés AJ. Diversification and population structure in common beans (Phaseolus vulgaris L.). PloS One. 2012;7(11):e49488.
- Cortés AJ, Skeen P, Blair MW, et al. Does the genomic landscape of species divergence in Phaseolus beans coerce parallel signatures of adaptation and domestication?Front Plant Sci. 2018; 9:1816.
- Matney JE, Parker BC, Neck DW, et al. Evaluation of a commercial flatbed document scanner and radiographic film scanner for radiochromic EBT film dosimetry. J Appl Clin Med Phys. 2010;11(2):3165.
- Zhang Q, Zhang WJ, Yin ZG, et al. Genome- and transcriptome-wide identification of C3Hs in common bean (Phaseolus vulgaris L.) and structural and expression-based analyses of their functions during the sprout stage under salt-stress conditions. Front Genet. 2020; 11:564607.
- Desjardins P, Conklin D. NanoDrop microvolume quantitation of nucleic acids. JoVE. 2010;(45):2565.
- Kim D, Pertea G, Trapnell C, et al. TopHat2: accurate alignment of transcriptomes in the presence of insertions, deletions and gene fusions. Genome Biol. 2013a;14(4):R36.
- Trapnell C, Williams BA, Pertea G, et al. Transcript assembly and quantification by RNA-Seq reveals unannotated transcripts and isoform switching during cell differentiation. Nat Biotechnol. 2010;28(5):511–515.
- Anders S, Huber W. Differential expression analysis for sequence count data. Genome Biol. 2010;11(10):R106.
- Chen C, Chen H, Zhang Y, et al. TBtools: an integrative toolkit developed for interactive analyses of big biological data. Mol Plant. 2020;13(8):1194–1202.
- Conesa A, Götz S, García-Gómez JM, et al. Blast2GO: a universal tool for annotation, visualization and analysis in functional genomics research. Bioinformatics. 2005;21(18):3674–3676.
- Ye J, Fang L, Zheng H, et al. WEGO: a web tool for plotting GO annotations. Nucleic Acids Res. 2006;34(Web Server issue):W293–W297.
- Borges A, Tsai SM, Caldas DG. Validation of reference genes for RT-qPCR normalization in common bean during biotic and abiotic stresses. Plant Cell Rep. 2012;31(5):827–838.
- Zhao Y, Cui Y, Huang S, et al. Genome-wide analysis of the glucose-6-phosphate dehydrogenase family in soybean and functional identification of GmG6PDH2 involvement in salt stress. Front Plant Sci. 2020;11:214.
- Lopez-Molina L, Mongrand S, Chua NH. A postgermination developmental arrest checkpoint is mediated by abscisic acid and requires the ABI5 transcription factor in Arabidopsis. Proc Natl Acad Sci USA. 2001;98(8):4782–4787.
- Li M, Zhang K, Sun Y, et al. Growth, physiology, and transcriptional analysis of two contrasting Carex rigescens genotypes under salt stress reveals salt-tolerance mechanisms. J Plant Physiol. 2018;229:77–88.
- Mian MA, Hossain J. Nitrogen level and physiological basis of yield of mungbean at varying plant population in High Ganges River Flood Plain soil of Bangladesh. Pak J Biol Sci. 2014;17(7):925–930.
- Chan BKC. Data analysis using R programming. Adv Exp Med Bio. 2018;1082:47–122.
- Pereira WJ, Melo ATO, Coelho ASG, et al. Genome-wide analysis of the transcriptional response to drought stress in root and leaf of common bean. Genet Mol Biol. 2020;43(1):e20180259.
- Hiz MC, Canher B, Niron H, et al. Transcriptome analysis of salt tolerant common bean (Phaseolus vulgaris L.) under saline conditions. PLoS One. 2014;9(3):e92598.
- Badowiec A, Weidner S. Proteomic changes in the roots of germinating Phaseolus vulgaris seeds in response to chilling stress and post-stress recovery. J Plant Physiol. 2014;171(6):389–398.
- Silva DAD, Tsai SM, Chiorato AF, et al. Analysis of the common bean (Phaseolus vulgaris L.) transcriptome regarding efficiency of phosphorus use. PLoS One. 2019;14(1):e0210428.
- Cortés AJ, This D, Chavarro C, et al. Nucleotide diversity patterns at the drought-related DREB2 encoding genes in wild and cultivated common bean (Phaseolus vulgaris L.). Theor Appl Genet. 2012;125(5):1069–1085.
- Blair MW, Cortés AJ, This D. Identification of an ERECTA gene and its drought adaptation associations with wild and cultivated common bean. Plant Sci. 2016;242:250–259.
- Yang H, Chen Y, Zhang F. Evaluation of comprehensive improvement for mild and moderate soil salinization in arid zone. PLoS One. 2019;14(11):e0224790.
- Ibrahim EA. Seed priming to alleviate salinity stress in germinating seeds. J Plant Physiol. 2016;192:38–46.
- Johnson DW, Smith SE, Dobrenz AK. Genetic and phenotypic relationships in response to NaCl at different developmental stages in alfalfa. Theor Appl Genet. 1992;83(6–7):833–838.
- Zhang W, Xie Z, Wang L, et al. Silicon alleviates salt and drought stress of Glycyrrhiza uralensis seedling by altering antioxidant metabolism and osmotic adjustment. J Plant Res. 2017;130(3):611–624.
- Tian S, Guo R, Zou X, et al. Priming with the green leaf volatile (Z)-3-hexeny-1-yl acetate enhances salinity stress tolerance in peanut (Arachis hypogaea L.) seedlings. Front Plant Sci. 2019; 10:785.
- Arif MR, Islam MT, Robin AHK. Salinity stress alters root morphology and root hair traits in Brassica napus. Plants (Basel, Switzerland). 2019;8(7):192.
- Liu AL, Zou J, Liu CF, et al. Over-expression of OsHsfA7 enhanced salt and drought tolerance in transgenic rice. BMB Rep. 2013;46(1):31–36.
- Rossi L, Borghi M, Francini A, et al. Salt stress induces differential regulation of the phenylpropanoid pathway in Olea europaea cultivars Frantoio (salt-tolerant) and Leccino (salt-sensitive). J Plant Physiol. 2016;204:8–15.
- Kovinich N, Wang Y, Adegboye J, et al. Arabidopsis MATE45 antagonizes local abscisic acid signaling to mediate development and abiotic stress responses. Plant Direct. 2018;2(10):e00087.
- Liu C, Wang B, Li Z, et al. TsNAC1 is a key transcription factor in abiotic stress resistance and growth. Plant Physiol. 2018;176(1):742–756.
- Cortés AJ, Chavarro MC, Blair MW. SNP marker diversity in common bean (Phaseolus vulgaris L.). Theor Appl Genet. 2011;123(5):827–845.
- Galeano CH, Cortés AJ, Fernández AC, et al. Gene-based single nucleotide polymorphism markers for genetic and association mapping in common bean. BMC Genet. 2012;13:48.
- Blair MW, Cortés AJ, Penmetsa RV, et al. A high-throughput SNP marker system for parental polymorphism screening, and diversity analysis in common bean (Phaseolus vulgaris L.). Theor Appl Genet. 2013;126(2):535–548.
- Blair MW, Cortés AJ, Farmer AD, et al. Uneven recombination rate and linkage disequilibrium across a reference SNP map for common bean (Phaseolus vulgaris L.). PLoS One. 2018;13(3):e0189597.
- Pan L, Yu X, Shao J, et al. Transcriptomic profiling and analysis of differentially expressed genes in asparagus bean (Vigna unguiculata ssp. sesquipedalis) under salt stress. PLoS One. 2019;14(7):e0219799.
- Yang F, Chen H, Liu C, et al. Transcriptome profile analysis of two Vicia faba cultivars with contrasting salinity tolerance during seed germination. Sci Rep. 2020;10(1):7250.
- Yuan Y, Xing H, Zeng W, et al. Genome-wide association and differential expression analysis of salt tolerance in Gossypium hirsutum L at the germination stage. BMC Plant Biol. 2019;19(1):394.
- Shi P, Gu M. Transcriptome analysis and differential gene expression profiling of two contrasting quinoa genotypes in response to salt stress. BMC Plant Biol. 2020;20(1):568.
- Zhang W, Liu S, Li C, et al. Transcriptome sequencing of Antarctic moss under salt stress emphasizes the important roles of the ROS-scavenging system. Gene. 2019;696:122–134.
- Li S, Fan C, Li Y, et al. Effects of drought and salt-stresses on gene expression in Caragana korshinskii seedlings revealed by RNA-seq. BMC Genomics. 2016;17:200.
- Diaz-Vivancos P, Faize M, Barba-Espin G, et al. Ectopic expression of cytosolic superoxide dismutase and ascorbate peroxidase leads to salt stress tolerance in transgenic plums. Plant Biotechnol J. 2013;11(8):976–985.
- Arias-Moreno DM, Jiménez-Bremont JF, Maruri-López I, et al. Effects of catalase on chloroplast arrangement in Opuntia streptacantha chlorenchyma cells under salt stress. Sci Rep. 2017;7(1):8656.
- Hamooh BT, Sattar FA, Wellman G, et al. Metabolomic and biochemical analysis of two potato (Solanum tuberosum L.) cultivars exposed to in vitro osmotic and salt stresses. Plants (Basel, Switzerland). 2021;10(1):98.
- Guan L, Haider MS, Khan N, et al. Transcriptome sequence analysis elaborates a complex defensive mechanism of grapevine (Vitis vinifera L.) in response to salt stress. IJMS. 2018;19(12):4019.
- Wang HM, Xiao XR, Yang MY, et al. Effects of salt stress on antioxidant defense system in the root of Kandelia candel. Bot Stud. 2014;55(1):57.
- Wang M, Wang Y, Zhang Y, et al. Comparative transcriptome analysis of salt-sensitive and salt-tolerant maize reveals potential mechanisms to enhance salt resistance. Genes Genomics. 2019;41(7):781–801.
- He L, Wu YH, Zhao Q, et al. Chrysanthemum DgWRKY2 gene enhances tolerance to salt stress in transgenic Chrysanthemum. IJMS. 2018;19(7):2062.
- Su P, Yan J, Li W, et al. A member of wheat class III peroxidase gene family, TaPRX-2A, enhanced the tolerance of salt stress. BMC Plant Biol. 2020;20(1):392.
- Wu J, Jiang Y, Liang Y, et al. Expression of the maize MYB transcription factor ZmMYB3R enhances drought and salt stress tolerance in transgenic plants. Plant Physiol Biochem. 2019; 137:179–188.
- Funck D, Eckard S, Müller G. Non-redundant functions of two proline dehydrogenase isoforms in Arabidopsis. BMC Plant Biol. 2010; 10:70.
- Amirbakhtiar N, Ismaili A, Ghaffari MR, et al. Transcriptome response of roots to salt stress in a salinity-tolerant bread wheat cultivar. PLoS One. 2019;14(3):e0213305.
- Kong Q, Mostafa HHA, Yang W, et al. Comparative transcriptome profiling reveals that brassinosteroid-mediated lignification plays an important role in garlic adaption to salt stress. Plant Physiol Biochem. 2021;158:34–42.
- Crizel RL, Perin EC, Siebeneichler TJ, et al. Abscisic acid and stress induced by salt: effect on the phenylpropanoid, L-ascorbic acid and abscisic acid metabolism of strawberry fruits. Plant Physiol Biochem. 2020;152:211–220.
- Yaish MW, Patankar HV, Assaha DVM, et al. Genome-wide expression profiling in leaves and roots of date palm (Phoenix dactylifera L.) exposed to salinity. BMC Genomics. 2017;18(1):246.
- Vanholme R, De Meester B, Ralph J, et al. Lignin biosynthesis and its integration into metabolism. Curr Opin Biotechnol. 2019;56:230–239.
- Chun HJ, Baek D, Cho HM, et al. Lignin biosynthesis genes play critical roles in the adaptation of Arabidopsis plants to high-salt stress. Plant Signal Behav. 2019;14(8):1625697.
- Chen K, Guo Y, Song M, et al. Dual role of MdSND1 in the biosynthesis of lignin and in signal transduction in response to salt and osmotic stress in apple. Hortic Res. 2020;7(1):204.
- Duan AQ, Tao JP, Jia LL, et al. AgNAC1, a celery transcription factor, related to regulation on lignin biosynthesis and salt tolerance. Genomics. 2020;112(6):5254–5264.
- Llorente F, López-Cobollo RM, Catalá R, et al. A novel cold-inducible gene from Arabidopsis, RCI3, encodes a peroxidase that constitutes a component for stress tolerance. Plant J. 2002;32(1):13–24.
- Gaudet P, Livstone MS, Lewis SE, et al. Phylogenetic-based propagation of functional annotations within the gene ontology consortium. Brief Bioinform. 2011;12(5):449–462.