
Abstract
This study aimed to characterize and compare the latest generation multi-force Bio-active™ orthodontic archwires to determine if there is a change in their physicochemical and mechanical properties during orthodontic treatment. The physicochemical characterization of the archwires was done by X-ray diffraction (XRD), scanning electron microscopy, energy-dispersive X-ray spectroscopy and laser-induced breakdown spectroscopy. A modified dynamic nanoindentation method with depth control was used to determine the mechanical properties. Statistical analysis was done by one-way analysis of variance (ANOVA). The XRD analysis showed that all investigated archwires are made of Ni-Ti alloy with an austenite crystal structure. The surface roughness of the Bio-active™ wires decreases after clinical use. The elemental composition analysis showed that the weight percentage of nickel and titanium is approximately 55 wt.% and 45 wt.%, respectively, and traces of Fe and Cr were registered in some regions. The results from nanoindentation experiments showed that the indentation hardness in the bicuspid part of archwires used for six weeks decreases by about 154%, and the indentation modulus decreases by about 44% compared to as received archwires, probably due to the changes in the morphology. Statistically significant differences in the chemical content are found for the anterior and bicuspid regions, while in the mechanical properties, for the bicuspid and posterior regions of the investigated archwires. The obtained results give orthodontists important information about the physicochemical and mechanical properties of the Bio-active™ multi-force archwires during their clinical use.
Introduction
Multi-force orthodontic archwires, with three zones of elasticity (three distinct thermally activated regions with different force release), have been commercially available for more than 20 years [Citation1]. Still, with time the manufacturing technology evolves, improving the quality of the archwires. The Bio-active™ orthodontic archwires are the latest generation of multi-force orthodontic archwires made of Ni-Ti alloy. The GC Orthodontics manufacturer offers Bio-active™ archwires with dimensions of 0.016 × 0.016; 0.016 × 0.022; 0.018 × 0.018 and 0.021 × 0.022 inch [Citation2], which allows orthodontists to begin a patient’s treatment with larger diameter archwires for better control of the buccal-lingual position of the front teeth. The Bio-active™ archwires have biomechanical properties (force, superelasticity and shape memory), like heat-activated archwires. The Bio-active™ shape memory archwire exerts progressive forces from the midline to the posterior sectors [Citation2].
The change in the modulus of elasticity and the different transition temperature range (TTR) in the three regions (lowest in the frontal area, increasing at the premolar and highest at the molar) is achieved by specific heat treatment in the particular regions of the archwire. That results in a variable force release along its length without changing the cross-section size [Citation3]. The TTR for Ni-Ti alloys can be set sufficiently narrow to take advantage of these phase conversions (martensite to austenite and vice versa) in orthodontic treatments. This range can be lowered by varying the nickel/titanium ratio or adding small amounts of other elements [Citation4, Citation5]. Thus, the elemental composition influences the properties of the orthodontic archwires. However, traces or small amounts of additional elements to the orthodontic archwires’ elemental composition might lead to allergies in some patients [Citation6, Citation7]. Therefore, the knowledge of the elemental composition is critical.
On the other hand, the biofilm formation and topographic surface of aesthetic Bio-activeTM RC wire [Citation8] and the mechanical properties of as received Bio-activeTM archwires [Citation9] have been investigated. However, the abovementioned studies focus on as received archwires, and we did not find information about clinically retrieved such. That is why the present work aimed to characterize and compare as received and clinically retrieved Bio-active™ multi-force archwires and see if there is any change in their microstructure, elemental composition and mechanical properties, which would be a helpful guide for orthodontists to choose the most suitable duration of archwire use depending on the particular treatment goals and patient’s needs.
Materials and methods
Ethics statement
The clinical procedures were carried out according to the guidelines of the World Medical Association’s Declaration of Helsinki and the Ministry of Health for Good Clinical Practice, and informed consent for testing the archwires was obtained from the patients.
Materials
As received and clinically retrieved for six and nine weeks Bio-active™, upper orthodontic archwires with dimensions of 0.016 × 0.022 inch, produced by GC Orthodontics, were investigated. The archwires have three zones of elasticity, respectively, anterior (ant.), bicuspid (bic.) and posterior (post.). Each as received archwire was single packed in an airtight plastic bag. There are ten individually wrapped archwires from one production batch (REF 70-A0U0-1622; LOT K359). All clinically retrieved wires were collected from patients with upper anterior crowding treated in the Department of Orthodontics, Medical University in Sofia, Bulgaria, and the wires’ characterization was performed with no direct patient participation in laboratory conditions. The clinically retrieved archwires were placed in a disinfectant bath for 30 min and then cleaned with a cotton swab moistened with a 95% alcoholic solution to remove any deposits and food. The archwires were cut at the three respective segments (ant., bic., post.) and each specimen was placed in a re-sealable plastic bag with its datasheet.
X-ray diffraction (XRD)
The crystalline structure was assessed by powder diffraction, on a D8-Advance, Bruker powder diffractometer with a Cu-Kα target, within the range from 5–80° 2θ at a constant step of 0.02° 2θ, at room temperature.
Scanning electron microscopy/energy dispersive X-ray spectroscopy
The surface morphology and the elemental composition were studied by ZEISS FE-SEM Ultra 55 scanning electron microscope (SEM) with 20 kV acceleration voltage for the conventional observation measurements. In the vacuum chamber of the SEM apparatus, specimens of each region of each orthodontic wire were mounted on pin stubs. For the optimization of the quality of the micrographs, the accelerating voltage, angle of fit and aperture were adjusted. The cross-section and the surface were scanned and viewed on the monitor at different magnifications, and representative micrographs of each wire’s regions were obtained. Energy-dispersive analysis (X-ray dispersive analysis (EDS)) method with Bruker Esprit 1.82 system was used to quantify the elemental composition of the archwires. The accelerating voltage used for the qualitative and quantitative elemental analyses was 20 kV. For the SEM and EDS analysis of the cross-section of the specimens, an etching process was required in order to get clear images and exact results. ImageJ software was used for analysis. The samples were prepared under the same conditions, using Kroll’s reagent (1HF + 2HNO3+50H2O) [Citation10].
Laser-induced breakdown spectroscopy
A laser-induced breakdown spectroscopy (LIBS) detection system LIBSCAN25+ was used for obtaining the LIBS spectra of the samples. The system contains a high-power (50 mJ) Q-switched Nd:YAG pulsed laser, which was operated at 1064 nm with 5 ns pulse length and 1 Hz pulse repetition rate. The laser beam was focused onto the sample, and the excited LIBS signal was registered with a time delay of 1.25 μs after the laser pulse by the appropriate lateral lens system. The experimental console contains four spectrometers covering the spectral range of 185–785 nm with 0.01 nm resolution. The setting of the recording equipment and the visualization of the registered spectra was done with LIBSoft V8.2.0 special software.
Nanoindentation experiments
Experiments of dynamic nanoindentation according to ISO 14577 standard were made, using Nanoindenter G200 (KLA Corporation, USA), equipped with Dynamic Contact Module (DCM II), fitted with a Berkovich indenter tip with 20 nm radius. We used the indentation method with depth control (so-called ‘XP/G-Series Basic Hardness, Modulus at a Depth’). Because of the samples’ high roughness, the indenter had problems detecting the surface, which is why we modified the original method by increasing the surface approach distance from 1000 nm to 5000 nm and increased the maximum segment time from 1000 s to 3000 s. Fifteen indentation tests (1 loading-unloading cycle, depth limit =500 nm) were performed on each sample. The Input parameters for the nanoindentation experiments are shown in .
Table 1. Input parameters for the nanoindentation experiments.
Statistical analysis
For each segment of the wire (anterior, bicuspid and posterior), we compared the quantitative measurements of the Nickel/Titanium Content, Indentation Modulus and Indentation Hardness for the three separated groups (as received, used for six weeks and used for nine weeks). The non-parametric Kruskal-Wallis one-way analysis of variance (ANOVA) test was used for analyzing the statistical distributions of the values obtained from the quantitative measures. The significance level of the differences between the groups was determined by the performance of multi-variance comparison based on the ANOVA test statistics, using Mann-Whitney multiple comparative tests, Bonferroni corrected for group comparison. Differences were considered statistically significant if they reached a confidence level higher than 95% (p < 0.05).
Results and discussion
XRD results
The XRD patterns of all investigated archwires were identical in all three regions. Thus, a representative XRD pattern was chosen and presented in .
Figure 1. XRD pattern of as received and clinically retrieved Bio-active™ archwires.
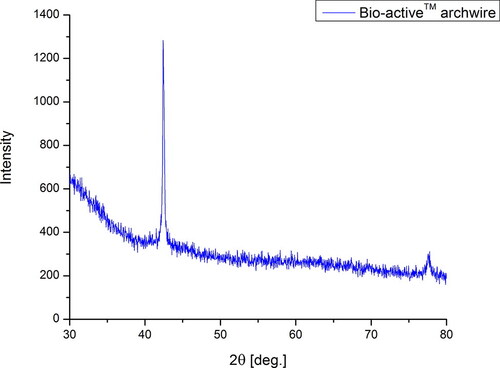
The results showed a diffractogram with two peaks at 2θ = 42.48 and 2θ = 77.73, which are characteristic of the Ni-Ti alloy with an austenite crystal structure. The crystal system is cubic with parameters a = b = c = 3.00700 (Å). The austenite structure was maintained during the orthodontic treatment in the three regions of the clinically retrieved Bio-active™ archwires. The XRD pattern of the Bio-active™ archwires is similar to the XRD pattern of the TriTanium™ archwire and the heat-activated Ni-Ti archwires, and their peaks are at the same 2θ degrees [Citation11–13]. The similarity between the abovementioned archwires is expected because they are all made from Ni-Ti alloy.
SEM and EDS results
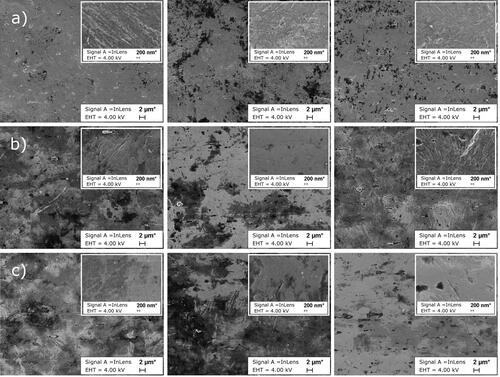
shows representative SEM micrographs of the surface of the archwires (as received, used for six and used for nine weeks) with different magnification. Small grains without specific shape are seen on the as received archwires’ surface, and their size is around 500 nm. Using the ImageJ software [Citation14], mean value and standard deviation for their area were calculated to be 0.276 μm2 and 0.145 μm2. It is observed that with prolonged usage, the surface in the three regions becomes smoother, with visible scratches. The aesthetic appearance, mechanical characteristics, corrosion behaviour, and/or an orthodontic wire’s biocompatibility are influenced by the surface topography, as it is an essential property of the archwires [Citation15]. Rough surface affects the wire’s friction properties, encourages more significant plaque accumulation and increases colour instability and corrosion during clinical usage [Citation16–19]. The surface of the investigated as received Bio-active™ archwires has rough microstructure, while the surface of the used ones is less so, thus the archwires’ surface for six weeks becomes partially smooth (bicuspid region). We suppose that the surface of the used archwires becomes softer, with visible scratches due to the sliding of the wire into the brackets. On the other hand, the surface in the three regions of the TriTanium™ multi-force archwire becomes rougher with prolonged usage, compared to the overall smooth surface of the as received ones [Citation20].
Figure 2. SEM micrographs of the surface of the upper wires: as received (a), used for 6 weeks (b) and used for 9 weeks (c). From left to right: ant., bic., post. (the 2 μm micrographs are visualized at ×5000 magn., while the 200 nm micrographs are visualized at ×50,000 magn.).
EDS analysis was made on all three regions of all as received and clinically retrieved archwires. A representative SEM micrograph of the surface area, where EDS analysis was done and EDS spectra were taken, is presented in . The EDS spectra present spectra lines for Ti and Ni, which correspond to the literature table values for X-ray emission lines [Citation21] of those elements. Respectively, Kα1= 4.51 keV, Kβ1= 4.93 keV and L emission lines are in between 0.40–0.60 keV for Ti and Kα1= 7.48 keV, Kα2= 7.46, Kβ1= 8.26 keV, L lines in-between 0.80–0.90 keV for Ni. There are also spectra lines for Fe and Cr detected in small quantities on the surface of the as received and clinically retrieved Bio-active™ wires. The spectra lines for the Fe and Cr are respectively at Kα1= 6.40 keV, Kα2= 6.39 keV, Kβ1= 7.06 keV and L lines in the 0.50–1 keV range; Kα1= 5.41 keV, Kα2= 5.41 keV, Kβ1= 5.95 keV and L lines in the 0.50–0.58 keV range.
Figure 3. Representative SEM (a) micrograph (×2000 magn.) and EDS spectra (b) of the surface of Bio-active™ archwires.
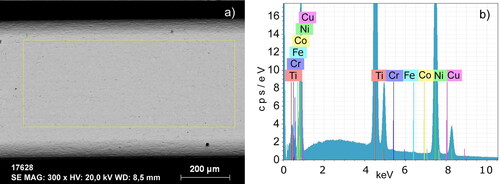
presents the elemental composition in the three zones of elasticity of the archwires as received, used for six and for 9 weeks. As seen, there is no significant difference in the weight percentage of nickel and titanium in the three regions of the as received and clinically retrieved archwires. The amounts of Ni and Ti are approximately 55 wt.% and 45 wt.%, respectively. This corresponds to the multi-force TriTaniumTM orthodontic archwire elemental composition ratio, whose Ni and Ti content are about 54 wt.% and 46 wt.% [Citation13]. Different amounts of Fe and Cr were registered in the various areas with differential force release. They could be trace elements or incidental impurities in an amount of up to 0.4 wt.%, as it is accepted for CuNiTi multi-force orthodontic archwires [Citation22].
Table 2. Mean values for the surface elemental composition of the investigated Bio-active™ archwires.
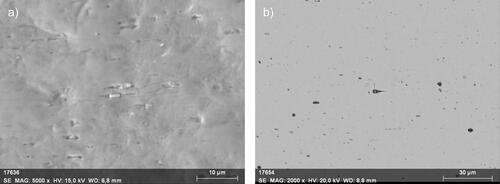
shows the EDS results for places with different microstructure. Spectrum 1 exhibits 80.3 wt.% Ti and 19.7 wt.% Ni, while spectrum 2 exhibits 35.6 wt.% Ti and 64.4 wt.% Ni, respectively. The ratio of Ni and Ti in spectrum 2 is almost 1:2, and we assume that we have a grain of Ni2Ti phase with irregular rounded shape there. The Ni2Ti phase has been found as a type of NiTi precipitate in the microstructure of Ni52Ti48 shape memory alloy (SMA), observed mainly as small round particles or a needle-like shape [Citation23]. The presence of second phase particles (SPPs) during the alloy processing plays a significant role in the refinement of the microstructure. Deformation of the alloy could lead to localized amorphization of the matrix phase around the SPPs, like that observed in severe plastic deformation of metallic materials [Citation24].
Table 3. Elemental composition of the anterior region of Bio-active™ archwires as received (surface) and bicuspid area of used for nine weeks (cross-section).
presents the SEM micrograph of the anterior region of an as received archwire on which EDS analysis in two points was made. shows the SEM micrograph of the bicuspid region of a clinically retrieved archwire used for nine weeks, on which the EDS analysis was made in one point (corresponds to spectrum ‘4’ from ). The detected amounts for Ti and Ni in spectrum 4 (a pore) are respectively 93.4 wt. % and 6.6 wt. %. Aside from the few places where Ti is the predominant element, since Ni and Ti dissolved each other to form a single solid solution, there are no large areas ascribed to a single element [Citation25]. In spectra 3, 5 and 6, the amounts of Ni and Ti of the cross-section of the wire used for nine weeks corresponds to the amounts determined on the surface.
Figure 4. SEM micrographs of anterior region (a) of as received (surface) (×5000 magn.) and bicuspid region (b) of Bio-active™ archwires used for nine weeks (cross-section) (×2000 magn.).
LIBS results
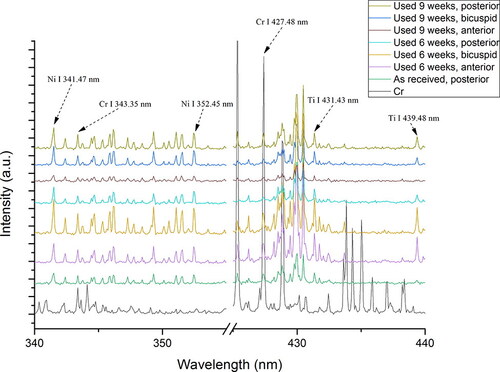
Qualitative analysis of the investigated archwires’ elemental composition was done by LIBS analysis, at room temperature, in air atmosphere. The LIBS spectra of the Bio-active™ archwires confirmed the presence of Ni and Ti, detected by the EDS analysis. The presented LIBS spectra ( and ) show Fe’s presence in the 290–310 nm wavelength range, whereas to show the presence of Cr, LIBS spectra in the 340–440 nm wavelength range was chosen. The lines chosen as analytical spectra for the experimental analysis are Fe I 294.84 nm, Fe I 298.47 nm and Fe I 303.77 nm and Cr I 343.35 nm and Cr I 427.48 nm. The registered spectra were compared to the spectra of the pure elements available on the NIST database [Citation26] to determine each element’s presence in the samples. Calibration for the LIBS analysis was not made in our case. It can be used only for qualitative purposes. The EDS analysis was used for quantitative elemental analysis, but LIBS’ advantage is that the archwirеs can be analyzed in depth. It has been proven that the LIBS analysis can be used for the qualitative characterization of such samples and the results from this research contributed to the overall explanation of the properties of the Bio-active™ orthodontic archwires [Citation13].
Figure 5. LIBS spectra of the investigated Bio-active™ archwires, showing the presence of Fe.
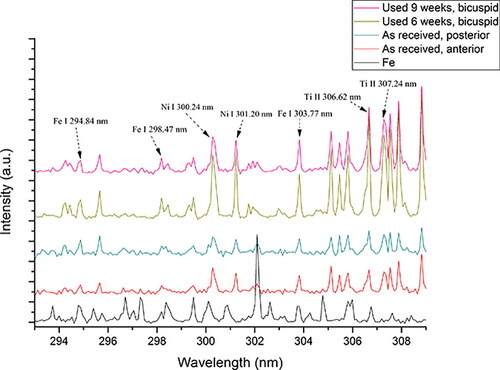
Figure 6. LIBS spectra of the investigated Bio-active™ archwires, showing the presence of Cr.
Nanoindentation results
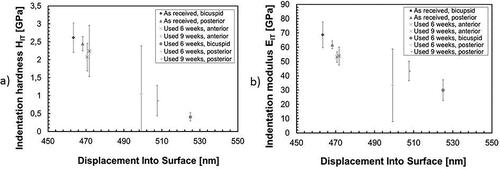
The indentation hardness and indentation modulus of Bio-active™ orthodontic archwires as received and used for 6 or 9 weeks were calculated using Oliver & Pharr approximation method [Citation27]. The comparison between the indentation hardness and indentation modulus of the investigated archwires is shown in . The results from nanoindentation experiments showed that with increasing the time of use of the archwires in the oral cavity, their indentation hardness and moduli decrease, probably due to the morphology changes we observed by SEM (). Moreover, we found that the bicuspid region of the wires used for over six weeks has the smallest indentation hardness (0.407 GPa) and modulus (29.97 GPa) out of all the investigated wire categories. This is probably due to the minor concentration of Ti in this region (). We found only one paper in the literature where the mechanical properties of Bio-active™ archwires were investigated [Citation9]. Still, this article used another experimental method (load/deflection test) and does not report hardness and modulus of the archwires. That is why it is not possible to compare the results with those obtained in our study. In a PhD thesis [Citation8], surface topography and roughness of rhodium-coated Bio-active™ archwires (GC Orthodontics) were investigated, but the mechanical properties were not investigated. This latest generation archwire shows variable modulus in the three segments, which is advantageous because orthodontists might use archwires with bigger dimensions, avoiding periodontal trauma (especially in the incisors) and feeling of pain in patients. The prolonged use period allows saving clinical time and reducing the number of used archwires.
Figure 7. Indentation hardness (a) and indentation modulus (b) of investigated Bio-active™ archwires.
Statistical results
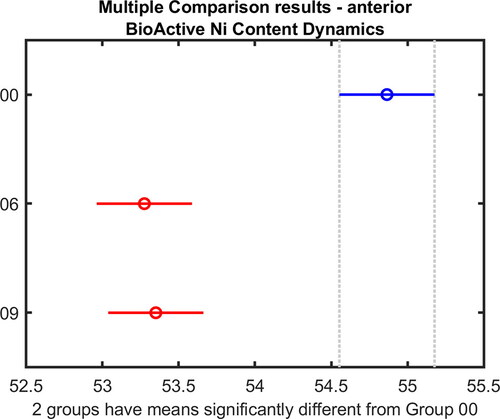
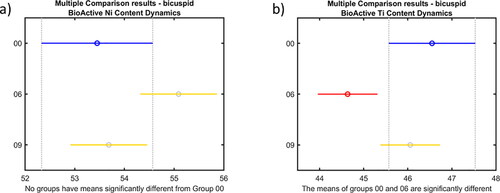
, 9(a,b), 10(a,b) and 11(a,b) show the statistical analysis results for the Ni/Ti content, indentation modulus and indentation hardness dynamics as a function of the duration of use for the considered regions: anterior, bicuspid and posterior. Each figure contains a plot showing the multiple comparison results. The plot’s X-axis shows the Ni/Ti content in weight percentages and indentation modulus and indentation hardness in GPa. The plot’s Y-axis shows the three usage durations (as received, used for six and used for nine weeks). The graph shows pairwise comparison results from a multiple comparison test and displays the estimates and comparison intervals. The group mean is represented by a symbol, and a line extending out from the symbol represents the interval. The means of the two groups are considered different if their intervals are disjoint and they are not considerably different if their intervals overlap. The colours of the data points are visual representation of whether the groups are statistically different or not. The numerical results of the non-parametric Kruskal-Wallis one-way ANOVA test use F-statistic. The F-statistic is the ratio of the mean squared errors. The p-value is the probability that the test statistic can take a value higher than the computed test statistic value (Prob>F). The small p-value (p ≤ 0.05) indicates that differences between means are significant.
Figure 8. Anterior segment statistical results for Ni content dynamics.
Note: Different colours indicate statistically significant differences (p < 0.05).
Statistical analysis of the chemical Ni/Ti content dynamics
For the anterior segment in the Ni content as received differs significantly from that at the stage of 06 and 09 weeks of usage. From stage 00 (as received) to stage 06 the Ni content goes down and stabilizes (stays the same) at stages 06 and 09. The ANOVA shows significance with a p-value = 0.029526. At the same time, the Ti content remains statistically unchanged.
For the Bicuspid segment in , the Ni content at stage 06 is bigger than that at stages 00 and 09, and the difference is close to significant. The ANOVA shows significance with a p-value = 0.029526, but the confidence intervals in the plot still have a slight overlap. The phenomenon is due to the Bonferroni correction for multiple comparisons, which is too conservative. Relaxing the multi-comparison Bonferroni conditions to False Discovery Rate (FDR) causes the confidence intervals to no longer overlap, leading to significance in the results. In contrast, in (Bicuspid segment) the Ti content at stage 06 is significantly larger than at stages 00 and 09 with a p-value = 0.019287. The larger Ni content at stage 06, in contrast to stages 00 and 09 (), is compensated by the significantly lower Ti content at the same stage (06) in comparison to 00 and 09 ().
Figure 9. Bicuspid segment statistical results for Ni content dynamics (a) and Ti content dynamics (b).
Note: Different colours indicate statistically significant differences (p < 0.05).
The posterior segment in the Ni/Ti content stays statistically unchanged at all stages. The Ni content decreases slightly in time, whereas the Ti Content compensates by a slight increase in time.
The statistical analysis of the EDS data for the as received and clinically retrieved archwires suggests an increase in the ratio of Ti to Ni in the wires. This can be explained as nickel being slowly absorbed into the patient’s organism. A similar trend has been reported previously for other heat-activated Ni-Ti orthodontic wires [Citation28].
Statistical analysis of the mechanical properties dynamics
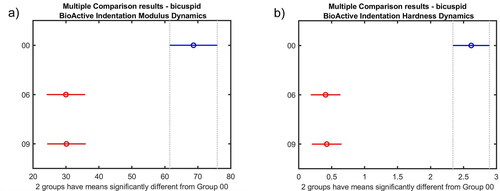
For the anterior segment, the indentation modulus (IM) and indentation hardness (IH) dynamics stays statistically the same (unchanged) at all stages. The same has been observed for the TriTanium™ multi-force archwire, where the indentation modulus and indentation hardness for the anterior region do not show any statistically significant differences based on usage durations [Citation20]. In contrast, for the bicuspid segment in ,b), the IM/IH in stage 00 (as received) differs in a statistically significant manner from stages 06 and 09 weeks of usage. ,b) shows that the IM/IH statistically significantly decreases from stage 00 to stage 06 and remains unchanged from stage 06 to stage 09. The corresponding p-values are p-value = 2.3552e-06 for and p-value = 2.3281e-08 for .
Figure 10. Bicuspid segment statistical results for indentation modulus dynamics (a) and bicuspid segment statistical results for indentation hardness dynamics (b).
Note: Different colours indicate statistically significant differences (p < 0.05).
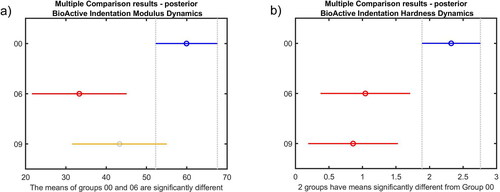
One may see the same phenomenon for the second time for the posterior segment. In , the IM at stage 09 is lower than at stage 00. The ANOVA shows significance with a p-value = 0.0046931, but the plot’s confidence intervals still have a slight overlap between stages 00 and 09. The phenomenon is due to the Bonferroni correction for multiple comparisons, which is too conservative. Relaxing the multi-comparison Bonferroni conditions to false discovery rate (FDR) causes the confidence intervals to no longer overlap, leading to significance in the results. In , the IH in stage 00 (as received) differs significantly from stages 06 and 09 weeks of usage with a p-value = 0.0026767. ,b) shows that the IM/IH is going down at stage 06 and stays unchanged at stage 09.
Figure 11. Posterior segment statistical results for Indentation Modulus dynamics (a) and Posterior segment statistical results for Indentation Hardness dynamics (b).
Note: Different colours indicate statistically significant differences(p < 0.05).
,b) and 11(a,b) show the statistical analysis results for the dynamics of the indentation modulus and indentation hardness as a function of the duration of use of the archwires, considering the bicuspid and posterior regions. It may be concluded that the decline in hardness of the archwires is contained to within the first 6 weeks of use. Similar results have been observed for the TriTanium™ multi-force archwire, where there is a statistically significant decay of the indentation modulus and indentation hardness for the archwires used for 6 weeks [Citation20]. This information could be a helpful guide for orthodontists to choose the most suitable duration of the Bio-active™ multi-force archwires during the orthodontic treatment.
Conclusions
The present investigation results would give the orthodontists important information about the physicochemical and mechanical properties of the Bio-active™ multi-force archwires during their clinical use. It can help choose the optimal duration of archwire use depending on the particular treatment goals and patient’s needs. The investigated orthodontic archwires are made of Ni-Ti alloy with austenite crystal structure, which is kept during the orthodontic treatment. The surface roughness of the Bio-active™ wires decreases after clinical use and their elemental composition does not change significantly during treatment. Aside from Ni and Ti, traces of Fe and Cr were also detected. It is always better to know the elemental composition because more and more people are allergic, especially to Cr and Ni. Furthermore, knowledge of the rate of Ni decline in the wires (or the rate at which Ni is absorbed into a patient’s body) can be important for orthodontists deciding how long to prescribe the use of archwires for any specific treatment. With increasing the time of handling the archwires in the oral cavity, their indentation hardness and modulus decrease, probably due to the morphology changes. Moreover, we obtained that the bicuspid region used for 6 weeks has the smallest indentation hardness and modulus than all other investigated samples, probably due to the lowest Ti concentration in this region. It may be concluded that the decline in hardness of the archwires is contained to within the first 6 weeks of use.
Disclosure statement
The authors report no conflict of interest.
Data availability
All data that support the findings reported in this study are available from the corresponding author upon reasonable request.
Additional information
Funding
References
- Ibe DM, Segner D. Superelastic materials displaying different force levels within one archwire. J Orofac Orthop. 1998;59(1):29–38.
- GC Orthodontics. [accessed 2020 Mar 18]. Available from: https://www.gcorthodontics.eu/GC/us/content/Bio-active.
- Miura F, Mogi M, Ohura Y. Japanese NiTi alloy wire: use of the direct electric resistance heat treatment method. Eur J Orthod. 1988;10(3):187–191.
- Kauffman GB, Mayo I. The story of nitinol: the serendipitous discovery of the memory metal and its applications. Chem Educator. 1997;2(2):1–21.
- Oguienko O. Mechanical properties of graded thermodynamic nickel titanium archwires in bending and torsion [dissertation]. Canada: Faculty of Dentistry, University of Toronto; 2017.
- Syed M, Chopra R, Sachdev V. Allergic reactions to dental materials-a systematic review. J Clin Diagn Res. 2015;9(10):ZE04–ZE09.
- Zigante M, Mlinaric MR, Kastelan M, et al. Symptoms of titanium and nickel allergic sensitization in orthodontic treatment. Progr Orthod. 2020;21(1):1–7.
- Oliveira DC. Propriedades físicas e desenvolvimento de formação de biofilme em fios ortodônticos estéticos [dissertation]. Brasil: Universidade Federal de Pelotas; 2018.
- Lombardo L, Ceci M, Mollica F, et al. Mechanical properties of multi-force vs. conventional NiTi archwires. J Orofac Orthop. 2019;80(2):57–67.
- ETCHANT STORE of ES Laboratory, LLC. [accessed 2020 Jun 25]; Available from: https://etchantstore.com/?s=Kroll+reagent.
- Iijima M, Brantley WA, Kawashima I, et al. Micro-X-ray diffraction observation of nickel–titanium orthodontic wires in simulated oral environment. Biomaterials. 2004;25(1):171–176.
- Ilievska I, Petrov V, Andreeva L, et al. Structural and morphological characterization of heat-activated nickel-titanium archwires. Bulg Chem Commun. 2017;49(Special Issue A):33–39.
- Ilievska I, Petrov V, Mihailov V, et al. Elemental composition and structural characteristics of as-received TriTaniumTM orthodontic archwire. J Phys: Conf Ser. 2018;992:1–5.
- ImageJ. Image processing and analysis in Java; [accessed 2020 Aug 20]. Available from: https://imagej.nih.gov/ij/.
- Daems J, Celis JP, Willems G. Morphological characterization of as-received and in vivo orthodontic stainless steel archwires. Eur J Orthod. 2009;31(3):260–265.
- Bourauel C, Fries T, Drescher D, et al. Surface roughness of orthodontic wires via atomic force microscopy, laser specular reflectance, and profilometry. Eur J Orthod. 1998;20(1):79–92.
- Doshi UH, Bhad-Patil WA. Static frictional force and surface roughness of various bracket and wire combinations. Am J Orthod Dentofacial Orthop. 2011;139(1):74–79.
- Eliades T, Athanasiou AE. In vivo aging of orthodontic alloys: implications for corrosion potential, nickel release, and biocompatibility. Angle Orthod. 2002;72:222–237.
- Saunders CR, Kusy RP. Surface topography and frictional characteristics of ceramic brackets. Am J Orthod Dentofac. 1994;106(1):76–87.
- Cherneva S, Stoyanova-Ivanova A, Gueorguieva M, et al. Nanoindentation and surface characterization of clinically retrieved multi-force NiTi orthodontic archwires. RJB. 2020;24(Issue 3):240–256.
- Thompson A, Attwood D, Gullikson E, et al. X-ray data booklet. Center for X-ray optics and advanced light source. 2nd ed. Berkeley, California: Lawrence Berkeley National Laboratory; 2001.
- Fasci MA, Tran KQ, Karabin LB. Multiforce orthodontic archwire. United States patent US 10575929B2. 2020 Mar 3.
- El-Bagoury N, Amin MA, Shokry H. Microstructure and corrosion behavior of Ni52Ti48-xCox shape memory alloys in 1.0 M HCl solution. Int J Electrochem Sci. 2013;8:1246–1261.
- Bhagyaraj J, Ramaiah KV, Saikrishna CN, et al. Behavior and effect of Ti2Ni phase during processing of NiTi shape memory alloy wire from cast ingot. J Alloys Compd. 2013;581:344–351.
- Burlacu L, Cimpoeşu N, Bujoreanu LG, et al. Exploiting heat treatment effects on SMAs macro and microscopic properties in developing fire protection devices. IOP Conf Ser: Mater Sci Eng. 2017;227:012018.
- NIST Electronic Database. U.S. Department of Commerce; [accessed 2020 Jul 20]. Available from: https://physics.nist.gov/PhysRefData/ASD/lines_form.html.
- Oliver WC, Pharr GM. An improved technique for determining hardness and elastic modulus using load and displacement sensing indentation experiments. J Mater Res. 1992;7(6):1564–1583.
- Petrov V, Andreeva L, Petkov G, et al. Modelling of nickel release dynamics for three types of nickel-titan orthodontic wires. Proceedings of the 2nd International Conference on Applications of Intelligent Systems, January 2019, Article No.: 20, 1–5.