
Abstract
Hypericum triquetrifolium Turra is an ecologically, medicinally and economically important species in Tunisia. Thirty-six Hypericum individuals sampled from 6 northern Tunisian locations were investigated for their diversity and relationships using 10 inter-simple sequence repeats (ISSR) markers and 10 morphological features at vegetative stage. The phylogenetic analysis, using 308 bp of sequenced ITS1 region, identified the Hypericum individuals as H. triquetrifolium that clustered with members of genus Hypericum section 9, 9a, 9b and 27, in agreement with the previous molecular classification of the genus. Among the 10 ISSR markers tested, 7 were scorable and yielded 91 loci with 94.5% of polymorphism. UBC848 and UBC836 were the most polymorphic ISSR markers. The level of genetic diversity (HT = 0.247) and gene flow between the six populations (Nm = 1.169) were moderate. The structure analysis revealed three genetic subpopulations: individuals of Le Krib location formed a subpopulation divergent from two other subpopulations, probably due to its northwestern and high-altitude geographic barriers, and its sub-humid microclimate. Zaghouan, northeastern location in the lower semi-arid, with the highest genetic (I = 0.370) and morphological (I = 0.631) Shannon’s information indices and, regrouping two out of the three genetic subpopulations, is the most probable zone of origin for H. triquetrifolium. In addition, morphological data showed higher diversity than ISSR data; however, no evidence of correlation between genetic and morphologic traits could be suggested in this study. These results on the genetic diversity and phylogenetic analysis will contribute to the conservation of the gene pool of H. triquetrifolium in Tunisia.
Introduction
Hypericum is a large genus, which includes almost 500 species, mainly herbs, shrubs and a few trees and is classified into 36 taxonomic sections [Citation1–4]. Members of this genus are characterized as weeds and distributed in agricultural areas in northern America, where more than 2 million hectares have been infested by the weeds since the 1940s [Citation5]. They have been also declared as noxious weeds in Australia and Tasmania [Citation6]. In Tunisia, the genus Hypericum, represented by eight species (species H. perforatum L., H. humifusum L., H. tomentosum L., H. perfoliatum L., H. triquetrifolium Turra, H. richeri L., H. androsaemum L. and H. ericoides L.), grows widely in the north and centre of the country in bioclimatic regions extending from the sub-humid to the upper arid [Citation7]. H. triquetrifolium, a perennial herb native to the Mediterranean Basin and belonging to the section 9, 9a, 9b and section 27 (section Hypericum) [Citation8], is the main species considered an invasive weed, which expands over vast areas, and infests crop fields and grazing lands, causing severe damage to Tunisian agriculture (Jenfaoui et al. Unpublished).
Medicinal and aromatic plants have gained recently more popularity. They include a high content of non-nutritive, nutritive and bioactive compounds such as flavonoids, phenolics, anthocyanins and phenolic acids, as well as nutritive compounds such as essential oils and minerals. Medicinal and aromatic plants have also distinct flavour and taste, excellent medicinal value and health care functions [Citation9]. The members of genus Hypericum have been largely used for their horticultural and medicinal values. These medicinally important plants contain pharmacologically active compounds, such as naphthodianthrones, hypericin and pseudohypericin, phloroglucinols, hyperforin and adhyperforin, as well as characteristic xanthones, flavonoids, biflavonoids, tannins and phenolic acids. These compounds have a wide range of medicinal activities such as anti-inflammatory, antiviral, antibacterial, antifungal, antioxidant, cytotoxic and anti-depressive [Citation10–18]. H. triquetrifolium has been used as herbal medicine for skin treatment and gastrointestinal diseases [Citation19]. An antimicrobial activity of the essential oils of H. triquetrifolium from Tunisia has also been highlighted by Rouis et al. [Citation16].
Whether it is considered as a weed or a medicinal plant, it is important to characterize the morphological and genetic diversity of Hypericum species in order to efficiently control or preserve these species. The fragmentation of populations and their disturbance are main factors causing random genetic drift which enhances genetic erosion and reduces the population’s adaptability to environmental changes [Citation20]. Therefore, the study of the genetic diversity and genetic structure of H. triquetrifolium is necessary for the development of appropriate conservation and improvement programs.
Morphological, biochemical and molecular markers are currently used to investigate variations among and within Hypericum species. H. perforatum shows remarkable variations in morphology, ploidy and breeding system, which range from sex to apomixis [Citation4]. While Hypericum species are morphologically distinct at maturity, species identification based on vegetative stage distinctions may pose difficulties. Alonso et al. [Citation21] showed that leaf colour, gland disposition and colour were the most widely used characters to separate taxa in Hypericum sections. In Tunisia, significant morphological variability was also shown between fourteen populations of H. triquetrifolium. In fact, a highly significant population effect for all morphological characters studied has been observed. Population variability is mainly controlled by the leaves shape, the stem aspect, and the abundance of the black spots on the stem, leaves and sepals [Citation22].
Molecular techniques, as a complementary method of plant material authentication, have unique advantages as compared to macroscopic, microscopic and chemical techniques. They are preferred over other techniques because they do not depend on the growth period of the plant and environmental conditions. Molecular methods can also be sensitive enough to detect subtle differences allowing authentication of botanical extracts [Citation23]. Internal transcribed spacer (ITS) gene sequences were used to distinguish H. perforatum from other species of Hypericum. Previous studies have demonstrated the utility of the ITS region for phylogenetic inference at the species level in Hypericum [Citation23–25]. The possibility of amplifying ITS-1 and ITS-2 separately using internal primers allowed Nürk et al. [Citation26] to distinguish poorly preserved plant tissue from older herbarium specimens. In addition, inter-simple sequence repeat (ISSR) markers were successfully used to reveal the genetic diversity among and within populations of H. perforatum. The use of ISSR markers gave hints for the occurrence of sexual recombination in H. perforatum plants. In comparison to other molecular markers, the ISSR approach is easier to handle and can be performed with different primers that cover several sites of a genome [Citation27–30]. Morshedloo et al. [Citation29] assess genetic variability among 10 wild populations of H. perforatum growing in different climatic regions of Iran via ISSR markers. The 15 selected primers generated 191 polymorphic fragments with an average of 12 in each primer. Farooq et al. [Citation27] also observed a moderate to high genetic diversity in H. perforatum clones from 8 provinces of the Kashmir Valley in India and 71 ISSR loci out of the 98 tested were polymorphic. Other molecular approaches have been used to study the genetic diversity of Hypericum in Tunisia. Smelcerovic et al. [Citation31] revealed a stronger correlation of secondary metabolite contents with RAPD (random amplified polymorphic DNA) data than with SSR data among six Hypericum species studied from Serbia. Béjaoui et al. [Citation32] investigated the genetic diversity and population structure of 16 H. humifusum populations using 9 isozymes. They observed a high genetic variation; eight out of the nine surveyed isozymes were polymorphic. Fourteen loci were detected; three out of which were monomorphic (MDH-3, PGM-1 and PGM-3) and the mean percentage of polymorphic loci (PPL) over all populations was 64.29%. In another study, the genetic structure of seven natural Tunisian H. humifusum populations was also assessed using two isozymes and RAPD markers. The results showed a higher genetic diversity within populations using isozymes than RAPD markers. Nine isozymes surveyed (MDH, PGM, ICD, PGI, 6PGD, EST, LAP, GOT and ADH), were encoded by 14 putative loci. The genetic diversity was high within population. The number of alleles per polymorphic locus varied from 1.7 to 2.1 with an average of 2.01. For RAPD analysis, the 8 selected primers generated a total of 166 bands, 153 of which were polymorphic (p = 92.42%). The PPL at the population level was relatively low, ranging from 29.52% to 39.16% [Citation33]. The study of Al-Rifaee et al. [Citation34] was the only one reporting the genetic diversity and population structure of H. triquetrifolium. The study was performed on 27 wild populations collected form Jordan using 5 RAPD primers. Forty markers out of the 58 were polymorphic across the 27 wild populations. The percentage of polymorphism ranged from 54.6% for primer OPW-1O to 91.7% for primer OPB-20. The total percentage of polymorphism among the populations was 68.97%. The genetic diversity and population structure of H. triquetrifolium worldwide and in Tunisia is still unknown. Thus, the objectives of this research are to (i) study the morphological and genetic diversity of H. triquetrifolium in Tunisia, (ii) investigate the population structure of the Tunisian H. triquetrifolium, and (iii) reveal the phylogenetic relationships between the Tunisian H. triquetrifolium at population and individual levels.
Materials and methods
Sampling locations
Six cereal crop fields located in northern Tunisia, belonging to the sub-humid, upper semi-arid and lower semi-arid bioclimates, were selected for sampling H. triquetrifolium individuals. The altitudes of the locations varied from 72 m (Mjez El Bab location) to 511 m (Touiref location). The main ecological features of the locations are reported in . All six fields have the same cultural practices and had been managed under wheat/barley monoculture for over 10 years. Reduced tillage was applied at all fields. The fields were harvested in July 2017 during intercropping and only Hypericum was present at the time of sampling.
Table 1. Main ecological features for the six Tunisian locations investigated for H. triquetrifolium morphological and genetic diversities.
Voucher specimens were deposited at the Herbarium of the Department of Botany, National Agronomic Institute of Tunisia.
Morphological assessment and data analysis
Twenty individuals in each location were sampled for morphological assessment. Individuals were sampled at distances exceeding 50 m to avoid the sampling of closely related individuals. Morphological characterization was established based on 10 morphological traits given in . Morphological data were assessed based on semi-qualitative scales published previously [Citation21,Citation35,Citation36].
Table 2. The 10 studied morphological traits and their variations, assessed on the 120 H. triquetrifolium individuals sampled.
To assess the population structure based on morphological characters, a Principal Coordinate Analysis (PCoA) was performed using GenAlEx 6.503 [Citation37]. Shannon’s information index (I) was also calculated using GenAlEx 6.503 [Citation37]. In addition, the number of morphotypes (M), corresponding to the number of different combinations of morphotypic traits, was assessed. The number of specific morphotypes, defined as combinations of morphotypic traits present in one location and absent in the others, was also calculated.
DNA isolation, ITS sequence amplifications and sequence analysis
In order to confirm the identity of the Tunisian Hyperium samples and situate them in relation to other known related species, one individual for each population was chosen for ITS sequencing, using ITS1/ITS2 primer sets [Citation38]. Total genomic DNA was extracted from ground young and fresh leaves of a single individual. The DNA isolation procedure was applied according to the cetyltrimethyl ammonium bromide procedure of Doyle and Doyle [Citation39] with some modifications: without adding 2-mercaptoethanol, using 0.2 to 0.5 g of fresh leaf samples, incubating at 60°C for 60 min and centrifuging at 13,000 rpm. Quantification of the isolated DNA was measured by using Optizen Nano Q micro volume spectrophotometer (Mecasys, Korea). The integrity of the DNA was visually checked in ethidium bromide stained 1X-TBE (Tris-borate ethylenediaminetetraacetic acid) agarose gel. DNA solutions were diluted to a final concentration of 30–50 ng/µL. The ITS amplifications were performed at an annealing temperature of 48°C. ITS amplicons were migrated in 1.2% m/v agarose gel and 1X TBE buffer. Purification and sequencing processes were performed by Iontek Molecular Diagnostics (IMD - Turkey; ).
Table 3. GenBank accession ID of nuclear rRNA-ITS regions of each sequence analysed at each location and BLASTn results showing the first best hit detected on NCBI GenBank.
NCBI online nucleotide Basic Local Alignment Search Tool (BLASTn), was first used to retrieve the GenBank accession ID of the best hit for each sequence at each population.
In addition, to assess the relationship between the individuals, alignment of the ITS sequences was first conducted using Clustal W application in Bioedit v7.2.5 [Citation40] with manual adjustments. Furthermore, a total of 220 ITS sequences were used to conduct a phylogenetic analysis included our six ITS sequences from Tunisia and 214 ITS sequences retrieved from the nucleotide database of NCBI [Citation26,Citation41–43]. The phylogenetic relationship between the ITS sequences was inferred on unweighted pair group method with arithmetic mean (UPGMA) tree, based on Nei’s [Citation44] genetic distance using MEGA X software [Citation45].
ISSR amplifications
For genetic analyses, six individuals in each location were assessed. As previously, about 5 g of young and fresh leaves from each representative individual were ground and stored at −80 °C until analyses. To genotype H. triquetrifolium individuals, ISSR markers were chosen because they are reliable, easy to use, highly polymorphic and they have been successfully used in previous genetic diversity, phylogeny, gene tagging, genome mapping and evolutionary biology studies in plant species, including in Hypericum (H. triquetrifolium and its relative H. perforatum) [Citation46]. The seven used ISSR primers are given in . Total volume of the PCR mixtures was 25 µL, prepared by using 2.5 µL of 10X PCR buffer, 3 µL of 25 mmol/L MgCl2, 2 µL of 10 mmol/L deoxynucleoside triphosphate (dNTP) mix, 0.5 µmol/L of selected primer, 1 µL of isolated DNA solution, 0.25 µL of 5 U (1.25 U) Taq-DNA polymerase and 16 µL of nuclease free ultrapure sterile water. The amplification processes were performed in an Aeris Thermal Cycler Model G96 (Esco Inc., Singapore). The Thermal cycler was programmed for an initial primer denaturation at 94°C for 5 min; 38 cycles of denaturation at 94°C for 1 min, variable annealing temperature depending on the primer used for 30 s and extension at 72°C for 1 min, followed by a final extension at 72°C for 10 min.
Table 4. ITS and ISSR Primers used in the study and PCR amplification conditions.
After the amplification process, amplicons were separated by agarose gel electrophoresis. ISSR amplicons were migrated in 1.6% m/v gel and 1X TBE buffer. Migrated amplicons were visualized and photographed under UV photography (Vilber-Lourmat, France). The molecular weight of the amplicons was estimated with a 1000-bp plus DNA ladder (Thermo Scientific, USA).
ISSR data analysis
All ISSR bands were evaluated and only reproducible, clearly stained and well resolved ISSR bands were scored as ‘1’ for present and ‘0’ for absent to produce a binary matrix. The effective multiplex ratio (EMR), marker index (MI), polymorphic information content (PIC) and resolving power (RP) were calculated for each ISSR primer [Citation47–49]. To test the RP of our ISSR markers, a genotype accumulation curve was also calculated under R version 3.4.4 [Citation50]. In addition, the number of polymorphic bands (NPB), the PPL, the number of effective alleles (Ne) per locus, the number of private allele (PA), the number of multilocus genotypes (MLG), the Shannon’s information index (I), the pairwise Nei’s genetic distances and the pairwise Nm were calculated and by genetic subpopulations as defined by STRUCTURE, under GenAlEx (version 6.503) [Citation37]. The number of MLG correspond to the number of different combinations of genotypic bands. A private allele corresponds to a band present in one population or in one genetic subpopulation and absent in the others. In addition, PCoA was performed under GenAlEx 6.503 using the ISSR data [Citation37]. The correlation between genetic and geographic distances was performed using a Mantel test [Citation51] under GenAlEx (version 6.503). Furthermore, Mega X software [Citation45] was used to generate a neighbour-joining (NJ) tree between 36 H. triquetrifolium individuals based on Nei’s (1972) genetic distance calculated using the obtained data of 7 ISSR markers and, FigTree v1.4.4 was used to visualize it [Citation52]. In addition, the genetic variability within and between populations and, within and between subpopulation were assessed with analyses of molecular variance (AMOVA) under GenAlEx 6.503.
Results
Genetic identification of the Tunisian H. triquetrifolium species and its relationship with other related known species
In this study, the ITS region from nuclear DNA was amplified, sequenced and analysed for inferring the identity of the six Hypericum samples and their phylogenetic relationship with other Hypericum genus members. The amplified nuclear rRNA-ITS sequences include the complete ITS1 region and partial 5.8S rRNA region. The final length of the ITS1 sequences was 308 bp and the G-C content ranged from 53.89% to 56.82%. The six sequences from the Tunisian H. triquetrifolium population were submitted to the NCBI nucleotide database (MG879533 (A: Zaghouan), MG879534 (B: El Aroussa), MG879535 (C: Le Krib), MG879536 (D: Tastour), MG879537 (E: Mjez El Bab) and MG879538 (F: Touiref)).
According to the results, H. triquetrifolium (AN: HE653651, AN: HE653652) and Hypericum sp. (AN: KY654968) sequences were the most closely related sequences (first hits) to the ITS sequences obtained in this study. The coverage and identity percentages ranged from 93% to 97% and 90% to 95%, respectively.
All the sequences obtained in this study clustered together with 99% bootstrap value and were joined by the two other H. triquetrifolium, HE653651 and HE653652. As expected, the close relatives to the Tunisian H. triquetrifolium belong to section 9, 9a, 9b and section 27 ().
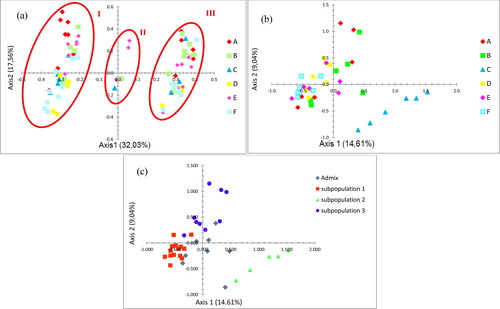
Figure 1. Principal coordinates analysis of Tunisian H. triquetrifolium based on 10 morphological traits at vegetative stage assessed for 120 individuals (a) and on 7 ISSR markers assessed for 36 individuals (b and c). Genotypes in (a) and (b) were colour-coded according to their locations; A: Zaghouan, B: El Aroussa, C: Le Krib, D: Tastour, E: Mjez El Bab, F: Touiref. Genotypes in (c) were colour-coded according to their membership to each of the three genetic subpopulations in blue, red, and green as defined by STRUCTURE at K = 3; Admixed individuals were colour-coded in grey.
Morphological variation
A total of 10 morphological features were taken into consideration for morphological data (). The total number of morphotypes in the 120 Tunisian H. triquetrifolium individuals assessed was 75. Based on location, the number of morphotypes varied between 18 (for El Aroussa) and 9 morphotypes (for Le Krib). Sixty-five of the 75 morphotypes were specific to a given location. Thirteen, 14, 7, 6, 11 and 14 morphotypes were specific to Zaghouan (A), El Aroussa (B), Le Krib (C), Tastour (D), Mjez El Bab (E) and Touiref (F), respectively. None of the studied morphological traits were specific to a given location, but certain locations were monomorphic for certain traits. In fact, all individuals from Le Krib (C) had an embracing leaf articulation; all individuals from Le Krib (C) and Tastour (D) had an upright stem; all individuals from Zaghouan (A) and El Aroussa (B) had rounded stem; and all individuals from El Aroussa (B), Le Krib (C), Tastour (D), Mjez El Bab (E) and Touiref (F) presented longitudinal lines in the stem. The lowest and highest Shannon’s information indices based on morphological data were 0.332 and 0.631, recorded at Tastour and Zaghouanlocations, respectively ().
Table 5. Descriptive statistics using 7 ISSR markers and 10 morphological features of H. triquetrifolium populations in Tunisia by locations and genetic subpopulations.
The PCoA based on morphological data () showed that the first two axes accounted respectively for 32.03% and 17.56% of the morphological variation, explaining altogether 49.59% of the total variation. The first axis clearly separated three distinct groups: group I, II and III. All regions were represented in groups I and III, while group II was represented by individuals only from Mjez El Bab, Le Krib and El Aroussa.
All morphotypes were specific to each group except one morphotype shared between group II and group III. Group I, II and III regrouped 37, 4 and 33 specific morphotypes, respectively. Morphological traits such as light green, dark green and reddish stem colours were specific to group I, group II and group III, respectively (). Stem colour and presence of longitudinal lines were traits with respectively the highest and lowest capacity to reveal morphological variation.
ISSR polymorphism
To reveal the genetic diversity among six populations of H. triquetrifolium from Tunisia, 10 ISSR primers were used. Seven primers resulted in clear and distinguishable band profiles. The highest number of loci was obtained for marker UBC820 with 20 loci while the lowest number of loci was obtained for marker UBC829 with 5 loci. A total of 91 loci were obtained, 86 of which were polymorphic, with an average of 13 loci per ISSR marker. The length of the ISSR bands ranged from 180 bp to 1500 bp ().
Table 6. Discriminatory characteristics of the 7 ISSR primers used.
The PPL was ranged between 82.35% (UBC825) and 100% (UBC820, UBC823, UBC829 and UBC848) with an average of 94.51%. Average EMR and MI were 12.35 and 3.63, respectively. The lowest, highest and average PIC values were 0.192 (UBC820), 0.370 (UBC848) and 0.292, respectively. Besides, the lowest, highest and average RP values were 6.28 (UBC829), 16.89 (UBC836) and 10.53, respectively (). UBC848 had the highest capacity to reveal genetic polymorphism with the highest PIC value. UBC836 had the highest ability of distinguishing the individuals with the highest RP values.
Population structure of H. triquetrifolium in Tunisia
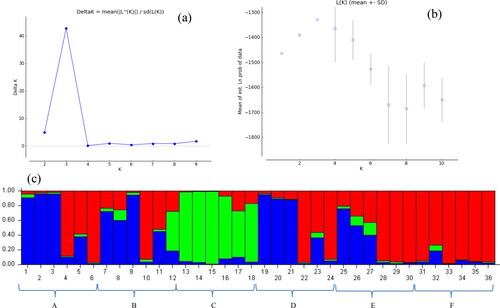
The STRUCTURE program [Citation53,Citation54] was run in order to study the population structure of H. triquetrifolium in Tunisia based on the seven ISSR markers used. The plot of mean posterior probability [ln P(D)] values per clusters (K) and, Evanno’s ΔK plot indicated that the most likely number of genetic subpopulations (K) was three (). The graphic representation of the estimated membership of each individual in the genetic subpopulations (at K = 3) is shown in . The three genetic subpopulations obtained were visualized in green, red and blue. The largest genetic group, subpopulation 1 (red) included all six individuals from Touiref, three individuals from Mjez El Bab, two individuals from Zaghouan, two individuals from Tastour and one from El Aroussa. All the individuals sampled at Le Krib population were grouped in the same genetic subpopulation, subpopulation 2 (green). Subpopulation 3 (blue) included three individuals from Zaghouan, three individuals from Tastour, two individuals from El Aroussa and one from Mjez El Bab. The remaining eight individuals were admixed.
Figure 2. Bayesian STRUCTURE clustering results based on the variation of 7 ISSR markers among 36 H. triquetrifolium individuals sampled from six populations in Tunisia. (a) Delta K values as a function of K; (b) The linear relationship between LnP(D); and (c) STRUCTURE output at K = 3. A: Zaghouan, B: El Aroussa, C: Le Krib, D: Tastour, E: Mjez El Bab, F: Touiref.
The results of the PCoA based on ISSR data, clearly separated all the individuals sampled at Le Krib population from all the other individuals (). This high differentiation of the Le Krib population from the other populations is in agreement with the STRUCTURE results. In addition, the individuals from Zaghouan and from El Aroussa were mostly dispersed, while the individuals from Mjez El Bab, as well as the individuals from Tastour and from Touiref populations, were mostly gathered together. According to the PCoA results based on STRUCTURE output at K = 3, the three genetic subpopulations were also revealed distinctly (). In addition, a Mantel test revealed a non-significant correlation between genetic and geographic distances (p = 0.090; Rxy = 0.109).
Genetic diversity analysis based on ISSR polymorphism
Overall, the total genetic diversity (HT) and the Shannon’s information index (I) were 0.247 and 0.388 in the Tunisian H. triquetrifolium populations. At population level, the coefficient of differentiation among-population (GST) and the estimated gene flow (Nm) were calculated as 0.208 and 1.904, respectively. At subpopulation level, GST and Nm were calculated as 0.274 and 1.326, respectively. These values indicate a moderate level of genetic diversity in H. triquetrifolium populations in Tunisia and an overall moderate level of gene flow in H. triquetrifolium populations between the different locations and between the different genetic subpopulations.
Each of the 36 individuals genotyped corresponds to a different MLG. The accumulation curve showed the power of the seven ISSR markers that were able to reach the maximal range of differentiation among the MLGs (). The NPB by population varied between 40 for Touiref and Citation55 for Zaghouan populations. Descriptive statistics by population showed that PPL ranged between 43.96% (at Touiref location) and 67.03% (at Zaghouan) and I ranged between 0.247 (at Touiref) and 0.370 (at Zaghouan; ). The H. triquetrifolium population at Zaghouan location appeared to be the most genetically diverse one, while Touiref location includes the most genetically similar individuals. The highest number of private alleles (PA = 3) was observed at El Aroussa and Le Krib locations. However, the lowest number of private alleles (PA = 1) was observed at Tastour, Mjez El Bab and Touiref locations.
Subpopulations 1, 2 and 3 included 14, 5 and 9 individuals, respectively. Eight individuals were admixed. The number of polymorphic loci by genetic subpopulation ranged between 37 for subpopulation 2 and 69 for subpopulation 3. Descriptive statistics by genetic subpopulation showed that the PPL ranged between 40.66% (subpopulation 2) and 75.82% (subpopulation 3) and I ranged between 0.232 (subpopulation 2) and 0.394 (subpopulation 3; ). Subpopulation 3 appeared to be the most genetically diverse, whereas subpopulation 2 included the most genetically similar individuals. Subpopulation 3 had the highest number of private alleles (PA = 6); the lowest number of private alleles (PA = 2) was observed in subpopulation 2 and subpopulation 1.
In addition, AMOVA showed that 21% of the total genetic diversity was observed among distinct populations and 27% among distinct subpopulations, while 79% of the genetic diversity was explained by differences within each population and 73% within each subpopulation ().
Table 7. Analysis of molecular variance (AMOVA) for 6 populations (a) and 3 genetic subpopulations (b) of H. triquetrifolium based on ISSR data.
Phylogenetic relationship between H. triquetrifolium populations and individuals in Tunisia
Nei’s [Citation44] genetic distances at population level showed that the lowest genetic distance based on ISSR data was calculated between Zaghouan and El Aroussa (0.045); while the highest was calculated between Le Krib and Touiref (0.234; ). At subpopulation level, Nei’s genetic distance was the lowest between subpopulation 1 and subpopulation 3 (0.099), while the highest was calculated between subpopulation 2 and subpopulation 3 (0.229; ). The pairs Zaghouan and El Aroussa and, Le Krib and Touiref showed similarly the highest (Nm = 10.369) and the lowest (Nm = 0.724) gene flow, respectively. The highest gene flow was also calculated between subpopulation 1 and subpopulation 3 (Nm = 2.316; ).
Table 8. Pairwise Nei’s genetic distances (above diagonal) and pairwise Nm values (below diagonal) for H. triquetrifolium measured between the 6 populations (a) and between the 3 genetic subpopulations (b) using ISSR data.
At individual level, the NJ tree based on Nei’s genetic distance showed the relationship between the 36 H. triquetrifolium: three clusters were distinguished, in agreement with STRUCTURE subpopulations. Individuals from Le Krib location, represented by subpopulation 2, diverged from all the other individuals. In addition, the NJ tree confirmed the close relationship between subpopulation 1 and subpopulation 3 ( and ).
Figure 3. Neighbour-joining (NJ) tree between 36 H. triquetrifolium individuals based on Nei’s (1972) [Citation44] genetic distance calculated using 7 ISSR markers. Individual ID was coded based on the location : A1, A2, A3, A4, A5 and A6 are individuals from Zaghouan; B1, B2, B3, B4, B5 and B6 are individuals from El Aroussa; C1, C2, C3, C4, C5 and C6 are individuals from Le Krib; D1, D2, D3, D4, D5 and D6 are individuals from Tastour; E1, E2, E3, E4, E5 and E6 are individuals from Mjez El Bab; F1, F2, F3, F4, F5 and F6 are individuals from Touiref. Individuals were colour-coded by genetic subpopulations as defined by STRUCTURE at K = 3.
![Figure 3. Neighbour-joining (NJ) tree between 36 H. triquetrifolium individuals based on Nei’s (1972) [Citation44] genetic distance calculated using 7 ISSR markers. Individual ID was coded based on the location : A1, A2, A3, A4, A5 and A6 are individuals from Zaghouan; B1, B2, B3, B4, B5 and B6 are individuals from El Aroussa; C1, C2, C3, C4, C5 and C6 are individuals from Le Krib; D1, D2, D3, D4, D5 and D6 are individuals from Tastour; E1, E2, E3, E4, E5 and E6 are individuals from Mjez El Bab; F1, F2, F3, F4, F5 and F6 are individuals from Touiref. Individuals were colour-coded by genetic subpopulations as defined by STRUCTURE at K = 3.](/cms/asset/ba1683f7-fed8-4657-976f-7c5593ebaa06/tbeq_a_1977180_f0003_c.jpg)
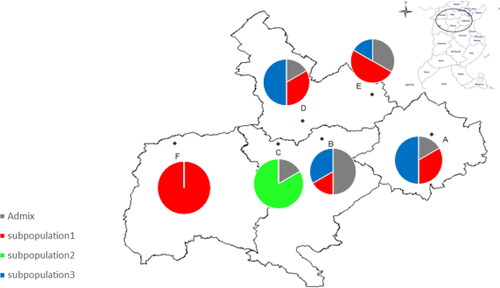
Figure 4. Genetic composition of Tunisian H. triquetrifolium populations at each of the 6 sampling locations. A: Zaghouan, B: El Aroussa, C: Le Krib, D: Tastour, E: Mjez El Bab, F: Touiref. Six individuals were genotyped at each location and individuals were colour-coded by genetic subpopulations as defined by STRUCTURE at K = 3.
Discussion
Morphological and genetic markers have become the most important tools for plant conservation and plant breeding applications and for assessing diversity levels, population structure and plant evolutionary process [Citation56–58]. H. triquetrifolium is an ecologically and economically important plant species, with an increasing interest as an alternative source of hypericin and pseudohypericin, secondary metabolites known for their antidepressant, antiviral, antibacterial and antitumor properties [Citation18,Citation19]. However, limited studies are currently available on H. triquetrifolium genetic diversity and phylogenetic relationship between individuals and populations [Citation25,Citation26,Citation36,Citation59,Citation60]. Additionally, African Hypericum species are still poorly represented in worldwide phylogenetic studies [Citation36]. In this study, we analysed Tunisian H. triquetrifolium populations, collected from 6 geographic locations, using 10 morphological traits and 7 ISSR markers.
Several previous worldwide phylogenetic studies within Hypericum genus were carried out. These studies revealed the phylogenetic and morphological relationships between members of the genus and, the complex evolutionary history and lineage divergence of Hypericum species, including a cold induced diversification and accelerated speciation rates in the Hypericum genus [Citation25,Citation26,Citation36,Citation59–61]. In order to molecularly confirm the collected Tunisian specimens as H. triquetrifolium and situate them in relation with other known related species, sequence comparison of the ITS region of six individuals with 214 previously published sequences was performed. The phylogenetic analyses revealed that Tunisian H. triquetrifolium belongs to section 9, 9a, 9b and section 27, in accordance with the findings of Nürk et al. [Citation26]. Meseguer et al. [Citation36] also investigated the phylogeny of Hypericum genus using ITS sequences to understand the complex evolutionary history of the genus. According to their results, H. triquetrifolium clustered with some members of the group Euhypericum. In another genetic study conducted by Nürk et al. [Citation26], H. triquetrifolium clustered in the core of the Hypericum clade with some members of the sections 9, 9a, 9b, 9d and 9e in accordance with our study and with the phylogenetic analysis of Crockett et al. [Citation23]. In addition, Nürk and Blattner [Citation8] analysed the genus Hypericum in the aspects of morphological diversity. The results also showed that section 9, which H. triquetrifolium belongs to, clustered together with the apomictic species of the group Euhypericum in agreement with the morphological classification of Robson [Citation2].
According to ISSR and morphological diversity analyses, the Zaghouan population was found to have the highest genetic and morphological diversities. However, the lowest genetic diversity and the lowest morphological diversity were found at Touiref and Tastour populations, respectively. Additionally, the data measured revealed a lower genetic diversity than a morphological diversity, based on Shannon’s information index. The morphological features are polygenic and can be mostly altered by environmental factors [Citation55,Citation62]. Our results are in agreement with previous studies where Riazi et al. [Citation63] reported that Hypericum species had a high variability in morphological characteristics. Bagdonaite et al. [Citation64] also observed a vast ecological adaptation of Hypericum with a high morphological variability between populations. In our study, a moderate level of genetic diversity was also observed. Barcaccia et al. [Citation65] confirmed that facultative apomixis is the prevalent mode of reproduction in H. perforatum populations. The correlation between genetic diversity level and reproductive potential was reflected in some populations that were characterized by high number of genotypes and very low levels of apomixis [Citation4,Citation66]. We can suggest here that the facultative apomixis mode of reproduction observed in Hypericum species could explain the moderate level of genetic diversity in our study.
Overall H. triquetrifolium populations in Tunisia were revealed to be genetically structured with a high genetic differentiation; in agreement with previous analyses [Citation33]. We noted that population from Le Krib location was genetically distinct. In fact, from the Nei’s genetic distance, the pairwise Nm, the PCoA analysis and the STRUCTURE results based on ISSR markers, the population at Le Krib location showed a high differentiation and isolation from all the other populations. Because the genetic diversity was not performed on the same individuals than the morphological assessment, no conclusion can be done on the correlation between studied genetic and morphological traits. However, because the individuals sampled from Le Krib location did not present specific morphological traits but were genetically clustered, we can suggest here that no correlation between genetic and morphological traits should be expected. Several factors have been reported to affect the genetic diversity level and population structure such as mating/breeding system of species, reproductive potential, seed dispersal, pollination dynamics and founder event of the populations [Citation57,Citation67]. For example, inbreeding could have deleterious effects, leading to genetic erosion and fitness reduction in small outcrossing populations. Habitat fragmentation or degradation and loss in individuals might also be a serious problem on fragmented populations [Citation57,Citation65]. Additionally, anthropogenic effects, physical barriers (mountain, forests, geographical distance, roads and new established cities) also affect the genetic diversity and even the viability of the populations and their structure [Citation20,Citation56,Citation68,Citation69]. In our study, physical barriers such as a mountain and forests and specific local environment, could be the reason for this difference in the population at Le Krib location, which spreads in sub-humid habitats, while the other populations spread in upper semi-arid (El Aroussa, Tastour, Mjez El Bab and Touiref) or lower semi-arid (Zaghouan) zones. So far, no study has reported the genetic diversity of Tunisian H. triquetrifolium populations and its association with the geographic origin or distance. Our genetic diversity analysis and population structure results showed an East-West gradient: individuals sampled within the northwestern location (Le Krib and Touiref) were genetically more similar than individuals sampled within the northeastern location(Zaghouan, El Aroussa, Tastour, Mjez El Bab); and subpopulation 1 and subpopulation 2 were exclusively present in the northeastern location and northwestern location (Le Krib), respectively. Furthermore, we can suggest here that the H. triquetrifolium in Tunisia was at first probably endemic in Zaghouan (North-East), the population that showed the highest genetic diversity. In fact, the centre of diversity much likely constitutes the centre of origin for several plant species [Citation70]. From this lower semi-arid zone of Zaghouan, H. triquetrifolium could have spread toward the West side, to found populations in the upper semi-arid and sub-humid zones. The H. triquetrifolium populations at Le Krib (subpopulation 2) and Touiref (subpopulation 1), represented each by one genetic subpopulation, were probably founded from one establishment event each. In addition, our analyzes revealed subpopulation 3 as the most diverse and the most widespread subpopulation, and the close genetic proximity between subpopulation 3 and subpopulation 1. These results suggested that subpopulation 1 and subpopulation 2 were probably derived from subpopulation 3; the divergence (founder effect) of subpopulation 1 happened more recently than the divergence of subpopulation 2.
In this study, although an East-West genetic gradient was observed, no significant correlation (p = 0.09; Rxy = 0.109) between genetic diversity and geographic distance among H. triquetrifolium populations was revealed overall. Genotypes belonging to the same genetic subpopulation have been found in geographically distant locations (for example genotypes of subpopulation 1 were found in Mjez El Bab and Touiref) and genotypes belonging to distant genetic subpopulations have been found at the same geographic location (for example genotypes of subpopulation 1 and subpopulation 3 were found in Zaghouan, El Aroussa, Mjez El Bab and Tastour). In fact, high level of gene flows were observed between Zaghouan and El Aroussa (Nm = 10.369), and between Zaghouan and Tastour (Nm = 5.697). In addition, a much lower genetic variability between populations was revealed compared to within population. Several cultural practices, mainly the transport of cereal straw bales contaminated with H. triquetrifolium stems from one region to another, could be the principal factor for the spread of this invasive weed in Tunisia. However, Le Krib population presents a genetically distinct population because of its specific sub-humid micro-climate, its mountains/forest surroundings and its isolation by distance, reducing the gene flow between this location and the other regions within this outcrossing species. In fact, both northwestern locations, Le Krib and Touiref, are also characterized by higher altitudes (>450 m) than the other locations (<250 m). There altitude isolation could also explain their lower genetic diversities; each location was exclusively represented by individuals belonging to one genetic subpopulation. Morshedloo et al. [Citation29] assessed the genetic diversity in 10 natural populations of H. perforatum growing in Iran using ISSR markers, and no significant correlation between genetic and geographical factors was found. However, some studies investigated the chemical composition of some Hypericum species, including H. triquetrifolium, in Tunisia, and showed a correlation with the geographic locations [Citation13,Citation16]. In addition, Hosni et al. [Citation13] investigated the fatty acid composition of Tunisian H. triquetrifolium populations; the authors observed that six out of the nine populations exhibited a good correspondence between fatty acid composition and geographic origin.
Although investigations on Tunisian H. triquetrifolium were limited, there are some genetic studies on other Hypericum genus members [Citation30,Citation31,Citation71]. The pattern found here in the Tunisian H. triquetrifolium populations, i.e. a genetic structure not showing a complete geographic pattern, a high level of genetic differentiation, and a highest genetic diversity in the lower semi-arid zone, was also reflected in previous studies on other Hypericum species in Tunisia. In fact, Béjaoui et al. [Citation32] investigated the population structure and genetic diversity of 16 natural H. humisufum populations from different bioclimatic conditions and assessed the genetic variability by using isozymes. They observed high level of genetic diversity and heterozygosity within populations. Also, relatively high level of differentiation and restricted gene flow between the populations were observed. Researchers stated that the grouping of populations was not related to geographic region and/or climatic factors and this divergence could have resulted from habitat fragmentation and outcrossing. When using RAPD markers to assess genetic diversity among and within seven H. humisufum populations from Tunisia, Béjaoui et al. [Citation71] also showed an overall high level of genetic differentiation and limited gene flow among populations. The sub-humid zone (represented by Edkhila) was also genetically distinct using RAPD markers with the lowest genetic diversity (based on Shannon diversity index and percentage of polymorphism) and was closely related with one population from the lower semi-arid zone. Béjaoui et al. [Citation32] also suggested that the variation among H. humisufum populations was due to bioclimatic zones: semi-arid and lower semi-arid zones showing the lowest and highest level of genetic diversity (for number of alleles per polymorphic loci, mean PPL and observed heterozygosity), respectively. These results suggest that, similarly to H. triquetrifolium (in our study), H. humisufum populations could have also evolved by founder effect from lower semi-arid zones.
Conclusions
In this study, we aimed to investigate the morphological and genetic diversities of H. triquetrifolium populations in Tunisia. The results based on ISSR and ITS data indicated (i) a moderate overall genetic diversity level; (ii) a significant genetic differentiation, with Le Krib population (sub-humid climate) grouped in a single subpopulation, divergent from the two other genetic subpopulations; (iii) a variable level of gene flow between populations (high between Zaghouan and El Arroussia, and low between Touiref and Le Krib) and between genetic subpopulations (high between subpopulation 1 and 3, and low between subpopulation 2 and 3); (iv) a low association of population structure with geographic origin of the individuals; and (v) phylogenetically, H. triquetrifolium clustered within 9, 9a, 9b and section 27 of the Hypericum genus. In addition, the morphological analysis indicated that (i) the diversity based on morphological traits was higher than the diversity based on ISSR data; (ii) the individuals from Zaghouan location were the most diverse morphologically, in agreement with genetic results based in ISSR markers and suggesting that Zaghouan (lower semi-arid bio-climate) is the most probable zone of origin of the H. triquetrifolium populations in Tunisia; (iii) the individuals from Le Krib location were not differentiated morphologically from the individuals of other five locations, despite of their genetic divergence compared to them; (iv) the morphological traits appeared to be more complex and therefore more difficult to reveal the population structure than the ISSR markers. All these results could highly contribute to the control and the conservation of H. triquetrifolium populations in Tunisia and the genomic pool of the species worldwide. Therefore, further genetic investigations must be done such as on chromosome and ploidy variations, and on reproduction habits. Additionally, a more exhaustive sampling could help us to confirm our findings and get a better picture of the genetic diversity of H. triquetrifolium in Tunisia.
Author contributions
Conceptualization, Jenfaoui Houda and Souissi Thouraya; Formal analysis, Uras M. Emin and Bahri Bochra; Investigation, Jenfaoui Houda; Methodology, Jenfaoui Houda, Uras M. Emin and Souissi Thouraya ; Software, Uras M. Emin and Bahri Bochra; Supervision, Souissi Thouraya ; Writing – original draft, Jenfaoui Houda and Uras M. Emin; Writing – review & editing, Bahri Bochra, Ozyigit Ibrahim Ilker and Souissi Thouraya. All authors have read and agreed to the published version of the manuscript.
Supplemental Material
Download PDF (357.2 KB)Supplemental Material
Download PDF (159.6 KB)Disclosure statement
No potential conflict of interest was reported by the authors.
Data availability statement
The authors confirm that the data supporting the findings of this study are available within the article and its supplementary materials.
Related Research Data
References
- Robson NKB. Studies in the genus Hypericum L. (guttiferae).4(2). section 9. Hypericum sensu lato (part 2): subsection 1. Hypericum series 1, Hypericum. Bulletin of the Natural History Museum. London (Botany). 2002;32:61–123.
- Robson NKB. Hypericum botany Hypericum: the genus Hypericum. In: Ernst E, editor. Medicinal and Aromatic Plants. London: Taylor and Francis; 2003. p. 1–22.
- Crockett SL, Robson NK. Taxonomy and chemotaxonomy of the genus Hypericum. Med Aromat Plant Sci Biotechnol. 2011;5(Special Issue 1):1–13.
- Koch MA, Scheriau C, Betzin A, et al. Evolution of cryptic gene pools in Hypericum perforatum: the influence of reproductive system and gene flow. Ann Bot. 2013;111(6):1083–1094.
- Bale S. Poisoning of sheep and crow by the weed Hypericum triquetrifolium. Rafuah Veterinarith. 1978;35:36.
- Parsons C. Noxious weeds of Australia. Melbourne: Inkata Press; 1992. p. 692.
- Pottier-Alapetite GF, de la T. Angiospermes dicotyledones. Apetales-Dialypetales. I.O.R. Tunis, Tunisia: Ministry of Higher Education and Scientific Research and the Ministry of Agriculture; 1979. 654 pp.
- Nürk NM, Blattner FR. Cladistic analysis of morphological characters in Hypericum (Hypericaceae). Taxon. 2010;59(5):1495–1507.
- Şenkal BC. The role of secondary metabolites obtained from medicinal and aromatic plants in our lives. ISPEC J Agric Sci. 2020;4(4):1071–1079.
- Conforti F, Statti GA, Tundis R, et al. Antioxidant activity of methanolic extract of Hypericum triquetrifolium Turra aerial part. Fitoterapia. 2002;73(6):479–483.
- Bertoli A, Menichini F, Mazzetti M, et al. Volatile constituents of the leaves and flowers of Hypericum triquetrifolium Turra. Flavour Fragr J. 2003;18(2):91–94.
- Alali F, Tawaha K, Al-Eleimat T. Determination of hypericin content in Hypericum triquetrifoliurn Turra (Hypericaceae) growing wild in Jordan. Nat Prod Res. 2004;18(2):147–151.
- Hosni K, Msâada K, Marzouk B. Comparative study on Hypericum triquetrifolium Turra. fatty acids. Asian J Plant Sci. 2007;6(2):384–388.
- Ayan AK, Cırak C. Variation of hypericins in Hypericum triquetrifolium Turra growing in different locations of Turkey during plant growth. Nat Prod Res. 2008;22(18):1597–1604.
- PilepíC KH, MorovíC M, Orač F, et al. RFLP analysis of cpDNA in the genus Hypericum. Biologia. 2010;65(5):805–812.
- Rouis Z, Abid N, Koudja S, et al. Evaluation of the cytotoxic effect and antibacterial, antifungal, and antiviral activities of Hypericum triquetrifolium Turra essential oils from Tunisia. BMC Complement Altern Med. 2013;13:11–24.
- Tian J, Zhang F, Cheng J, et al. Antidepressant-like activity of adhyperforin, a novel constituent of Hypericum perforatum L. Sci Rep. 2014;4:5632.
- Azeez H, Ibrahim K, Pop R, et al. Changes induced by gamma ray irradiation on biomass production and secondary metabolites accumulation in Hypericum triquetrifolium Turra callus cultures. Ind Crops Prod. 2017;108:183–189.
- Cirak C, Radusiene J, Janulis V, et al. Phenolic constituents of Hypericum triquetrifolium Turra (Guttiferae) growing in Turkey: variation among populations and plant parts. Turk J Biol. 2011;35:449–457.
- Young A, Boyle T, Brown T. The population genetic consequences of habitat fragmentation for plants. Trends Ecol Evol. 1996;11(10):413–418.
- Alonso MÁ, Agulló JC, Villar JL, et al. Taxonomic relationships in the Hypericum ericoides aggregate (H. sect. Coridium, hypericaceae). Ann Bot Fenn. 2013;50(3):195–207.
- Rouis Z, Ben Farhat M, Kchouk ML. Etude de la variabilité morphologique chez quatorze populations d’Hypericum triquetrifolium Turra. Rev Régions Arides. 2007;2:652–659.
- Crockett SL, Douglas AW, Scheffler BE, et al. Genetic profiling of Hypericum (St. John’s wort) species by nuclear ribosomal ITS sequence analysis. Planta Med. 2004;70(10):929–935.
- Heenan PB. Three newly recognised species of Hypericum (Clusiaceae) from New Zealand. New Zealand J Bot. 2008;46(4):547–558.
- Park SJ, Kim KJ. Molecular phylogeny of the genus Hypericum (Hypericaceae) from Korea and Japan: evidence from nuclear rDNA ITS sequence data. J Plant Biol. 2004;47(4):366–374.
- Nürk NM, Madriñán S, Carine MA, et al. Molecular phylogenetics and morphological evolution of St. John’s wort (Hypericum; Hypericaceae). Mol Phylogenet Evol. 2013;66(1):1–16.
- Farooq S, Siddiqui MA, Ray PC, et al. Genetic diversity analysis in the Hypericum perforatum populations in the Kashmir valley by using inter-simple sequence repeats (ISSR) markers. Afr J Biotechnol. 2013;13(1):18–31.
- Techen N, Parveen I, Pan Z, et al. DNA barcoding of medicinal plant material for identification. Curr Opin Biotechnol. 2014;25:103–110.
- Morshedloo MR, Moghadam MRF, Ebadi A, et al. Genetic relationships of Iranian Hypericum perforatum L. wild populations as evaluated by ISSR markers. Plant Syst Evol. 2015;301(2):657–665.
- Hocaoglu-Ozyigit A, Ucar B, Altay V, et al. Genetic diversity and phylogenetic analyses of Turkish cotton (Gossypium hirsutum L.) lines using ISSR markers and chloroplast trnL-F regions. J Nat Fibers. 2020:1–14.
- Smelcerovic A, Verma V, Spiteller M, et al. Phytochemical analysis and genetic characterization of six Hypericum species from Serbia. Phytochemistry. 2006;67(2):171–177.
- Béjaoui A, Boulila A, Messaoud C, et al. Genetic diversity and population structure of Hypericum humifusum L. (Hypericacae) in Tunisia: implications for conservation. Plant Biosyst. 2010;144(3):592–601.
- Afef B, Chokri M, Mohamed B. Genetic structure of natural Tunisian Hypericum humifusum L. (Hypericacae) populations as assessed by allozymes and RAPDs. Ind Crops Prod. 2012;35(1):217–223.
- Al-Rifaee MK, Aburjai T, Haddad N. Hypericin from Hypericum triquetrifolium in wild and under cultivation: variation revealed by genetic distance. Pharmacogn Mag. 2010;6(22):973–1296.
- Roblek M, Germ M, Troit Sedej T, et al. Morphological and biological variations in St. John’s wort, Hypericum perforatum L., growing over altitudinal and UV-B radiation gradients. Period Biol. 2008;3(110):257–262.
- Meseguer AS, Aldasoro JJ, Sanmartín I. Bayesian inference of phylogeny, morphology and range evolution reveals a complex evolutionary history in St. John’s wort (Hypericum). Mol. Phylogenet. Evol. 2013;67(2):379–403.
- Peakall R, Smouse PE. GenAlEx 6.5: genetic analysis in excel. Population genetic software for teaching and research-an update. Bioinformatics. 2012;28(19):2537–2539.
- White T, Bruns T, Lee S, et al. Amplification and direct sequencing of fungal ribosomal RNA genes for phylogenetics. In: Innis MA, Gelfand HD, Sninsky JJ, White TJ, editors PCR protocols: a guide to methods and applications. Vol. 18; 1990. p. 315–322. San Diego: Academic Press INC.
- Doyle JJ, Doyle JL. Isolation of plant DNA from fresh tissue. Focus. 1990;12:13–15.
- Thompson JD, Higgins DG, Gibson TJ. CLUSTAL W: improving the sensitivity of progressive multiple sequence alignment through sequence weighting, position-specific gap penalties and weight matrix choice. Nucleic Acids Res. 1994;22(22):4673–4680.
- NCBI. The National Center for Biotechnology Information. Available from: https://www.ncbi.nlm.nih.gov/ Last accessed date: May 21, 2020.
- Nürk NM, Michling F, Linder HP. Are the radiations of temperate lineages in tropical alpine ecosystems preadapted ?Global Ecol Biogeogr. 2018;27(3):334–345.
- Nürk NM, Scheriau C, Madriñán S. Explosive radiation in high Andean Hypericum rates of diversification among new world lineages. Front Genet. 2013;4:175.
- Nei M. Genetic distance between populations. Am Nat. 1972;106(949):283–292.
- Kumar S, Stecher G, Li M, et al. MEGA X: molecular evolutionary genetics analysis across computing platforms. Mol Biol Evol. 2018;35(6):1547–1549.
- Reddy PM, Sarla N, Siddiq EA. Inter simple sequence repeat (ISSR) polymorphism and its application in plant breeding. Euphytica. 2002;128(1):9–17.
- Roldàn-Ruiz I, Dendauw J, Van Bockstaele E, et al. AFLP markers reveal high polymorphic rates in ryegrasses (Lolium spp.). Mol Breed. 2000;6(2):125–134.
- Varshney RK, Chabane K, Hendre PS, et al. Comparative assessment of Est-SSR, Est-SNP and AFLP markers for evaluation of genetic diversity and conservation of genetic resources using wild, cultivated and elite barleys. Plant Sci. 2007;173(6):638–649.
- Ivanovych YI, Udovychenko KM, Bublyk MO, et al. ISSR-PCR fingerprinting of Ukrainian sweet cherry. Cytol Genet. 2017;51(1):40–47.
- R Core Team. R: a language and environment for statistical computing. Vienna, Austria: R Foundation for Statistical Computing; 2013. Available from: http://www.R-project.org/ last accessed date August 15, 2021.
- Mantel N. The detection of disease clustering and a generalized regression approach. Cancer Res. 1967;27:209–220.
- Rambaut A. FigTree v1.4.4; 2019. http://tree.bio.ed.ac.uk/software/figtree/ last accessed date August 15, 2021.
- Pritchard JK, Stephens M, Donnelly P. Inference of population structure using multilocus genotype data. Genetics. 2000;155(2):945–959.
- Falush D, Stephens M, Pritchard JK. Inference of population structure using multilocus genotype data: linked loci and correlated allele frequencies. Genetics. 2003;164(4):1567–1587.
- Ashraf J, Malik W, Iqbal MZ, et al. Comparative analysis of genetic diversity among Bt cotton genotypes using Est-SSR, ISSR and morphological markers. J Agric Sci Technol. 2016;18(2):517–531.
- Filiz E, Birbilener S, Ozyigit II, et al. Sakinoglu Oruc F. C. Assessment of genetic variations of silver lime (Tilia tomentosa Moench.) by RAPD markers in urban ecosystem. Biotechnol Biotechnol Equip. 2015;29(4):631–636.
- Govindaraj M, Vetriventhan M, Srinivasan M. Importance of genetic diversity assessment in crop plants and its recent advances: an overview of its analytical perspectives. Genet Res Int. 2015;2015:431487.
- Filiz E, Uras ME, Ozyigit II, Sen U, et al. Genetic diversity and phylogenetic analyses of turkish rice varieties revealed by ISSR markers and chloroplast trnl-F region. Fresenius Environ Bull. 2018;27:8351–8358.
- Nürk NM, Uribe-Convers S, Gehrke B, et al. Oligocene niche shift, miocene diversification–cold tolerance and accelerated speciation rates in the St. John’s worts (Hypericum, Hypericaceae). BMC Evol Boil. 2015;15(1):80.
- Zeliou K, Koui EM, Papaioannou C, et al. Metabolomic fingerprinting and genetic discrimination of four Hypericum taxa from Greece. Phytochemistry. 2020;174:112290.
- Dogan G, Yilmaz A, Bagci E, et al. Molecular phylogeny of section Drosanthe (Spach) Endl. (Hypericum L.) inferred from chloroplast genome. Pak J Bot. 2017;49(6):2235–2242.
- Velu D, Ponnuvel KM, Muthulakshmi M, et al. Analysis of genetic relationship in mutant silkworm strains of Bombyx mori using inter simple sequence repeat (ISSR) markers. J Genet Genomics. 2008;35(5):291–297.
- Riazi A, Majnoun Hosseini N, Naghdi Badi H, et al. The study of morphological characteristics of St. John’s wort (Hypericum perforatum L.) populations in Iran’s natural habitats. J Med Plants. 2011;39(10):49–64.
- Bagdonaite E, Zygmunt B, Radusiane J. Morphological and chemical evaluation of St. John’s wort (Hypericum perforatum L.) populations from Lithuania. Herba Pol. 2001;47:294–303.
- Can H, Kal U, Ozyigit II, et al. Construction and characteristics of some special breeding populations and their high throughput molecular screening methodologies in horticultural perspective. J Genet. 2019;98(3):86.
- Barcaccia G, Arzenton F, Sharbel TF, et al. Genetic diversity and reproductive biology in ecotypes of the facultative apomict Hypericum perforatum L. Heredity (Edinb). 2006;96(4):322–334.
- Coleman M, Abbott RJ. Possible causes of morphological variation in an endemic Moroccan groundsel (Senecio leucanthemifolius var. casablancae): evidence from chloroplast DNA and random amplified polymorphic DNA markers. Mol Ecol. 2003;12(2):423–434.
- Lowe AJ, Boshier D, Ward M, et al. Genetic resource impacts of habitat loss and degradation; reconciling empirical evidence and predicted theory for neotropical trees. Heredity (Edinb). 2005;95(4):255–273.
- Altay V, Ozyigit II, Yarci C. Urban flora and ecological characteristics of the kartal district (Istanbul); a contribution to urban ecology in Turkey. Sci Res Essays. 2010;5(2):183–200.
- Engels JMM, Ebert AW, Thormann I, et al. Centres of crop diversity and/or origin, genetically modified crops and implications for plant genetic resources conservation. Genet Resour Crop Evol. 2006;53(8):1675–1688.
- Béjaoui A, Boulila A, Messaoud C, et al. Population genetic structure of Tunisian Hypericum humifusum assessed by RAPD markers. Biologia. 2011;66(6):1003–1010.