
Abstract
Proteolytic enzymes are crucial for numerous biological processes and are tightly controlled by specific inhibitors. In addition to the research activities to investigate the natural effects of these inhibitors, it is important to determine the inhibition capabilities of inhibitors due to their importance in different fields, including food and health industry. In this study, we describe a high-throughput adaptable screening method to detect inhibitors and compare their inhibition efficiency at nanogram levels, using a Competitive enzyme-linked immunosorbent assay (ELISA) based Trypsin Inhibition Assay (E-CTIA). We worked with four different inhibitors from different sources and action mechanisms, all of which were competitive inhibitors. The half-maximal inhibitory concentration (IC50) strongly correlated with the experimental inhibition capacities introduced in the user manuals. E-CTIA successfully fulfills the requirements of an assay, such as reproducibility, low cost, low sample requirement and ease of use. It also enables to test multiple samples simultaneously in a short time, and it has the potential to be adapted to bigger plate formats such as 384 well or even bigger. Besides being the first successful example of Competitive ELISA Based Inhibition Assay, it has the potential to be used for many competitive inhibitors.
Abbreviations used
| E-CTIA | = | ELISA based Competitive Trypsin Inhibition Assay |
| SBTI-Kunitz-1 | = | Kunitz type soybean trypsin from Glycine max (Sigma, T9003) |
| SBTI-Kunitz-2 | = | Kunitz type soybean trypsin from Glycine max (Sigma T9128) |
| SBTI-Bowman-Birk | = | Bowman-Birk soybean trypsin inhibitor from Glycine max (Sigma T9777) |
| CETI-Kazal: Kazal-like domain | = | chicken egg trypsin inhibitor from chicken egg white (Sigma, T9253) |
Introduction
Trypsin is a versatile serine protease present in the human body. As it is able to trigger several irreversible mechanisms, is tightly regulated by many natural trypsin inhibitors [Citation1]. These natural inhibitors, as well as the artificial ones have often been used in therapeutic or research studies for cancer and numerous other diseases [Citation2,Citation3]. The design and development of new trypsin inhibitors is still an active research topic and, consequently, methods for high throughput screening are required to expedite the development pipelines [Citation4]. Furthermore, trypsin inhibitors in food products have been considered a key anti-nutritional factor, while levels of trypsin inhibition activity have been an important quality parameter [Citation5]. Therefore, determination of the inhibition capabilities is important to evaluate inhibitors in different fields, including health, research and food industry.
In this study, we describe a fast and sensitive assay for the detection of nanogram quantities of protease inhibitors, using an Enzyme-Linked Immunosorbet Assay (ELISA) based Competitive Trypsin Inhibition Assay (E-CTIA), a method for evaluation and/or comparison of inhibitors efficiency.
Material and methods
Chemical reagents and equipment
Most chemical reagents, such as buffers and salts, were purchased from Sigma Aldrich (St. Louis, MO, USA). Trypsin inhibitor from chicken egg white (CETI Kazal) (Sigma, T9253), Soybean Trypsin inhibitors from Glycine max (SBTI-Kunitz-1, Sigma T9003; SBTI-Kunitz-2, Sigma T9128; SBTI-Bowman-Birk, Sigma T9777) and Human recombinant trypsin (RayBiotech, 228-13214-3) were used for assay development. All the protein solutions were prepared in phosphate buffered saline (PBS: 10 mmol/L K2HPO4, 10 mmol/L KH2PO4, 0.15 mol/L NaCl, pH 7.2). In-house developed MAM-6G7 anti-trypsin antibody was used in assay development.
ELISA readings were done with a Biotek Synergy HT microtiter plate reader controlled with the GEN5 standard software package from BioTek Instruments (Winooski, VT, USA).
Assay design
Competitive ELISA [Citation6] was modified to design E-CTIA using immobilized inhibitors instead of immobilized antibodies. The method is based on two inhibitors, one of which is immobilized on an ELISA plate surface as a ‘capture inhibitor’ (, Step1) and the other one, which will be referred to as ‘competing inhibitor’, is in the solution. The competing inhibitor is mixed with a spiked trypsin and they are incubated on the ELISA well coated with the capture inhibitor. In this setup, the competing inhibitor and the capture inhibitor compete to bind to the soluble trypsin. The amount of trypsin interacting with the competing inhibitor is washed away and the rest is captured by the immobilized inhibitor, which remains on the ELISA well surface (, Step2). The trypsin bound to the capture inhibitor on the ELISA well was detected with an anti-trypsin antibody (MAM-6G7, inhouse developed antibody) (, Step3).
Figure 1. Scheme of the E-CTIA. Step1. Capture inhibitor coating and blocking, Step2. Sample Loading, Step3. Detection.
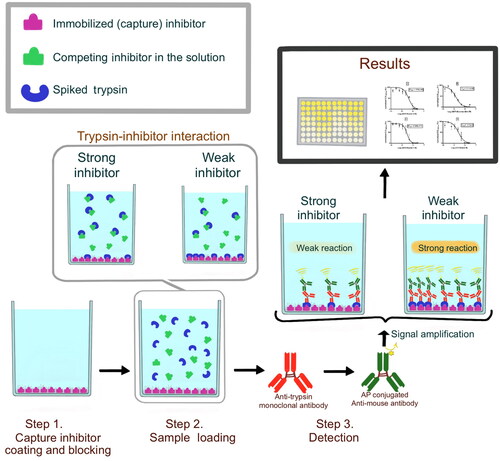
ELISA plates were coated with 2 µg/mL trypsin inhibitor in PBS (100 µL/well) and blocked with 1% Casein, 1,5% PVP in PBS for 1 h at 37 °C, then washed off three times with PBST. Inhibitor solutions titrated with trypsin (Trypsin stock conc. 1 µg/mL and reaction total volume 100 µL) were incubated for 1 h at 37 °C, then washed off three times with PBST. Detection of captured-trypsin was done by anti-trypsin antibody MAM-6G7 and visualized by goat anti-mouse IgG labeled with alkaline phosphatase as a secondary antibody and p-nitrophenyl phosphate (PNPP, Sigma A4744). Optical density at 405 nm was recorded with a multiplate reader (Biotek Synergy HT, Winooski, VT, USA).
Plate coating with trypsin inhibitor
To select the best inhibitor to be utilized in the immobilization, each of the four inhibitors selected in this study was tested in combination with each other. For this purpose, four inhibitors: CETI-Kazal, SBTI-Kunitz-1, SBTI-Kunitz-2, SBTI-Bowman-Birk were immobilized and an 0.1 µg/mL solution of the same four inhibitors was used as a competing inhibitor in the soluble phase, covering the sixteen possible combinations. The assays were performed as described in the assay design section.
Determination of the capture inhibitor and optimum trypsin concentration
The sandwich ELISA [Citation6], modified by using an immobilized inhibitor instead of an immobilized antibody, was used for the optimization studies of E-CTIA to evaluate the trypsin detection signal without inhibitor competition. For that, Inhibitors in PBS (2 µg/mL trypsin inhibitor, 100 µL/well) were coated onto ELISA plates and blocked as described previously. 1.5, 1.0, 0.75, 0.5, 0.3, 0.2 and 0.10 µg/mL trypsin solutions (volume 100 µL) were loaded in the ELISA plates and incubated for 1 h at 37 °C, then washed off three times with PBST. Detection and visualization of the captured trypsin were performed as explained in the assay design section.
Curve fitting
All experiments were repeated three times and standard deviation values were calculated. Error bars in all graphs represent standard deviation (±SD). All curve-fitting operations were performed using Graphpad Prism Version 7. For half-maximal inhibitory concentration (IC50) analysis, a sigmoidal dose-response (variable slope) curve fit was used based on the standard 4-parameter logistic equation.
Results
In this assay, samples containing a competing inhibitor were serially diluted in trypsin solutions and then added to the capture inhibitor immobilized wells. The inhibitors (both in the sample and immobilized in the ELISA plate) were expected to compete to bind to the trypsin. After one hour of incubation, the system reached equilibrium so that some of the trypsin was bound to the capture inhibitor immobilized in the test well and some was bound to the competing inhibitor. The amount of trypsin withheld by the capture inhibitor depends on the potency of the competing inhibitor. The trypsin molecules that were bound to immobilized inhibitor were detected by the trypsin specific antibody, similar to an ELISA protocol.
The optimum conditions for the assay were determined by comparison of different capture inhibitors in terms of signal intensity, linearity and reproducibility. After optimization of the conditions, IC50 values of CETI-Kazal, SBTI-Kunitz-1, SBTI-Kunitz-2, SBTI-Bowman-Birk inhibitors were calculated and the trypsin inhibition activities were compared with theoretical values.
Optimization of E-CTIA
Since the assay is based on the substitution of a capture antibody with a capture inhibitor, the effect of the different capture inhibitors on signal change was tested before the optimization of the other method parameters.
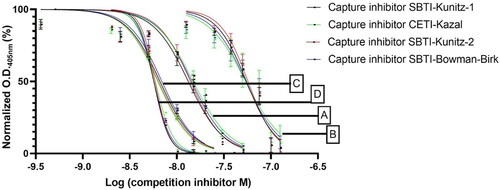
In order to determine the effect of the type of capture inhibitor (CETI-Kazal, SBTI-Kunitz-1, SBTI-Kunitz-2, SBTI-Bowman-Birk) on the performance of the overall system, ELISA plates were coated with each of them. The data were normalized as percent saturation (Normalized OD405 nm, %) for a more accurate comparison. The normalized data of different inhibitor concentrations incubated with a fixed concentration of trypsin is plotted on . The results in showed that the capture inhibitor did not affect the inhibition percentage significantly, in a dose-dependent manner. also shows that the determinant of this interaction is the inhibition capacity of the competing inhibitor and indicates that the developed system has potential to be a tool for the evaluation of soluble inhibitors.
Figure 2. Inhibition curves obtained by E-CTIA on different capture inhibitors. Different colors (black, green, red, blue) represent different capture inhibitors and different letters (A–D) represent different competing inhibitors: SBTI-Kunitz-2 (A); SBTI-Bowman-Birk (B); SBTI-Kunitz-1 (C); CETI-Kazal (D).
After revealing that the competitive inhibitor is the main player that affects the results, further optimization studies were done to develop a system that accurately evaluates and compares the inhibition efficacies of the inhibitors. In optimization studies, trypsin concentration and capture inhibitor combinations were put under the spotlight.
To select a capture inhibitor for the assay, the signal curve of each inhibitor was evaluated in changing trypsin concentrations.
First of all, we screened the candidate capture inhibitors to select the one which shows higher sensitivity in lower trypsin concentrations. We aimed to determine the lowest concentration of trypsin which caused a detectable and significant change in signal. Signal change as a function of trypsin concentration was plotted for every inhibitor and shown in .
Figure 3. Obtained O.D. signals against trypsin concentration plots of each capture inhibitor.
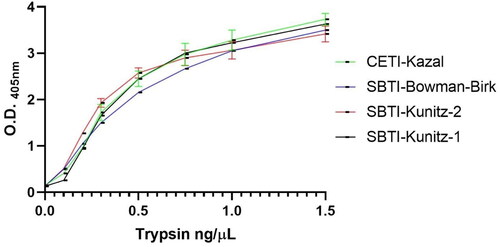
We aimed to use the lowest possible concentration of Trypsin resulting in a detectable signal intensity both in order to increase the sensitivity of the assay and also to avoid probable intra-assay proteolytic activity of the enzyme in the following steps of the assay. Our target signal intensity was in the range of 1–2 in the optical density measurements at 405 nm.
The inhibitor with the highest intensity of signal obtained by the lowest amount of trypsin was chosen as capture inhibitor and spiked trypsin concentration. In accordance with the results shown in , SBTI-Kunitz was chosen as the capture inhibitor and 0.3 µg/mL trypsin concentration.
Determination of IC50 values
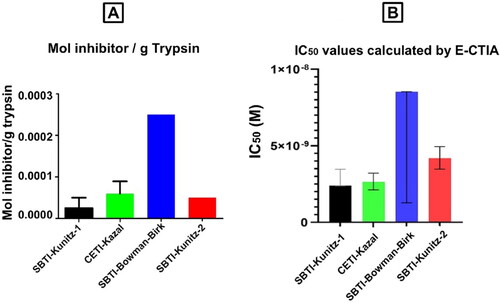
With SBTI-Kunitz-2 working as the capture inhibitor and in optimized conditions, the E-CTIA, described in the ‘Assay design’ section above, was applied to the four inhibitors. Curve-fitting operations were applied, to determine IC50 values, on normalized O.D.405 nm (% saturation) against the inhibitor concentration on a logarithmic scale. The following results, shown in , were obtained. According to the results shown in , the IC50 values of inhibitors are ordered as follows: SBTI-Kunitz-1 < CETI-Kazal < SBTI-Kunitz-2 < SBTI-Bowman-Birk. This comparison of IC50 values strongly correlates with the theoretical values reported in the product information supplied by the manufacturers ().
Figure 4. Inhibition curves obtained by E-CTIA and calculated IC50 value: SBTI-Kunitz-2 (A), SBTI-Bowman-Birk (B), SBTI-Kunitz-1 (C), CETI-Kazal (D).
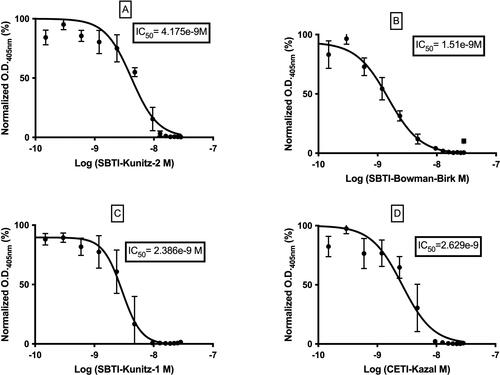
Figure 5. Comparison of inhibition efficiency reported by manufacturer (A) and E-CTIA calculated IC50 values (B).
Discussion
In this study, a Competitive ELISA based Trypsin Inhibition Assay (E-CTIA) was developed in order to facilitate inhibitor screening studies, especially in the food and pharmaceutical industries, by creating a simple, easy, reproducible and inexpensive inhibition comparison test. This test involves the competition of two trypsin inhibitors for trypsin. If the immobilized capture inhibitor wins the battle, trypsin is captured to the surface and we can detect its presence with a labelled monoclonal antibody. Hence, we get a high OD405nm signal. However, if the competing inhibitor is stronger than the capture inhibitor and wins the battle, trypsin is washed away with it and cannot be detected on the surface. Therefore, a stronger competing inhibitor results in a lower OD405nm signal.
By measuring the OD405nm signal in response to varying concentrations of competing inhibitor, we calculated an indirect IC50 value. The calculated indirect IC50 corresponds to the concentration of competing inhibitor which displaces 50% of the specific binding of trypsin to the capturing inhibitor. As very well known, IC50 values are proportional to the mol of inhibitor per gram of trypsin. A lower IC50 value indicates stronger inhibitor and lower mol of inhibitor per gram of trypsin [Citation7]. Starting from this point, it was first explored how decisive the capturing inhibitor was in this competition. As a result of this analysis, we observed that the capture inhibitor did not make a significant difference. The main factor affecting the activity was the competing inhibitor. Then, the experimental conditions were optimized and IC50 measurements were made. The following IC50 order was obtained as a result of these measurements : SBT I-K uni tz -1 < CET I-K az al < SBT I- Ku nit z-2 < SBTI- Bowm an- Birk. This compa rison of IC50 values is prop ortional to the theor etical order reported in the product info rmation suppl d by the manufa ctu rers [Citation8–Citation11] ().
According to the authors’ research, this system is the first study to use the ELISA format to evaluate and compare competitive inhibitors.
One of the biggest advantages of the developed assay is that it does not require high amounts of enzyme and inhibitor. It is particularly important in research, development and optimization studies, as samples are generally limited and hence very valuable due to low scale production. The inhibitor and trypsin requirement of E-CTIA is in nanogram scale per reaction. The second big advantage is its potential to be transferred to bigger plate formats such as 384-well or even bigger. This feature enables comparison and evaluation of multiple inhibitors and samples at the same time.
In protease inhibitors research, trypsin inhibitors are among the most studied ones due to their importance in human metabolism [Citation12–Citation14], their usage as a drug candidate against many diseases, from obesity to cancer [Citation15–Citation18], and in food and feed safety because of their anti-nutritional impact [Citation19–Citation22].
Qualitative and quantitative determination of trypsin inhibition activity is very important in selection processes of newly developed inhibitors, evaluation of food products or optimization of the growth conditions of some plants. Consequently, many qualitative or quantitative methods were developed to assess trypsin inhibition activity. The methods are varied in their application, such as electrophoresis-based, nanoparticle-based, biosensor-based and substrate-enzyme reaction based methods [Citation23]. Two methods for comparative assessment of trypsin inhibition, one developed by Vineet Kumar et. al. [Citation22], which includes a native polyacrylamide gel electrophoresis (PAGE) step, and the other, a Lab-on-a-Chip (LoaC) method [Citation24], which includes also gel preparations, are time consuming for multiple applications. On the other hand, the method developed by Vineet Kumar et. al. is capable of assessing two different types of inhibitors [Citation22]. Meanwhile, the assay we developed, E-CTIA, which is an ELISA based system, has the advantage of running simultaneously another ELISA to detect a specific type of inhibitor.
Even though there are new methods for the assessment of trypsin inhibition activity, using BApNA (Nα-benzoyl-DL-arginine-p-nitroanilide hydrochloride) as the substrate to determine the tryptic activity change, due to presence of inhibitor, is still mainly used because of its low-cost application [Citation25–Citation28]. However, this method, like other substrate-based methods, is not practical for multiple sample assays and has low sensitivity. In another substrate–enzyme reaction based method, which uses copper and cytochrome c as a substrate, the sensitivity has been increased, but is relatively more expensive, when compared to E-CTIA [Citation29].
Although E-CTIA is developed to evaluate and compare competitive trypsin inhibitors, it is the first example of an easy, useful, low cost and applicable high throughput system that can be applied to other competitive inhibitors.
Conclusions
We developed a Competitive ELISA Based Inhibition Assay to evaluate and compare the inhibition efficiency of competitive trypsin inhibitors. It contains one immobilized capture inhibitor and one soluble competing inhibitor. The soluble competing inhibitor binds to more trypsin in accordance with its potency, causing it to be washed away from the surface accompanied by a decrease in the resulting signal. The method developed in this research is a powerful addition to inhibitor screening platforms to decrease the time and cost of the process. Our method shows reproducible results that are compatible with the trypsin inhibition activities reported in literature. It enables to test multiple samples simultaneously in a short time, and it has the potential to be adapted to bigger plate formats such as 384 well or even bigger. It successfully fulfills the requirements of a good analytical method, such as reproducibility, low cost, low sample requirement and ease of use. This is the first successful example of an ELISA Based Competitive Inhibition Assay, which has the potential to be used for competitive inhibitors of different enzymes.
Disclosure statement
No potential conflict of interest was reported by the authors.
Funding
This study was supported by TÜBİTAK 1003-SBAG, project number 115S124.
Data availability
The data used to support the findings of this study are included within the article.
References
- Schilling O, Biniossek ML, Mayer B, et al. Specificity profiling of human trypsin-isoenzymes. Biol Chem. 2018;399(9):997–1007.
- Bojkova D, Bechtel M, McLaughlin KM, et al. Aprotinin inhibits SARS-CoV-2 replication. Cells. 2020;30;9(11):2377.
- Cotabarren J, Broitman DJ, Quiroga E, et al. GdTI, the first thermostable trypsin inhibitor from geoffroea decorticans seeds. A novel natural drug with potential application in biomedicine. Int J Biol Macromol. 2020;148:869–879..
- Mannocci L, Melkko S, Buller F, et al. Isolation of potent and specific trypsin inhibitors from a DNA-encoded chemical library. Bioconjug Chem. 2010;21(10):1836–1841.
- Liu K. Soybean trypsin inhibitor assay: further improvement of the standard method approved and reapproved by American oil chemists’ society and American association of cereal chemists international. JAOCS. J Am Oil Chem Soc. 2019;96(6):635–645.
- Crowther J. Enzyme linked immunosorbent assay (ELISA). In: Walker JM, Rapley R, editors, Molecular biomethods handbook: 2nd ed. Part of the Springer protocols handbooks book series (SPH); 2008. pp. 657–682. Totowa, NJ USA: Humana Press.
- Aykul S, Martinez-Hackert E. Determination of half-maximal inhibitory concentration using biosensor-based protein interaction analysis. Anal Biochem. 2016;508:97–103.
- Sigma, Trypsin inhibitor from Glycine max (soybean). 2020. Available from: https://www.sigmaaldrich.com/catalog/product/sigma/t9003?lang=es®ion=ES.
- Sigma, Trypsin inhibitor from Glycine max (soybean). 2020. Available from: https://www.sigmaaldrich.com/catalog/product/sigma/t9128?lang=es®ion=ES.
- Sigma, Trypsin inhibitor from chicken egg white. 2020. Available from: https://www.sigmaaldrich.com/catalog/product/sigma/t9253?lang=es®ion=ES.
- Sigma, Trypsin-chymotrypsin inhibitor from Glycine max (soybean). 2020. Available from: https://www.sigmaaldrich.com/catalog/product/sigma/t9777?lang=es®ion=ES.
- Fei Fang E, Abd Elazeem Hassanien A, Ho Wong J, et al. Isolation of a new trypsin inhibitor from the faba bean (vicia faba cv. Giza 843) with potential medicinal applications. PPL. 2011;18(1):64–72.
- Fortelny N, Butler GS, Overall CM, et al. Protease-inhibitor interaction predictions: Lessons on the complexity of protein-protein interactions. Mol Cell Proteom. 2017;16(6):1038–1051.
- Rakash S. Role of proteases in cancer: a review. Biotechnol Mol Biol Rev. 2012;7(4):90–101.
- Kennedy AR. The evidence for soybean products as cancer preventive agents. J Nutr. 1995;125(3 Suppl):733S–7743.
- Henry D, Carless P, Fergusson D, et al. The safety of aprotinin and lysine-derived antifibrinolytic drugs in cardiac surgery: a Meta-analysis. CMAJ. 2009;180(2):183–193.
- Cristina Oliveira de Lima V, Piuvezam G, Leal Lima Maciel B, et al. Trypsin inhibitors: promising candidate satietogenic proteins as complementary treatment for obesity and metabolic disorders?J Enzyme Inhib Med Chem. 2019;34(1):405–419.
- Malicki S, Ksiazek M, Majewski P, et al. Development of a novel, high-affinity ssDNA trypsin inhibitor. J Enzyme Inhib Med Chem. 2019;34(1):638–643.
- Griffiths DW. The trypsin and chymotrypsin inhibitor activities of various pea (pisum spp.) and field bean (vicia faba) cultivars. J Sci Food Agric. 1984;35(5):481–486.
- Zhang Z, Wheatley CC, Corke H. Biochemical changes during storage of sweet potato roots differing in dry matter content. Postharvest biology and technology. 2002. Talanta. 2018;24(3):317–325.
- Makkar HPS, Francis G, Becker K. Bioactivity of phytochemicals in some lesser-known plants and their effects and potential applications in livestock and aquaculture production systems. Animal. 2007;1(9):1371–1391.
- Kumar V, Rani A, Shuaib M, et al. Comparative assessment of trypsin inhibitor vis-à-vis kunitz trypsin inhibitor and Bowman-Birk inhibitor activities in soybean. Food Anal Methods. 2018;11(9):2431–2437.
- Law ASY, Yeung MCL, Yam VWW. Arginine-Rich peptide-induced supramolecular self-assembly of water-soluble anionic alkynylplatinum(II) complexes: a continuous and label-free luminescence assay for trypsin and inhibitor screening. ACS Appl Mater Interfaces. 2017;9(47):41143–41150.
- Torbica AM, Živančev DR, Nikolić ZT, et al. Advantages of the lab-on-a-chip method in the determination of the kunitz trypsin inhibitor in soybean varieties. J Agric Food Chem. 2010;58(13):7980–7985.
- Gonçalves R, Soares S, Mateus N, et al. Inhibition of trypsin by condensed tannins and wine. J Agric Food Chem. 2007;55(18):7596–7601.
- Santos JF, Castro PF, Leal ALG, et al. Digestive enzyme activity in juvenile nile tilapia (Oreochromis niloticus, L) submitted to different dietary levels of shrimp protein hydrolysate. Aquacult Int. 2013;21(3):563–577.
- Dabhade AR, Mokashe NU, Patil UK. Purification, characterization, and antimicrobial activity of nontoxic trypsin inhibitor from Albizia amara boiv. Process Biochem. 2016;51(5):659–674.
- Li Q, Huang L, Luo Z, et al. Stability of trypsin inhibitor isolated from potato fruit juice against pH and heating treatment and in vitro gastrointestinal digestion. Food Chem. 2020;328:127152.
- Zhang S, Chen C, Qin X, et al. Ultrasensitive detection of trypsin activity and inhibitor screening based on the electron transfer between phosphorescence copper nanocluster and cytochrome c. Talanta. 2018;189:92–99.