
Abstract
The budding yeast Saccharomyces cerevisiae is a widely used model organism to investigate the changes occurring in the eukaryotic cell and to predict its possible ‘reaction’ to different environmental factors. Recently it was also shown that these microorganisms possess another advantageous ability: to ‘enter’ into quiescent state (G0). Yeast G0 cells have similar physiological characteristics to those of higher eukaryotes making them a better model for toxicology studies. As cadmium could affect severely human health, the main aim of the present study was to use Saccharomyces cerevisiae quiescent cells to investigate the resistance potential and corresponding adaptive response of eukaryotic cells to elevated cadmium concentrations. Both diploid and haploid yeast strains in logarithmic, quiescent and non-quiescent state were exposed to different concentrations of Cd(NO3)2. The half-maximal inhibitory concentration (IC50) for all tested cell types was 100 µmol/L Cd(NO3)2. The deleterious effects of cadmium on intracellular macromolecule structures were analyzed through evaluating the levels of accumulated reactive oxygen species (ROS) and carbonylated proteins. The highest ROS concentration was measured in logarithmic cells: up to 50% versus about 8% in G0 cells. Significant damage in protein molecules was observed in haploid cells where the protein carbonylation reached levels of 25 µmol/mg. Studying the adaptive response to elevated Cd2+ concentrations revealed that quiescent and non-quiescent cells respond with increased expression of key elements from the antioxidant defense system: reduced glutathione, superoxide dismutase (SOD) and catalase. Furthermore, an additional SOD izoenzyme was detected when diploid and haploid cell populations were exposed to Cd2+.
Introduction
Cadmium (Cd) is a soft white metal commonly present in nature and it could be found in ores together with zinc, copper and lead. In the last few decades, its concentration in mining wastes, soils and plants is rapidly rising due to its wide usage in various industrial processes, as an anticorrosive agent, a color pigment or in nickel-cadmium batteries production, as well as by non-regulated agricultural practices of soil enrichment with cadmium-containing phosphorus fertilizers [Citation1,Citation2]. In living organisms, cadmium is a trace element, but it also has regulatory functions in many metabolic processes. However, the high Cd concentration is toxic to cells and has a harmful effect on humans. Passing through the food chains, or after a prolonged exposure to it, Cd is accumulated in the human body and leads to serious diseases like itai-itai [Citation3–5]. It has been already shown that Cd exposure causes the imbalance of Zn, Mg and Cu in the body and urine [Citation6]. Elevated Cd concentrations often correlate with various health problems such as renal and hepatic dysfunction, ostial disorders, pulmonary edema, testicular damage, neurological disorders and damage to the adrenals and hematopoietic system [Citation7]. In addition, it has cytotoxic effects that could lead to apoptotic or necrotic events. Cadmium is a proven human carcinogen leading to lung, breast, prostate, pancreas, urinary bladder and nasopharyngeal cancers [Citation8]. Furthermore, Cd exposure affects human health at the cellular level and often correlates with oxidative stress and DNA damage [Citation9].
Yeasts Saccharomyces cerevisiae are one of the best-studied eukaryotic model organisms. They have often been successfully used for understanding the molecular mechanisms of cellular adaptive response to different environmental conditions, including the toxic effect of Cd in cells. Recently, using yeast cells it has been proven that elevated concentration of cadmium is probably responsible for various pathological conditions, such as neurodegenerative diseases and age-related disorders [Citation10]. In the last decade, it was also shown that these microorganisms possess another advantageous ability – to ‘enter’ into a specific cell cycle phase G0, or the so-called quiescent, or ‘sleeping’ state. The entry of Saccharomyces cerevisiae cells into G0 state is determined by environmental conditions and most of the time it is a result of cell division stopping in G1, but it could also happen in other cell cycle phases [Citation11]. During their ‘arrest’ in G0 state, cells acquire specific morphological, physiological and biochemical features such as higher resistance to starvation and harmful environmental conditions, non-replicative genome and reduced transcriptions and translations activity [Citation12]. Moreover, recent studies indicated the presence of ‘housekeeping genes’, essential for both proliferation and quiescence, common for both yeasts and higher eukaryotes [Citation13]. All these make the quiescent Saccharomyces cerevisiae cells a better model for investigating the cellular changes occurring during exposure to different environmental stresses. In this respect, the present study focused on exploring the level of molecular damage following exposure to high Cd concentrations and some corresponding survival strategies of quiescent Saccharomyces cerevisiae cells.
Materials and methods
Microorganisms, growth conditions and biomass
Two strains of budding Saccharomyces cerevisiae yeasts were used in the study, prototrophic diploid S. cerevisiae NBIMCC 584 and auxotrophic haploid S. cerevisiae BY4741 (MATa; his3Δ1; leu2Δ0; met15Δ0; ura3Δ0). Yeast cells were grown in a standard YPD medium (2% glucose, 1% yeast extract, 1% bacto-peptone; pH = 6.5) at 30 °C using a reciprocal shaker (204 rpm) for 168 h. Samples were withdrawn at exponential (20th h) and late stationary phase (168th h). Cells were harvested by centrifugation at 2740g for 10 min, and the pellets were washed twice with distilled water.
Isolation of G0 cells
The separation of quiescent (Q, G0) and non-quiescent (NQ) cells from stationary cultures was performed according to Allen et al. [Citation14] in Percoll gradient. The density gradient was formed from Percol and 1.5 mol/L NaCl in a 9:1 ratio (v/v) after centrifugation at 13,800 rpm (19,240g) for 15 min at 20 °C. Yeast biomass in stationary phase was suspended to optical density at 540 nm (OD540) of 200 (2 × 10⁹ cells/mL) in 0.1 mol/L Tris-HCl buffer, рН = 7.5. The obtained suspension was layered on to the formed gradient and centrifuged at 400g for 60 min at 20 °С. The resulting two layers of cell fractions, the denser one composed of G0 cells (lower fraction) and less dense fraction of NQ cells (upper fraction), were separately isolated. Both cell fractions were washed twice with 0.1 mol/L Tris-HCl buffer solution (рН = 7.5) and stored at 4 °C.
Yeast viability assay
Serial ten-fold dilutions of logarithmic, Q and NQ cell fractions were prepared from an initial sample with OD540 = 1.0 (corresponding to 108 cells/mL). The half-maximal inhibitory concentration (IC50) was determined using a spot assay. The yeast cells were grown on YPD solid medium supplemented with 50 µmol/L, 75 µmol/L, 100 µmol/L, 125 µmol/L, 150 µmol/L, 175 µmol/L or 200 µmol/L Cd(NO3)2. Cultivation was carried out at 28 °C for 5 days and results were recorded against control plates without addition of Cd(NO3)2.
Cd toxicity analysis
Logarithmic, Q and NQ cells (0.3 g biomass resuspended in 1 mL of 0.1 mol/L Tris Buffer, pH = 7.5) were treated with 100 µmol/L Cd(NO3)2 (IC50) at room temperature for 1 h. After incubation, the cells were washed twice with 0.05 mol/L potassium-phosphate buffer (pH = 7.8) and mixed with polyester beads (0.5 mm) (Sigma-Aldrich, Germany) at a ratio of 1:2:1 w/v/w (0.3 g biomass: 0.6 mL PPB: 0.3 g polyester beads). Mechanical disruption using Bullet Blender 24 Storm (Next Advance) cell was carried out at 8000 rpm, 5 times for 10 min. The cell debris and glass beads were removed by centrifugation at 2220g for 10 min and the obtained supernatants were clarified by centrifugation at 14,320g for 15 min at 4 °C. The resulting cell-free extracts were stored at minus −20 °C and used for biochemical analyses.
Biochemical analyses
The protein content in cell-free extracts was analyzed according to Lowry et al. [Citation15]. Bovine serum albumin (Sigma, St. Louis, MO, USA) was used as a standard. The concentration of reactive oxygen species (ROS) accumulated in cells was determined by the NBT-modified method of Kostova et al. [Citation16]. The level of carbonylated proteins was evaluated using the method described by Mesquita et al. [Citation17]. The intracellular concentration of reduced glutathione was measured according to Zhang [Citation18]. The superoxide dismutase (SOD) and catalase (CAT) enzyme activities were determined spectrophotometrically according to Beauchamp and Fridovich [Citation19] and Aebi [Citation20], respectively.
Native polyacrylamide gel electrophoresis
SOD and catalase (CAT) enzyme expression in control cells and cells treated with Cd(NO3)2 were studied by using 10% native vertical polyacrylamide gel electrophoresis (PAGE) (Mighty Small II Vertical electrophoresis system, Hoefer Scientific Instruments) performed according to the procedure described by Davis [Citation21]. SOD and catalase profiles were visualized using the methods of Misra and Fridovich [Citation22] and Selander et al. [Citation23], respectively. Differentiation between Cu/Zn and MnSOD isoenzymes was done via an inhibitory assay with 2 mmol/L KCN [Citation24].
Data analysis
The data were analyzed using Microsoft Office 365 Excel 2020 software. The spectrophotometric determinations represent the mean values with Standard error of the mean (±SEM) of three independent experiments. Differences in means were analyzed using Student’s t test with independent measures. Differences were considered statistically significant at the p < .05 level.
Results and discussion
Study of the Saccharomyces cerevisiae sensitivity to Cd(NO3)2
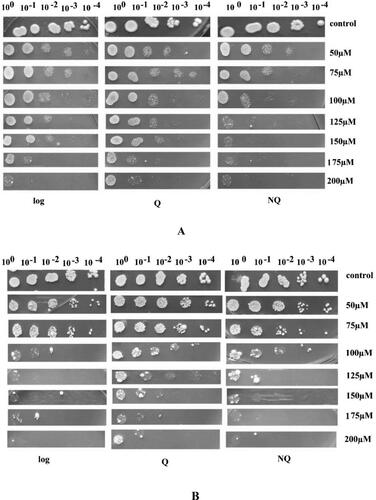
The effect of Cd2+ ions on cellular viability of S. cerevisiae cells in different physiological states (logarithmic, Q or NQ) were investigated. The IC50 was determined for both experimental strains, diploid (S. cerevisiae NBIMCC 584) and haploid (S. cerevisiae BY4741). The performed spot analyses () revealed that for both strains the different cell populations possess a relatively close Cd2+ resistance characteristics. The concentration of 175 µmol/L Cd(NO3)2 showed about 80% inhibitory effect on cellular viability for logarithmic, Q and NQ cells. This strong toxicity is most likely due to Cd-mediated generation of excessive reactive oxygen species (ROS) in the cells, their interaction with macromolecules, and impairment of cell proliferation [Citation25,Citation26]. Furthermore, during exposure to 200 µmol/L Cd(NO3)2 only a few cells survived and single colonies were observed only in quiescent state. Considering that G0 yeast cells do not proliferate, it could be suggested that entrance in quiescent state determines higher resistance to this toxic metal. Moreover, the recent investigations of Požgajová et al. [Citation27] revealed that cadmium-mediated cell damage in yeasts depends strongly on the Tor1 signaling. As in G0 the TOR pathway is downregulated, this could be also a prerequisite for the higher viability of these cells at elevated cadmium concentrations. The cells most sensitive to cadmium are the NQ cells, whose growth was already significantly impaired at 75 µmol/L of Cd(NO3)2. This observation is probably linked with the fact that NQ cells are heterogeneous, mainly composed of replicative older, apoptotic and senescent cells, and have lost their ability to proliferate [Citation14]. The comparison of sensitivity to cadmium for the three studied cell types of both S. cerevisiae strains revealed that IC50 was 100 µmol/L. The obtained results are in accordance with Pasternakiewicz [Citation28] and Petrova et al. [Citation29], who reported more than 50% growth inhibition of S. cerevisiae at concentrations above 100 µmol/L Cd(NO3)2.
Figure 1. Sensitivity of S. cerevisiae NBIMCC 584 (A) and S. cerevisiae BY4741 (B) logaritmic, Q and NQ cells to different concentration of Cd(NO3)2, where 10° is undiluted sample corresponding to OD540 = 1.0, followed by tenfold dilutions of the sample.
Effect of Cd2+ on cell redox-balance and protein carbonylation
Reactive oxygen species (ROS) levels in the cells can significantly affect their viability. The exposure to high concentration of heavy metal ions, like Cd2+, could lead to accumulation of extra intracellular ROS and could cause disturbances in the structure and functions of important macromolecules [Citation30, Citation31]. For this reason, the effect of Cd2+ on the ROS levels and the resulting carbonylation in the proteins side chains groups were studied (). Previously determined IC50 (100 µmol/L Cd(NO3)2) was applied.
Figure 2. Concentration of intracellular ROS in control cells (
 ) cells. S. cerevisiae 584 strain (A); S. cerevisiae BY4741 strain (B). Each value represents the mean ± SEM (n = 3). Significant differences (* p < .05; ** p < 0.01) are presented.
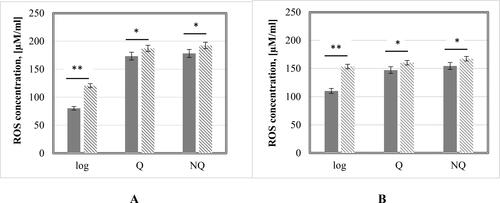
The results showed increased levels of intracellular ROS after treatment with 100 µmol/L Cd(NO3)2. The cells most susceptible to IC50 of Cd2+ were the logarithmic cells of both strains, showing more than 40% increase in ROS concentration. The intensive respiratory and metabolic processes in these cellular populations most probably lead to enhanced accumulation of ROS [Citation32]. Furthermore, the exposure of cells to high Cd2+ levels inhibited the cellular antioxidant system and consequently provoked de novo generation of additional ROS [Citation33]. In Q and NQ cells, the rise in ROS concentration was minimal, about 10–15 µM/mL higher in the treated cells. The comparative analysis between quiescent and NQ cells revealed higher amounts of ROS in the treated ones. This is not surprising considering the physiological state of these cells (additional ROS accumulation because of cell aging and a lack of nutrients in the medium) [Citation34]. However, an interesting fact was that G0 cells were characterized with the same level of ROS as the NQ cells. Probably, the established relative resistance of the quiescent cell population to higher Cd2+ concentration in this case could be explained with upregulation of specific cellular mechanisms allowing them to maintain a balanced intracellular redox homeostasis [Citation35].
The levels of protein carbonylation were analyzed as a marker for protein damage in response to the Cd2+-induced oxidative stress. The intracellular concentration of carbonyl groups in norma and after applying IC50 of Cd(NO3)2 was evaluated (). It is known that protein carbonylation is a process which occurs at the early stages of oxidative stress and is a reliable biomarker for ROS accumulation and disruptions in the cellular redox system [Citation36,Citation37]. As shown in , both experimental strains share the same protein carbonylation profiles after treatment with cadmium. The highest deviation in carbonyl groups concentration between treated cells and control ones were found at logarithmic phase: 61.5% and 46.8% increase for S. cerevisiae 584 and S. cerevisiae BY4741, respectively. These results correlated with the measured ROS levels. Both Q and NQ cells showed lower changes in carbonyl groups concentrations varying between 11% and 30%. Moreover, the values of protein carbonylation measured in the haploid Q cells of S. cerevisiae were about 43% higher than those determined in the diploid one. This result is in compliance with the investigations of other authors, showing that under certain stress conditions, cells with diploid genomes have increased fitness [Citation38,Citation39].
Figure 3. Protein carbonylation in control cells (
). S. cerevisiae 584 strain (A); S. cerevisiae BY4741 strain (B). Each value represents the mean ± SEM (n = 3). Significant differences (* p < .05; ** p < .001) are presented.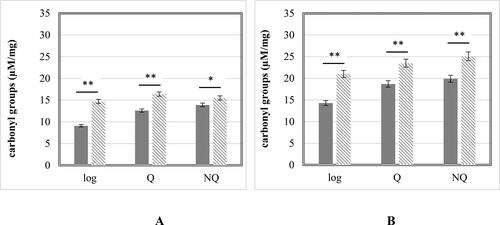
Influence of Cd2+ on cell antioxidant defense system
The antioxidant defense system plays a crucial role for ROS neutralization in cells and maintenance of their viability. To study the effect of Cd2+ on the antioxidant status of S. cerevisiae 584 and S. cerevisiae BY4741 strains, we were focused on the measurement of the reduced glutathione concentration, and on the activity of two of the major antioxidant enzymes, SOD and catalase.
The GSH:GSSG ratio has an important role in maintaining the cellular redox balance within certain limits [Citation40] and takes part in the process of Cd2+ detoxification in cells [Citation41]. The reduced glutathione concentrations were measured in cell-free extracts of control and Cd2+-exposed cells (). The comparative data analysis revealed that the treatment with 100 µmol/L Cd(NO3)2 affected the reduced glutathione status in the three cell populations of the studied S. cerevisiae strains. The highest intracellular GSH concentration was measured in the stationary NQ cells both before and after cadmium treatment for each experimental strain. Although the high GSH content is often linked to cell proliferation and its depletion emerges as a marker of cell differentiation [Citation42], in our case the intracellular glutathione was maximal in the stationary phase cells. This is a typical cell reaction to increased ROS concentrations due to aging of cells, insufficient nutrients and additional Cd2+ exposure, all these leading to the antioxidant system activation to keep the cells viable. Differences in the level of intracellular GSH were observed between the haploid and diploid S. cerevisiae strains. Lower concentrations of the tripeptide were detected in all cell types of the haploid BY4741 strain before and after Cd2+ exposure. In the treated logarithmic and NQ cells, the detected values of GSH were between 28.9% and 44.4% lower in comparison with the same type of cells of the diploid strain. Considering that the GSH function to neutralize ROS is required for the operation of stress tolerance mechanisms and efficient detoxification pathways [Citation42], the lower GSH concentrations could be an indication of lower resistance capacity of the haploid strain against Cd2+ induced oxidative stress.
Figure 4. Reduced glutathione concentrations in control cells (
). S. cerevisiae 584 strain (A); S. cerevisiae BY4741 strain (B). Each value represents the mean ± SEM (Standard error of the mean) (n = 3). Significant differences (* p < .05; ** p < .001) are presented.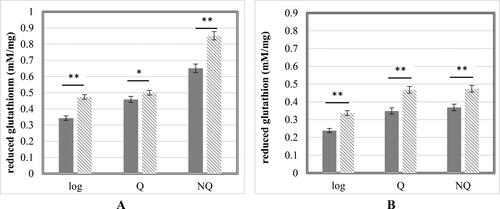
In addition to glutathione concentration, the specific total enzyme activity of SOD and catalase in cells were measured (). The cooperative action of both main antioxidant enzymes protects cells from ROS damage, especially under environmental stress which was provoked by Cd2+-exposure. We registered an increased specific enzyme activity levels in treated cells. While the catalase activity in control and treated cells of both strains was relatively similar, the total SOD activity in treated NQ and Q cell of S. cerevisiae 584 stain showed significantly higher levels (between 40% and 50%, respectively) than the same cell-free extracts of the haploid strain. This result correlated with the other result found in our work – the higher concentration of ROS accumulated in Q and NQ cells of S. cerevisiae 584 in norma and after Cd2+ exposure. Comparing the total SOD and catalase activities of experimental strains, it could be concluded that SOD plays the main role in ROS detoxification under Cd2+ stress. SOD activity was increased about 37 − 55%, and that of catalase, 7 − 20%. These results are in accordance with previous studies on the antioxidant cell defense system of Schizosaccharomyces pombe at IC50 Cd2+ concentration, where SOD played the main role in ROS neutralization in Cd2+-induced stress conditions rather than catalase [Citation43]. Similar conclusions were made by Wang et al. [Citation44], who reported a rising trend for SOD and an opposite one for catalase activities, due to its inhibition by Cd2+, measured in zebrafish liver cells. Conversely, other authors [Citation45] have reported decreased activity of both enzymes (about 50% for SOD and 70% for catalase) in S. cerevisiae cells after 24 h treatment with the same cadmium concentration. Obviously, the effect of cadmium on the antioxidant enzyme system depends on the length of exposure to this heavy metal, the type of cells, as well as the presence of additional metal ions, like Cu2+ [Citation46].
Figure 5. Total SOD (A, B) and catalase (C, D) activity in control cells (
). S. cerevisiae 584 strain (A,C); S. cerevisiae BY4741 strain (B,D). Each value represents the mean ± SEM (Standard error of the mean) (n = 3). Significant differences (* p < .05; ** p < .001) are presented.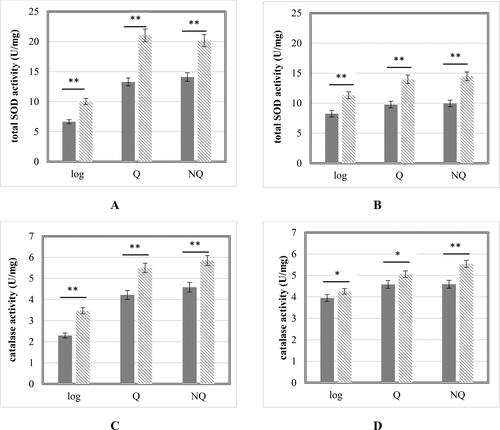
Electrophoretic analyses
To better characterize the cellular antioxidant defense system and deeply understand the role of SOD and catalase enzymes and their expression under Cd2+ stress, we performed native PAGE electrophoretic analyses (). The obtained SOD isoenzyme profiles in the cell homogenates were similar to each other regardless of the strain, diploid S. cerevisiae 584 or haploid S. cerevisiae BY4741. In norma and in Cd2+-induced oxidative stress condition, logarithmic cells expressed three isoenzyme forms, whereas there was an extra band in the Q and NQ cell-free extracts (). The lowest, major band (Rm = 0.385), common for all cell types, corresponded to Cu/Zn SOD encoded by SOD1 gene and the enzyme is localized in cell cytosol. The upper bands (Rm = 0.290 and Rm = 0.337), also common for all electrophoretic profiles, were a result of the MnSOD isoenzymes activity, coded by SOD2 gene and having different molecular conformation. These two bands are probably the tetramer and dimer forms of the MnSOD enzyme, respectively. The presence of an additional band with higher molecular weight (Rm = 0.262) of Mn SOD enzyme in Q and NQ is most likely attributed to a multimeric form of MnSOD [Citation47] and its expression probably is due to the cell requirements to neutralize accumulated excessive ROS during the Cd2+ exposure (). The presence of four SOD isoenzymes in Q and NQ cell homogenates proved the above reported higher total SOD enzyme activity in these cells’ populations.
Figure 6. Electrophoretic profiles of SOD (A, B); SOD inhibitory analysis with 2 mmol/L KCN (C, D); electrophoretic profiles of catalase enzymes of S. cerevisiae (E, F) in control and in threated with 100 µmol/L Cd(NO3)2 cells.
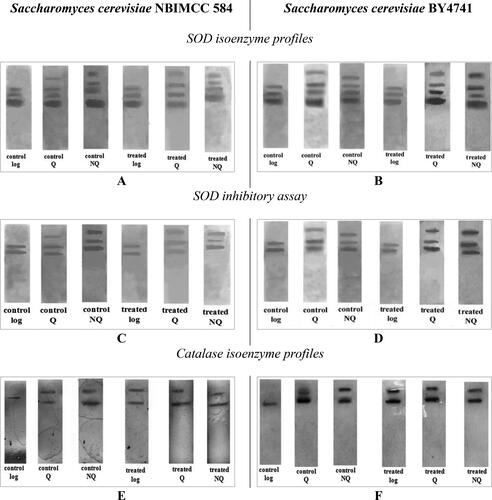
The catalase isoenzyme profiles were also visualized in all tested cells obtained from various experimental conditions. As shown in , catalase possess the same electrophoretic profile in both experimental strains. Only in logarithmic non-treated cells one isoenzyme form (Rm = 0.490) was observed, regardless of the strain ploidy status. This band was common for other tested cell-free extracts too and presented the activity of catalase T located in the cell cytosol [Citation48]. In other non-treated cells (Q and NQ), as well as in all cells under Cd2+ stress, one more upper situated catalase isoenzyme band (Rm = 0.225) was visualized. It is the result of expression of catalase A, responsible for ROS detoxification in mitochondria and peroxisomes [Citation49,Citation50]. The activity of catalase A in non-proliferating control cells and in cells treated with Cd(NO3)2 is probably attributed to the specificity of these cells’ metabolism and additionally was provoked by exogenous Cd2+-generated oxidative stress.
Conclusions
The analyses of the obtained data allowed us to determine the IC50 for Cd(NO3)2 on diploid and haploid S. cerevisiae strains and to conclude that the differences in their ploidy does not reflect significantly on their cadmium resistance levels. NQ cells were more susceptible to Cd2+, as their growth was significantly impaired even at 75 µmol/L of Cd(NO3)2. Slightly higher resistance was observed in cells that have entered into the G0 stage; they still preserved their viability at 150 µmol/L of Cd(NO3)2. The most sensitive to Cd2+ exposure were the actively proliferating cells, also showing increased intracellular ROS concentrations and corresponding protein molecule structure damage. The performed investigations provided evidence that as a result of Cd2+ treatment the cells activate their antioxidant defense systems. The level of reduced glutathione was increased and highest values were detected in NQ cells. This fact was probably due to the enhanced ROS generation resulting from both cell aging and the additional Cd2+ exposure. As regards the antioxidant enzyme defense system, SOD played the main role in ROS detoxification. It was more stable than catalase in the presence of Cd(NO3)2 and showed a significant increase in its total activity. The measured elevated SOD activity was due to the expression of an additional izoenzyme form when cells were treated with exogenous Cd2+. The diploid cells in G0 stage possessed higher resistance to the tested heavy metal ions as indicated by lower levels of protein carbonylation and increased antioxidant defense system activity. These findings, along with our previous observations [Citation51–53], shed more light on the mechanisms underlying the quiescent state in S. cerevisiae.
Author’s contribution
VP conceived the idea and supervised the study. AT and EP performed, analyzed and interpreted the data. VP, EP and AT wrote the manuscript.
Disclosure statement
No potential conflict of interest was reported by the authors.
Data availability statement
All data that support the findings reported in this study are available from the corresponding author upon reasonable request.
Additional information
Funding
References
- Godt J, Scheidig F, Grosse-Siestrup C, et al. The toxicity of cadmium and resulting hazards for human health. J Occup Med Toxicol. 2006;1:22.
- Robetrs T. Cadmium and phosphorous fertilizers: the issues and the science. Proc Eng. 2014;83:52–59.
- Henson M, Chedrese P. Endocrine disruption by cadmium, a common environmental toxicant with paradoxical effects on reproduction. Exp Biol Med (Maywood). 2004;229(5):383–392.
- Bernhoft R. Cadmium toxicity and treatment. 2013. ScientificWorldJournal. 2013;2013:394652.
- Genchi G, Sinicropi M, Lauria G, et al. The effects of cadmium toxicity. Int J Environ Res Public Health. 2020;17:3782.
- Bulat ZP, Dukic-Cosic D, Dokic M, et al. Blood and urine cadmium and bioelements profile in nickel-cadmium battery workers in Serbia. Toxicol Ind Health. 2009;25(2):129–135.
- Tinkov AA, Gritsenko VA, Skalnaya MG, et al. Gut as a target for cadmium toxicity. Environ Pollut. 2018;235:429–434.
- Bolotin-Fukuhara M, Dumas B, Gaillardin C. Yeasts as a model for human diseases. FEMS Yeast Res. 2010;10(8):959–960.
- Cao F, Zhou T, Simpson D, et al. p53-Dependent but ATM-independent inhibition of DNA synthesis and G2 arrest in cadmium-treated human fibroblasts. Toxicol Appl Pharmacol. 2007;218(2):174–185.
- Tamás MJ, Fauvet B, Christen P, et al. Misfolding and aggregation of nascent proteins: a novel mode of toxic cadmium action in vivo. Curr Genet. 2018;64(1):177–181.
- Wei W, Nurse P, Broek D. Yeast cells can enter a quiescent state through G1, S, G2, or M phase of the cell cycle. Cancer Res. 1993;53(8):1867–1870.
- Kumar R, Srivastava S. Quantitative proteomic comparison of stationary/G0 phase cells and tetrads in budding yeast. Sci Rep. 2016;6:32031.
- Sun S, Gresham D. Cellular quiescence in budding yeast. Yeast. 2021;38(1):12–29.
- Allen C, Büttner S, Aragon AD, et al. Isolation of quiescent and nonquiescent cells from yeast stationary-phase cultures. J Cell Biol. 2006;174(1):89–100.
- Lowry HO, Rosebrough NJ, Farr OL, et al. Protein measurement with the Folin phenol reagent. J Biol Chem. 1951;193(1):265–275.
- Kostova I, Traykova M, Rastogi V. New lanthanide complexes with antioxidant activity. Med Chem. 2008;4(4):371–378.
- Mesquita C, Oliveira R, Bento F, et al. Simplified 2,4-dinitrophenylhydrazine spectrophotometric assay for quantification of carbonyls in oxidized proteins. Anal Biochem. 2014;458:69–71.
- Zhang Y. Role of glutathione in the accumulation of anticarcinogenic isothiocyanates and their glutathione conjugates by murine hepatoma cells. Carcinogenesis. 2000;21(6):1175–1182.
- Beauchamp C, Fridovich I. Superoxide dismutase: improved assays and an assay applicable to acrylamide gels. Anal Biochem. 1971;44(1):276–287.
- Aebi H. Catalase in vitro. Methods Enzymol. 1984;105:121–126.
- Davis BJ. Disc electrophoresis. II. Method and application to human serum proteins. Ann N Y Acad Sci. 1964;121:404–427.
- Misra H, Fridovich I. The role of superoxide anion in the autoxidation of epinephrine and a simple assay for superoxide dismutase. J Biol Chem. 1972;241:3410.
- Selander RK, Caugant DA, Ochman H, et al. Methods of multilocus enzyme electrophoresis for bacterial population genetics and systematics. Appl Environ Microbiol. 1986;51(5):873–884.
- Geller BL, Winge DR. Subcellular distribution of superoxide dismutases in rat liver. Methods Enzymol. 1984;105:105–114.
- Aziz R, Rafiq M, Yang J, et al. Impact assessment of cadmium toxicity and its bioavailability in human cell lines (caco-2 and HL-7702). 2014. BioMed Res Intern. 2014;2014:1–8.
- Wang X, Yi M, Liu H, et al. Reactive oxygen species and Ca2+ are involved in cadmium-induced cell killing in yeast cells . Can J Microbiol. 2017;63(2):153–159.
- Požgajová M, Navrátilová A, Šebová E, et al. Cadmium-induced cell homeostasis impairment is suppressed by the tor1 deficiency in fission yeast. Int J Mol Sci. 2020;21:7847–7866.
- Pasternakiewicz A. The growth of Saccharomyces cerevisiae yeast in cadmium enriched media. Acta Sci Pol Technol Aliment. 2006;5(2):39–46.
- Petrova V, Pisareva E, Angelov A, et al. Targeting genes of cd induced oxidative stress response in yeasts. Biotechnol Biotechnol Equip. 2013;27(2):3716–3724.
- Kültz D. Molecular and evolutionary basis of the cellular stress response. Annu Rev Physiol. 2005;67:225–257.
- Gibney P, Lu C, Caudy A, et al. Yeast metabolic and signaling genes are required for heat-shock survival and have little overlap with the heat-induced genes. Proc Natl Acad Sci USA. 2013;110(46):4393–4402.
- Trancìková A, Weisová P, Kiššová I, et al. Production of reactive oxygen species and loss of viability in yeast mitochondrial mutants: protective effect of bcl-xL. FEMS Yeast Res. 2004;5(2):149–156.
- Muthukumar K, Nachiappan V. Cadmium-induced oxidative stress in Saccharomyces cerevisiae. Ind J Biochem Biophys. 2010;47(6):383–387.
- Leonov A, Feldman R, Piano A, et al. Caloric restriction extends yeast chronological lifespan via a mechanism linking cellular aging to cell cycle regulation, maintenance of a quiescent state, entry into a non-quiescent state and survival in the non-quiescent state. Oncotarget. 2017;8(41):69328–69350.
- De Virgilio C. The essence of yeast quiescence. FEMS Microbiol Rev. 2012;36(2):306–339.
- Beal MF. Oxidatively modified proteins in aging and disease. Free Radic Biol Med. 2002;32(9):797–803.
- Farrugia G, Balzan R. Oxidative stress and programmed cell death in yeast. Front Oncol. 2012;2:64.
- Hillenmeyer ME, Fung E, Wildenhain J, et al. The chemical genomic portrait of yeast: uncovering a phenotype for all genes. Science. 2008;320(5874):362–365.
- Shima J, Takagi H. Stress-tolerance of baker’s-yeast (Saccharomyces cerevisiae) cells: stress-protective molecules and genes involved in stress tolerance. Biotechnol Appl Biochem. 2009;53(Pt 3):155–164.
- Rahman I. Regulation of glutathione in inflammation and chronic lung diseases. Mutat Res. 2005;579(1–2):58–80.
- Mendoza-Cozatl D, Loza-Tavera H, Hernandez-Navarro A, et al. Sulfur assimilation and glutathione metabolism under cadmium stress in yeast, protists and plants. FEMS Microbiol Rev. 2005;29(4):653–671.
- Gales G, Penninckx M, Block JC, et al. Role of glutathione metabolism status in the definition of some cellular parameters and oxidative stress tolerance of Saccharomyces cerevisiae cells growing as biofilms . FEMS Yeast Res. 2008;8(5):667–675.
- Pisareva E, Kostova M, Nedeva T, et al. Effect of Cd2+ on the antioxidant status of Shizosaccharomyces pombe. Biotechnol Biotechnol Equip. 2010;24:494–500.
- Wang J, Zhang H, Zhang T, et al. Molecular mechanism on cadmium-induced activity changes of catalase and superoxide dismutase. Int J Biol Macromol. 2015;77:59–67.
- Karoui-Kharrat D, Kaddour H, Hamdi Y, et al. Response of antioxidant enzymes to cadmium-induced cytotoxicity in rat cerebellar granule neurons. Open Life Sci. 2017;12(1):113–119.
- Romandini P, Tallandini L, Beltramini M, et al. Effects of copper and cadmium on growth, superoxide dismutase and catalase activities in different yeast strains. Comp Biochem Physiol C: Comp Pharmacol. 1992;103(2):255–262.
- Petrova V, Uzunov ZG, Kujumdzieva A. Peroxisomal localization of MN SOD enzyme in Saccharomyces cerevisiae yeasts: in silico analysis. Biotechnol Biotechnol Equip. 2009;23(4):1531–1536.
- Petrova V, Rasheva T, Kujumdzieva K. Catalase enzyme in mitochondria of Saccharomyces cerevisiae. EJB (Online). 2002;5(1). DOI: 10.2225/vol5-issue1-fulltext-6.
- Lapinskas P, Ruis H, Culotta V. Regulation of Saccharomyces cerevisiae catalase gene expression by copper. Curr Genet. 1993;24(5):388–393.
- Petrova V, Drescher D, Kujumdzieva A, et al. Dual targeting of yeast catalase A to peroxisomes and mitochondria. Biochem J. 2004;380(Pt 2):393–400.
- Daskalova A, Tomova A, Kujumdzieva A, et al. Menadione and hydrogen peroxide trigger specific alterations in RNA polymerases profiles in quiescent Saccharomyces cerevisiae cells. Biotechnol Biotechnol Equip. 2021;35(1):1190–1199.
- Daskalova A, Petrova V, Velkova L, et al. Investigation of protein expression of Saccharomyces cerevisiae cells in quiescent and proliferating state before and after toxic stress. Biotechnol Biotechnol Equip. 2021;35(1):366–376.
- Tomova A, Kujumdzieva A, Petrova V. Carbon source influences Saccharomyces cerevisiae yeast cell survival strategies: quiescence or sporulation. Biotechnol Biotechnol Equip. 2019;33(1):1464–1470.