
Abstract
Single cell transcriptomics were declared twice ‘Method of the year’ by Nature Methods journal, in 2013 and 2019. It marks the beginning of new avenue in fundamental and clinical research, as the classic biochemical approach is already seen as limited, as pooling up the contents of a large number of cells together depicts an averaged image that is missing the decision maker cells. Short-read sequencing has already revolutionized biology and medicine, providing an unsurpassed accuracy of the reads, and now third generation long-read nanopore sequencing completes and extends transcriptomics with the ability to discover all full-length isoforms at a single-cell level, providing a deeper insight in our understating of physiology and pathology of tissue functions. This review provides insight on how nanopore technological specifics and limitations have been explored so far in implementing the only direct nucleic acid sequencing platform in single cells sequencing. We review how single-cell sequencing was introduced, most widely used conventional and microfluidic approaches for single cell isolation, ways for further sequencing library generation tailored for Illumina, and how these were adopted for the nanopore technology.
Introduction
In the early 1990s, James Eberwine, a neuro scientist and brilliant inventor, pioneered a new technique to analyze the expression of several genes, using polymerase chain reaction (PCR) amplified RNA of only a single cell that was pipetted out. He found that changes in electrical activity of the neuron changed simultaneously multiple gene transcripts [Citation1, Citation2]. Further on, gene-expression analysis received a boost in the face of the micro arrays and finally, with the rise of the high-throughput RNA sequencing (RNA-seq) – a method delivering the sequences of thousands of cellular RNAs at once. This has made it possible to reveal the active genes in a cell, or at least part of them, in a single readout (single cell transcriptomics). The Azim Surani’s group that have been working in the field of developmental biology at the University of Cambridge, UK, used single cell transcriptomics to examine the very rare and hard to study cells of the early embryo (blastomeres). They have traced how these cells turn into pluripotent embryonic stem cells in culture [Citation3], detecting over 12,000 genes, which is about 75% more than the ones detected by microarray techniques. In order to achieve that, they had to accommodate the protocol they were using to amplify the transcriptome form even 1 picogram of RNA — a 1/10th the amount of RNA in a typical cell, and further they had to capture transcripts longer than 3 kilobases, as they have missed about 40% of transcripts initially. When the transcripts amplification reached about 10-kilobase length, the 99% of cell transcription was captured. This approach provided high mRNA coverage, but at the expense of PCR introduced bias [Citation2, Citation3]. To cope with that, another technique for RNA amplification was introduced – antisense RNA (aRNA), an in vitro transcription (IVT) technique by Eberwine’s team [Citation4], where single cell RNA is copied into a stable DNA library, which is further used for direct linear RNA amplification by RNA polymerase. This approach delivered high quantity RNA without the PCR bias, preserving relative RNA abundance, but it was very time consuming and less efficient. Nowadays, several commercial kits are able to linearly amplify the RNA transcriptome starting with 10-25 micrograms of RNA in 6-48 h, delivering 150 000 times amplification.
Similar steps were undertaken to elucidate the human genome heterogeneity on the single-cell level by Nicholas Navin, who has been among the pioneers of single-cell whole genome sequencing [Citation2, Citation5]. A major limitation for achieving that goal was the preference of the DNA polymerase for some regions at the expense of skipping others. Tweaking the method further improved the coverage up to 50% by that time. Using this new approach, Fred Gage’s team have sequenced individual neurons, finding that mobile genome elements such as the long-interspersed elements form new insertions into DNA upon neuronal stem cells differentiation into neurons. Thus, every neuron contained between 80 and 300 such unique mobile insertions [Citation6, Citation7].
According for many single-cell researchers, the classic biochemical approach is limited already, as pooling up the contents of a large number of cells together, as it is in the so-called Bulk RNA-seq, depicts an averaged image that is missing the decision maker cells. As stated by the director of the Institute of Stem Cell Research at the German Center for Environmental Health in Munich, Timm Schroeder, ‘it’s the individual cell that makes a decision’ in both health and disease [Citation8]. No wonder, the single-cell DNA and RNA sequencing were nominated as ‘Method of the year’ by Nature Methods journal in 2013 and 2019, later extending to multimodal OMICs [Citation9].
Thus, every single cell’s uniqueness, based on its exclusive position in space, distinct genome errors footprint, and individually induced changes in gene expression, can be analyzed using various modifications of single-cell sequencing methods. Single-cell DNA sequencing reveals mutations and structural changes in cancer cell genomes, describing the tumour clonal structure and providing means to trace the evolution and spread of the disease. It also revealed a surprising level of mosaicism in somatic tissues such as the brain, a phenomenon yet to be explored. Single-cell transcriptome profiling identifies biologically relevant differences in cells, even in cases when cells are undistinguishable from one another by only using either cell surface markers or plain morphology, thus providing means for grouping cells in an unbiased way. There are even translational clinical applications, where single-cell sequencing has been used to: distinguish different cell type transcriptional profiles in tumours; preimplantation screening of in vitro–fertilized embryos; diagnosing cancer based on rare circulating tumour cells, etc.
In this review we present briefly the single-cell transcriptomics alone and the up-to-date trend in applying long read nanopore based sequencing for obtaining single cell full length transcripts exceeding beyond current technology limitations.
Conventional single cell short-read transcriptomics
The single-cell transcriptomics and other OMICs analyses have several main trends that allow to categorize them, but all of them are actually a reflection of the cell number and the approach used to distinguish one cell from another. First attempts were based on upgrades of single cell isolation approaches, either by means of in vitro manipulator pipette [Citation3, Citation10, Citation11, , ], or later on, using fluorescent-activated cell sorting (FACS) [Citation12, Citation13], thus delivering from one to 96 or 384 cells into a single tube or multiple well plate(s), respectively. Some attempts were made to use Laser Capture Microdissection for the same purpose, where along with transcriptome, spatial information has been also preserved [Citation14]. Here the most important issue was the representation of the transcriptome – full length or partial 3′- or 5′- tailed transcript coverage approaches. As the total number of transcripts, and the number of detected transcript isoforms per gene differed significantly among various methods, this has led to a number of data acquisition and data analysis issues stemming from that: there is a limited abundance of detected molecules per cell, and also limited number of cells, with gene drop outs, where even abundant in expression genes are not detected, transcript expression bias is introduced, or isoform detection is impossible. All these have resulted in the development of different novel approaches aimed at increasing the number of analyzed single cells, and the coverage of single cell transcriptome. Thus, a continuous-flow microfluidics was employed to produce multiple single cell traps, where each cell was captured and analyzed (ex. Fluidigm C1) [Citation15], or a droplet-based microfluidics was used to encapsulate single cells together with barcoding beads (ex. Drop-seq, InDrop, other protocols [Citation16, Citation17]. Based on the transcriptome coverage, three types of single cell RNA sequencing (scRNA-seq) exist: (i) full-length transcript (ex. SMART-seq 2 [Citation18], Quartz-seq 2 [Citation19], ICELL8 [Citation20], (ii) 5′ -end transcrit (ex. STRT-seq [Citation21, Citation22, ]), (iii) 3′ -end transcrit (ex. Chromium 10X Genomics [Citation23], Fluidigm C1 [Citation24], Drop-seq [Citation17], inDrop [Citation16]) coverage.
From the conventional methods performed in a multi-well plate or even single micro-tubes, the fundamental ones that have been used as foundation for producing many novel improvements are CEL-seq 1/2, MARS-seq, SCRB-seq and Smart-seq 1/2. We will briefly focus on the approaches used in these methods rather than on the actual details, as they were already discussed in the original papers published, as well as in many reviews on the subject. We will focus on what matters to build on further using nanopore sequencing as scRNA-seq methods as well ().
Figure 1. Single-cell RNA-seq – cell isolation, library strategy and data analysis. (a) pipette based single cell isolation as in protocols Smart-seq 1 & 2, CEL-seq 1 and 2, (b) FACS based single cell isolation in 96/384 multi-well plates, as in protocols SCRB-seq, MARS-seq 1 & 2, (c) Nanowell single cell isolation – multiple cell populations are separated in a single cell per well and scRNA library is generated, (d) microfluidics based water-in-oil droplet encapsulation of single cells – droplets are formed following Poisson distribution, and single cell and single barcode bead are co-encapsulated in a single droplet, (e) Barcode bead is either a polystyrene bead with photocleavable oligonucleotide probes attached, or an agarose bead with oligonucleotide probes inside, and in any case, the poly(A) tail of mRNA is attached to the poly(T) part of the probe, where also a Unified Molecular Identifier and CellBarCode exist; thus synthesizing a reverse strand generates a poly(T)-CellBC-UMI-cDNA sequence, representing a single transcript. (f) Smart-seq 2, (g) MARS-seq, (h) SCRB-seq, (i) Comparison of data closeting approaches t-SNE and UMAP, where for each cell a number of gene counts exist, i.e. how many times a single gene exists per cell, with different UMI in its amplified cDNA copies. Both t-SNE and UMAP provide clustering of individual cells based on their gene expression matrices, where UMAP provides an even higher order of information – cell line trajectory showing which cell stems from which progenitor, while t-SNE differentiates different cell types, but not the origin of one phenotype.
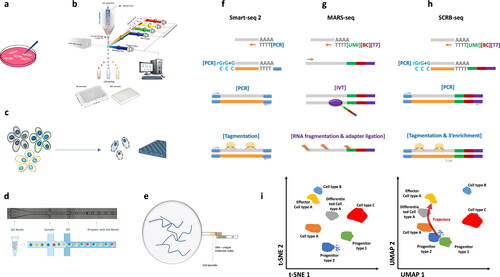
Cell Expression by Linear Amplification and Sequencing (CEL-seq) ver. 1 [Citation11] and 2 [Citation10], and Massively Parallel RNA Single-Cell Sequencing (MARS-seq), ver. 1 and 2 [Citation25], all rely on amplification of the mRNA transcripts using in vitro transcription (IVT). CEL-seq originally was based on pipette isolated single cells, while MARS-seq was based on FACS isolated single cells into 384 well plates. In both major protocols, CEL-seq and MARS-seq, after isolation of mRNA, the second strand is synthesized using linear amplification achieved by IVT. A poly(T) tail is attached to the cells mRNA poly(A) at their 3′-end. The tailed oligo(dT) is preceded by a T7 promoter for IVT, partial Illumina 5′-adapter, a cell barcode (cellBC), and a Unified Molecular Identifier (UMI). Thus, a 5′ to 3′-directed reverse transcription synthesis is carried out attaching a reverse strand to the original mRNA, containing T7-cellBC-UMI-oligo-dT. Once the double-stranded cDNA containing the T7 promoter is generated, the cDNAs are pooled together and an in vitro transcription is used to multiply cDNA using linear amplification. This approach is slow, but it preserves different transcript abundance ratio. After subsequent fragmentation the sequencing library is generated. CellBCs provide means to discern individual cells after sequencing of the pooled cDNAs, while UMIs allow for each individual cell, the number of separate transcripts encoded by the same gene to be distinguished and quantified. CEL-seq was used for studying early embryos sister cells, signifying the possibility to distinguish different cell types even in case only subtle biological differences occur. MARS-seq, as an automated and enhanced version of CEL-seq, provides means to analyze thousands of single cells in automated fashion, with minimized amplification bias and labelling mismatches [Citation1]. MARS-seq 2 uses indexed FACS sorting, allowing for greater cells of interest enrichment, which is crucial for the identification of rare cell subpopulations, like the unique microglia, preventing the development of Alzheimer’s disease [Citation25]. FACS sorting also minimizes cell doublets, another issue plaguing lots of scRNA-seq approaches, increasing throughput and reproducibility.
Single Cell RNA Barcoding and Sequencing (SCRB-seq) is tailored to high throughput 3′-end enriched single-cell transcriptomics using reduced reagents amount and sequencing depth per cell, based on FACS sorting in 384-well plates and reverse transcription similar to previous two methods, including cellBC and UMI. The newer approach introduced here was the use of PCR to amplify pooled cDNAs after strand switching induced second strand synthesis. This method proved to be suitable for profiling transcriptomes across heterogeneous populations [Citation13].
Single-cell tagged reverse transcription (STRT-seq) [Citation21, Citation22, ] is based on a highly multiplexed method for single-cell RNA-seq on the Illumina platform, where barcoded cDNA libraries from 96 single cells are synthesized and analyzed by sequencing. From each transcript, a single read is obtained, corresponding to a template-switching site located preferentially at the 5′ end of the mRNA. This is achieved in a 3-step process, where first mRNA is reverse transcribed using a tailed oligo-dT primer, generating a first-strand cDNA with 3-6 added cytosines, then as a second step a helper oligo causes template-switching and introduces a cell barcode and a primer sequence into the cDNA; third, the cDNA product is amplified by single-primer PCR, then immobilized on beads, fragmented and A-tailed; then an Illumina library is synthesized introducing specific sequencing adapters. Thus, each read begins by the barcode, followed by 3-6 Cytosines, followed by the mRNA insert. The STRT-seq method has the advantage to show the 5′-end of the mRNAs spanning up to 2 kb in length of the reads, and also preserved the strand information, as shown by the ratio of sense to antisense reads on exons and splice junctions [Citation22]. The coverage of full-length transcripts was dependent on transcript lengths due to ineffective cDNA and abruption in cDNA synthesis. The method further included UMIs as a method to improve the quantitation of the transcripts.
Switching Mechanism at 5′-End of RNA Template (Smart-seq) versions 1 and 2 have been introduced to address the limitations of existing technologies such as limited throughput and lack of full-length read coverage across transcripts [Citation14, Citation18]. Unlike previous methods, both versions of this method provide full-length transcripts, but in separate tubes or multi-well plates, and there is no cell barcode or UMI utilization in the original protocols. The reverse transcription is initiated using an oligo(dT) primer, and strand switching is used to cover the full length by adding rCrCrC - three Cytosine nucleotide sequence at the 3′-end of the complimentary reverse strand cDNA, and then in the presence of a template switching oligo (TSO) containing rGrGrG-, templates are switched by RT and the second strand of cDNA is synthesized. Full-length cDNAs are subsequently amplified using PCR to obtain a few nanograms of DNA, further used for Illumina sequencing libraries preparation, following the Nextera Tn5 transposon protocol. This technique dramatically improves the transcript coverage and enhances the evaluation of single nucleotide polymorphisms. It is particularly useful for investigating the transcriptomic profile in rare cells. Smart-seq ver. 2 further improved on yield, length, coverage, accuracy and sensitivity, by optimizing the RT and template switching protocol. TSO was modified to use locked nucleic acid (LNA).
Microfluidics based single-cell short-read transcriptomics
Although FACS based methods can be automated and scaled to reduce the assay cost and reaction volumes, they are still labor- and time-consuming, compared to the new avenue of microfluidics-based methods. These are based on linear valve systems, droplet-based systems and Nanowell chips [Citation20]. Valve-based microfluidics chips are complex devices, consisting of multiple chambers and in/out build valves controlled by pressure. To some point Fluidigim C1 could be classified as a commercial version of it. Most of the other systems that have been published, although very sophisticated have not yet been commercialized and are hard to reproduce in massive manner [Citation24]. Droplet-based microfluidic chips usually involve encapsulating single cells in droplets in inert carrier oil, later allowing for the droplets to be moved, merged, split, heated, or stored. This provides fast and high-throughput large-scale analysis of heterogenous cell populations [Citation16, Citation17].
The two most widely established protocols for droplet-based single-cell sequencing are Drop-seq [Citation17] and InDrop-seq protocols [Citation16]. Both are based on water-in-oil droplet encapsulation of single cells together with a bead, lysis solution and DNA polymerase and primers. Both protocols use different types of probes carried by the beads, with three major features similar: each probe has a cell barcode, a UMI (unified molecular index) and a poly-T part, so the mRNA could be captured by its poly-A tail. The cell barcode is the same on each bead, while the UMIs are different per bead and they are usually degenerate. Degenerate ‘bases’ are equimolar interchangeable bases at the same place, encoding for the same amino acid. Barcodes are two types: error corrected, and without error correction. This is related to the feature of barcodes being constant or random per bead. In most non-commercial protocols cell barcodes are without error correction, as they are usually produced by a ‘split-and-pool’ protocol for one to several mixing of a pool of partial barcodes that after being mixed undergo ligation and thus produce longer more ‘mature’ barcodes. This makes them random and less prone to error-correction. On the other hand, some commercial protocols for single cell sequencing use self-corrected barcodes, which are always constant thus allowing for more effective error-correction procedures.
Drop-seq protocol designed by Macosco et al. [Citation17] utilized polystyrene beads with short oligonucleotide probes bound to the beads, so the lysed mRNA transcripts could be captured by the oligo probes, and this is used as a template in order for a cDNA copy of the captured mRNA to be synthesized by the DNA polymerase. A major issue with hard beads is the high probability of clogging the microfluidics channel, and higher probability of doublets, a condition when two beads get encapsulated within the same droplet. There is also a steric interference and limitation on the number of probes per polystyrene beads. In order to avoid Drop-seq drawbacks, cell barcode beads used in the inDrop protocol were replaced with agarose ones, containing split-and-pool generated non-error-corrected barcoded beads, where softer agarose beads easily adapt and deform protruding via microfluidics channels, producing less encapsulated doublets. The cell encapsulation speed is different in both protocols, with Drop-seq allowing more genes per cell on a lesser cell number, while inDrop-seq allows for capturing more cells on lower speed, hence rarer cell populations, but with fewer genes per cell [Citation16, Citation17]. With the full-length transcript sequencing approach, there are issues with resolution, speed and sequencing cost. On the other hand, a major drawback of cDNA sequencing prioritizing either 5′- or 3′- end transcripts of the cDNA is incapable of examining allele-specific expression or alternative splice forms. Some methods rely on FACS-based sorting, such as MARS-seq, which makes them reliant on a larger initial volume [Citation25] and is disadvantageous when the initial volume is low, as in fine-needle aspirates. Another drawback of using FACS is the requirement of antibodies that target specific proteins for sorting; these pose problems while sorting rare cell subtypes. Thus, each protocol has its sets of advantages and disadvantages that determine the ‘depth’ (reads/cell) of a given dataset, and it could ultimately affect the statistical and biological insight [Citation26].
Introduction to long-read sequencing
Long-read sequencing, also referred to as third-generation sequencing, has several substantial advantages over short-read next generation sequencing [Citation27, Citation28]. First, it can produce reads exceeding 10 kb [Citation28] in transcriptomics context and even 10 mb in whole genome studies, while short-read technologies provide only 150-300 bases reads (Illumina) [Citation27, Citation29], up to 600 bases like in BGI technology [Citation30] or in Thermo Fisher’s Ion Torrent technology [Citation31, Citation32]. Although short-read sequencing is cost-effective and accurate [Citation33], natural nucleic acid polymers like DNA and RNA span eight orders of magnitude in length, and sequencing them in short 150-600 bp amplified fragments makes the quantitative reconstruction of the original molecules a significantly challenging task, especially in the cases when de novo fusion mutations are generated in cancer context, and not only. Long-read sequencing provides means for very accurate de novo reads assembly and mapping, complex transcript isoform identification, as well as the detection of structural variants.
We will further focus on the Oxford Nanopore Technology (ONT) long-read sequencing, as it has some advantages for transcriptomics that currently no other technology possesses [Citation34]. Although currently the PacBio long-read platform provides sequencing with higher accuracy in regard to single-cell sequencing and cell barcoding, the ability of ONT direct sequencing to detect epitranscriptomic and epigenomic changes would have a higher impact in the field of biology and translational medicine in the long term. This advantage is based on the core foundation of the technology, namely the ability of ONT sequencers (MinION, GridION and PromethION) to measure the fluctuations in the ionic current produced by a single-stranded nucleic acid passing through a biological nanopore. Through a process named basecalling, the nucleotide sequence can be inferred using the specific patterns of current variation across the pore, since different nucleotides confer different resistances to the stretch of nucleic acid within the pore [Citation35, Citation36].
Mammalian cell identity and function maintenance vastly depends on the alternative splicing of transcripts [Citation37, Citation38], sometimes generating a huge number of transcript isoforms, many of which could not be detected by second-generation NGS platform-based single-cell RNA-seq methods due to their short-read length and 3′- or 5′- only bias. This provides for long-read sequencing an opportunity for applications in transcriptomics, including single-cell transcriptomics [Citation39, Citation40].
We will further shortly present some essential principles and potential drawbacks related to the ONT long-read sequencing data analysis focusing on some main downstream analyses relevant to scRNA-seq, like error correction and transcriptomics.
Basecalling
Nanopore sequencing provides direct electronic analysis of the target molecule, rather than sequencing a synthetic copy or using surrogate markers such as fluorescence. As it was mentioned before, basecalling is the essential first data transformation in any long-read analysis, where the raw data signal representing current fluctuations is analyzed and ‘interpreted’ to the putatively corresponding nucleic acid sequences. This step is done using ONT proprietary or 3rd party community software and is currently under significant development, with more than 23 tools related to nanopore sequencing. Short-read sequencing and PacBio long-read sequencing use platforms proprietary software. They have greater accuracy, especially Illumina, partially due to the orders of magnitude shorter sequences being read (150-600 bp) compared to ONT long-read sequencing (10 kb ∼ 4 mb). As of the PacBio platform, there is a mechanism that provides ‘deep’ reading of the same sequence by synthesis using rolling circle PCR reaching high accuracy consensus.
Although the accuracy rate is higher than ONT, the main advantage of ONT platform related to the direct nucleic acid and their base modification analysis is lost. For that reason, the nanopore basecalling is a quickly evolving area of active research, with lots of new algorithms analyzing the current intensity raw data values measured at 4 kHz speed. The accuracy of nanopore reads is independent of the nucleic acid sequence length. Read quality depends on achieving optimal translocation speed of the nucleic acid through the pore [Citation34]. Contrary to the PacBio platform, the nanopore sequencing library consists of linear fragments that are read only once, and this single-pass accuracy is the final accuracy for the fragment. Indels and substitutions are frequent in nanopore data, partly randomly, but not uniformly distributed. Homopolymers and low-complexity stretches are still more difficult to resolve with the current R9 generation of pores and basecallers [Citation34], as they produce signals that are too similar. Additionally, the translocation speed of the k-mer is not constant and may vary. Thus, each time the same k-mer passes through the pore, the current measured in the pore reflects its sequence, but also may vary, becoming a source of systematic bias. Sequence quality depends on the basecaller architecture, and its ability to capture these changes, as well as on the data that have been used to train it. The read accuracy can be improved by training the basecaller on data that are similar to the sample of interest [Citation41]. Additionally, a new generation of pores R10 was created having different internal structure of the pore channel, so that low complexity sequences still produce detectable current differences that are less translocation speed dependent [Citation34].
Initially Hidden Markov Models (HMM) were used to analyze the so-called ‘squiggles’ (an approximation of the different steady state levels of the signal), later very successfully replaced with various neural networks, currently Recurrent Neural Networks being used [Citation42]. In order to improve the overall accuracy, the chemistry was also optimized over the years, and the new RNNs have been trained to the new chemistry (flow cell R9.4.1), providing a single molecule accuracy rate of up to 98.3% with the currently available production basecaller Guppy, while other new ones are in development versions (Flappie, Scrappie, Taiyaki, Runnie, and Bonito) [Citation34]. Bonito is expected to become the new production basecaller since the fall of 2021, with estimated single molecule accuracy rate of more than 99.3% based on an improved chemistry and neural network. It should be noted that the single base quality metrics produced by Illumina platform not always provide an accurate estimate whether the base is accurately read or not. Generally, the Phred quality (Q) score used in different platforms is estimated using different algorithms and is only relatively accurate, which requires further unbiased alignment and mapping, sometimes ignoring it, in order to use most of the sequenced data. Phred quality score measures the quality of identification of the nucleic acid bases generated by automated DNA sequencing [Citation43, Citation44], estimated as −10 times decimal logarithm of the base-calling error probabilities P [Citation43]. So, for example, if a base is called incorrectly 1 in 100 bases read, then the Phred score (Q) is estimated as 20, or the probability is 99%. Phred quality score is a measure of confidence based on the estimated error rate, thus increasing Q-scores will indicate greater confidence in a predicted base. There are two types of Q-scores, one for the entire read and per base quality scores, and they are basecaller algorithm-dependent. Generally, basecallers estimate a confidence value per base call, while the per read confidence value is normalized to the empirical per base group probability across all sequencing position to align to a reference known genome sequence. In other words, per read accuracy is normalized to a reference genome using per base accuracies.
Direct sequencing avoids sources of bias such as PCR and gives native information about the target molecule. Usually, the production basecaller has best accuracy and stability [Citation41]. Guppy, the production basecaller ver. 5 has single read accuracy spanning from 95.5 to 98.3% depending on the working model, but when a consensus is build combining multiple separately sequenced copies of specific DNA region, into a single high-quality sequence, the accuracy using R9.4.1 chemistry becomes Q50 at 100X sequencing (100 times sequencing of the same region). This means that at Q50 score of reads there is 1 error at 100000 bases read, corresponding to an accuracy rate of 99.999%. This makes approaches using consensus assemblies very important when single-cell transcriptomics is concerned. Thus, consensus generation can be applied also to specific regions of interest, like barcoded cDNA sequence, by combining multiple exact copies of a single original fragment into a single high-quality consensus sequence. There are different strategies for amplification and sequencing of these exact copies, or their association together, ultimately yielding confidence accuracy of 99.995% at Q45 quality after 25X depth of sequencing.
Strategies for improved error correction and barcode reliability for long-read single cell transcriptomics
Having in mind the abilities of ONT in terms of single and consensus accuracy, we will consider the different approaches employed so far for implementing this technology for single-cell RNA-sequencing. The major benefit from the use of long-reads is the ability to decipher the full-length transcripts isoform complexity, something not possible using only RNA 5′-/3′-end biased short-read sequencing. The current long-read accuracy is enough to uniquely determine a transcript or transcript isoform, but certain applications require high base-level accuracy, including defining intron–exon boundaries [Citation45] or barcode-identification. In single-cell sequencing, barcode proper identification is essential for distinguishing and identifying distinct cellular transcriptomes. Thus, improving either its sequencing accuracy or postprocessing accuracy is essential for that task, otherwise the high error rate in barcodes and/or UMIs usually results in a considerable number of reads misclassified, being either classified to the wrong barcoded bead (i.e. cell id) or being unable to be classified to a barcode at all.
So far, several strategies have emerged using ONT long-read sequencing-based approaches to cope with this issue: 1. hybrid sequencing was used to improve the consensus sequence including the barcode, 2. non-hybrid approach, where solely ONT long-read sequencing was used, with different improved read consensus strategies, 3. barcode optimization using error-corrected approaches to overcome the inherent high error rate, 4. low-throughput approaches either using ONT tailored limited number of barcodes or approaches avoiding barcode and/or UMI utilization.
The hybrid approach employs combining of short-read Illumina sequencing with ONT long-read sequencing to resolve barcodes and UMIs for high cellular coverage and has several different implementations so far
A recent review and benchmarks have analyzed about a dozen hybrid error correction tools, dedicated on methods leveraging ONT long-read accuracy by additionally using short-read data [Citation46, Citation47]. The hybrid error correction approaches could be further classified according to the way short reads were used. In alignment-based approaches, the short reads are aligned to the long reads directly, thus generating corrected long reads. In assembly-based methods, the short reads were first used to build a de Bruijn graph or assembly [Citation48]. Then the long reads were corrected by aligning each of them to the assembly or by traversing the de Bruijn graph [Citation34]. Assembly-based approaches seemed to outperform alignment-based approaches in both correction quality and speed. FMLRC [Citation49] was found to perform best in the two benchmark studies [Citation46, Citation50].
After generating an assembly, the process of removing the remaining errors from the contigs (rather than from the raw reads) is referred to as ‘polishing’. When a hybrid approach is used, polishing can be done with the help of short reads using tools like Pilon [Citation51], or Racon [Citation52], often in multiple iterations [Citation53–55]. The rationale behind the iterative hybrid polishing relies on the concept that as errors are corrected, previously ambiguously mapped short reads could be mapped with greater accuracy. It should be noted that some algorithms repeat polishing until convergence, but too many iterations can decrease the quality of the assembly [Citation56], while others in order to increase scalability, limit these alignment iterations using sequencing read based filters [Citation57]. Currently, depending on the particular application there are tailored approaches, but there is no common algorithm/pipeline that can fit all purposes, and choosing the best pipeline requires to carefully consider the source and amount of the raw error, as well as the end goal.
So far there are few applications of hybrid error correction in single-cell RNA sequencing based on the ONT platform. One of the first approaches was the introduction of the method RAGE-seq (Repertoire and Gene Expression by Sequencing) [Citation58]. This was a targeted sequencing of 7138 tumour-derived lymphocytes, where 10x Genomics platform was used to capture single cells and amplify cDNA from individual transcripts assigning per cell a unique cell barcode, further subject to short-read Illumina sequencing for 3′- gene expression assessment. T-cell receptors and B-cell receptors were hybrid captured per individual cell in parallel, and sequenced using the ONT long-read approach, allowing for matching T- or B-cell receptor (splicing) variants to distinct cell-specific transcriptome gene expression profiles. UMIs were not used or error corrected in this study though, in regard to long-read data. Short-read high accuracy cell barcodes were used to match full-length T-/B-cell receptor and demultiplex them, receiving individual per cell receptor–gene expression sets [Citation58]. Long-read sequencing has limited depth and skips low abundance isoforms. This would require rather strong PCR amplification of single-cell sequencing library preparation, but PCR introduces both amplification bias and chimeric cDNA generation, and both issues were addressed by introducing short random sequence tags (unique molecular identifiers, UMIs) during the reverse transcription step [Citation59]. Thus, UMIs would minimize the risk chimeric cDNAs generated by PCR to be falsely annotated as novel transcripts, and more importantly, UMIs allow the generation of error-corrected consensus sequences for each RNA molecule. Considering 5-8% single molecule error rate up to R9.4.(1), the UMI assignment is compromised, and in some studies up to 45% of ONT identified UMIs did not have a match in corresponding Illumina sequenced dataset, meaning they were misassigned [Citation60]. So, a new method was developed to solve this – ScNaUMI-seq (Single-cell Nanopore sequencing with UMIs). Using 10x Genomics droplet isolated 190 mouse brain cells and 951 E18 (embryonic day 18 cells), authors generated both 43 and 73 M reads on Illumina and 32 and 322 M reads on Nanopore platforms respectively from the same cell sets. The structure of the cDNAs produced an attached UMI-cellBC-adapter at the poly(A) tail, so they filtered out cDNAs not having both poly(A)-adapter and continued the analysis with 57%+/-11 of the reads. To achieve highly accurate barcode assignment, they first generated a dataset containing Illumina detected cell barcodes and linked to them the detected genes/genomic regions, and then started filtering the ONT reads by first aligning them to the gene/genomic region, and in case of match they compared the ONT barcode to the Illumina cellBC. This way 68%+/-4 of the ONT sequenced genes/genomic regions were assigned a high-quality cell barcode. Similar strategy was used to error-correct UMIs, as generating UMI consensus out of couple of similar reads in ONT sequencing scenario is quite error prone. Nanopore UMIs per same gene and cell was corrected using corresponding Illumina sequencing data, allowing for the assignment of UMIs to 76 ± 3% of the reads with identified cellBC, resulting in an overall of both cellBC and UMI assignment of 99.8% and 97.4%, respectively [Citation59]. In this study about 33,002 mouse genome annotated full-length transcripts where found, supported by at least one UMI containing full-length read, where exon–exon junctions were preserved. Based on short-read sequencing data, it was previously considered that most likely only a single isoform would be expressed in a single cell [Citation61]. This long-read full-length study showed that this was not the case for all genes, and actually a lot of instances of well-expressed genes were represented by several isoforms at the same single cell, as well as novel isoforms were also present [Citation59]. Single cell t-SNE plots produced identical cell type clusters, characteristic for E18 mouse brain, when fed with short-read and long-read scRNA-seq expression data. The t-SNE plot is a clusterization method based on single-cell expression profile that is superior to PCA in grouping cells into cell type-based clusters. Comparison of medians of detected genes per cell between Illumina and Nanopore data revealed 2468 vs. 2421 genes per cell in the larger 951 cells dataset, while when the median of UMIs were considered (where a single gene product could be represented by several UMIs), 7551 vs. 6090 gene UMIs per cell were identified. In Nanopore data the median of isoforms was 3795 isoform UMIs per cell, suggesting a higher level of information gain per cell. Since accurate cell barcode and UMI identification are both essential, this approach validated the advantages of long-read sequencing when higher accuracy of sequencing will be achieved. Through a UMI, identical copies arising from distinct molecules can be distinguished from those arising from PCR amplification of the same molecule. The UMI help also distinguish some PCR artifacts such as cDNA chimeras. A chimera is a PCR artifact generated when two mRNA template molecules originating from different cells anneal to each other rather than with a primer. This yields chimeric cDNA molecules that are comprised of a cell barcode specific for one cell, and an mRNA from another cell, potentially hampering the long-read data quality in single-cell studies of tumour heterogeneity.
Since ScNaUMI-Seq have lower than 60% specificity when sequencing depth is low and detected correctly UMIs are scarce, a novel software solution using hybrid sequencing technology was introduced - ScNapBar (Single-cell Nanopore Barcode demultiplexer). It combines two modes of action, an UMI based similar to ScNaUMI-Seq software Sicelore and a probabilistic Bayesian approach for barcode instead of UMI alignment scores evaluation. Using Illumina sequencing saturation, the uniqueness of detected transcripts is used to evaluate the overlap between Illumina and Nanopore cell barcodes and UMIs, allowing 97.1% specificity.
A similar combined approach was used in plants recently to evaluate the large number of intron-containing RNAs in Arabidopsis plant nuclei, using a protoplasting-free nuclear isolation method. Thus, the large number of polyadenylated mRNAs that are tightly associated with chromatin in the root and endosperm were analyzed using the proposed flsnRNA-seq (full-length single-nucleus RNA profiling), characterizing the RNA isoforms derived from alternative splicing and alternative polyadenylation at the single-cell level. The proportion of intron-containing mRNAs is as high as 54% compared to less than 2% in total RNAs, and 810 median genes per nucleus were identified, as well as 1131 UMIs per nucleus were analyzed. Using unbiased graph-based clustering about 14 cell types were identified, of them 10 from root cells. Some cell types were represented by several cell clusters: stem cell niche, mature non-hair and endodermis, showing heterogeneity within cell types [Citation62]. As Sicelore by Lebrigand et al. [Citation59] uses both adapter and poly(A) in Nanopore reads to identify the location of the cellBC and UMIs, sometimes it misses the poly(A) part due to its putative extra length. Long et al. [Citation62] further improved on Sicelore by developing a poly(A)-independent algorithm snuupy, which searches for cell barcodes and UMIs in the unmapped region of Nanopore reads, recovering 20% more reads [Citation63]. Thus, the median UMI counts per nucleus and the median gene counts per nucleus from Nanopore data were ∼64% and ∼70% of the Illumina counts, respectively, being highly consistent in all nuclei [Citation62].
Another similar and interesting approach for small-scale combination of Illumina and Nanopore sequencing was used to distinguish the isoform usage in the subcellular compartments of single cells in plants. A microfluidic approach was employed to separate nuclear from cytoplasmic RNA of 16 single cells, finding that nuclear transcripts are notably more diverse than cytoplasmic transcripts, with transcriptional noise emanating from the nucleus being regulated across the nuclear membrane and then either attenuated or amplified in the cytoplasm depending on the function involved [Citation64].
Other putative approaches: combining nanopore sequencing with short-read sequencing tools
As a polished version of the above-mentioned approaches, two studies have used the FLAMES pipeline (Framework to perform single-cell full-Length Analysis of Mutations and Splicing) for long-read isoform assembly, an approach providing cell barcode and UMI assignment from nanopore reads (using short-reads FLT-seq) and semi-supervised isoform discovery and quantification. The FLT-seq approach is also based on 10x Genomics droplet platform, using part of the reverse transcription product isolated from 20% of the GEMs (Gel Bead-in-emulsion similar to beads in inDrop protocol) to sequence it on both Illumina and PromethION platforms. The remaining 80% of the GEMs cDNA was sequenced only on THE short-read platform. Here, subsampling allowed to achieve greater sequencing depth for the long-reads, thus combining full-length transcript information with sufficient depth of the short-read data. This allowed not only for detecting novel and alternatively spliced transcripts, but also SNP (single nucleotide polymorphisms) in transcripts, and the ability to link SNPs in specific isoforms with their differential expression [Citation65]. Additionally, FLAMES was used in a Bulk-seq approach for long-read differential expression, where long-read data were initially assembled using FLAMS into full-length transcripts and then differential expression was assessed using short-read software tools. This latter approach suggests some short-read tools (limma-voom, FLAMES, DRIMSeq, limma-diffSplice (with stageR)) could be useful aid in Nanopore differential transcript usage analysis in both Bulk- and single cell sequencing. Similarly, tools such as Unicycler [Citation66] integrate long- and short-read data to produce hybrid assemblies, while other tools have been developed as pipelines to achieve this goal (e.g. Canu, Pilon and Racon in the ONT-assembly-polish pipeline [Citation34]). Still, combining tools and data types remains a challenge, usually requiring intensive manual integration.
Rolling circle amplification to concatemeric consensus (R2C2) method for building consensus sequence for improved accuracy over SMART-seq 2 protocol
When non-hybrid methods are concerned, all the reads are first aligned to each other and then a consensus is built and used to correct the individual reads. These corrected reads could be further used to produce an assembly or for other applications. Alternatively, rare oligomers in noisy long-read data could stem from sequencing errors and are sometimes discarded by tools like wtdbg2 assembler [Citation67], thus preventing error accumulation within an assembly.
An accurate consensus can also be derived from linear fragments if the same sequence is present multiple times: the concept of circularization followed by rolling circle amplification for generating nanopore libraries is similar to SMRT sequencing used in the PacBio platform, and subreads can be used to determine a high-quality consensus [Citation60, Citation68, Citation69]. ONT is developing a similar linear consensus sequencing strategy based on isothermal polymerization rather than circularization [Citation34]. As stated before, after assembly, the process of removing the remaining errors from contigs (rather than raw reads) is called ‘polishing’. One strategy is to use SMRT subreads through Arrow [Citation34] or nanopore electrical current traces through Nanopolish [Citation70], to improve the accuracy of the consensus. For nanopore data, polishing while also taking into account the base modifications (as implemented for instance in Nanopolish [Citation34, Citation70]) further improves the accuracy of an assembly.
In order to overcome the need for both short- and long-read sequencing in favor of long-read sequencing alone, a new method has been developed termed R2C2 (Rolling Circle Amplification to Concatemeric Consensus), being able to generate more accurate reads and thus generate full-length isoform-level transcriptomes for both genome annotation and differential expression analysis in bulk or single-cell samples [Citation60]. Unlike PacBio producing 200k circular high-quality sequences per run, ONT is able to produce up to 15 Gbases per R9.4.1 for ligation kit and 7-12 million full-length reads per MinION flowcell or 50 million full-length reads per PromethION flowcell, but due to its high error rate, the base-level identification of splice junction sequence is the main challenge [Citation71, Citation72]. To increase the base accuracy of cDNA sequences produced by the ONT MinION, a circular consensus principle applied by PacBio was used. The R2C2 method includes the following steps: RNA is reverse transcribed and amplified using the Tn5Prime [Citation73] protocol based on Smart-seq2 method, which incorporates a distinct template switch oligo (TSO) containing a 7-nt sample index and a second 8-nt index. Tn5Prime takes advantage of the Tn5 transposase-based Smart-seq2 protocol to create RNA-seq libraries that capture the 5′ end of transcripts, and thus defining the transcription start sites. Only full-length cDNA is then circularized using a modified Gibson Assembly utilizing special DNA splint. Rolling Circle Amplification (RCA) with Phi29 is used to amplify circularized cDNA, and then high molecular weight DNA is debranched using T7 Endonuclease, and sequenced on the ONT MinION. Using the C3POa (Concatemeric Consensus Caller using partial order alignments (POA)) workflow, being able to detect DNA splints, using BLAST-Like Alignment Tool (BLAT), and together with poaV2 and racon, the resulting 828 684 raw reads (aver. length 5 kb) are combined into an accurate consensus sequence, based on the subreads containing full-length or partial cDNA sequences. R2C2 allowed for accurate demultiplexing of the 7-nt and 8-nt indexes, like the ones used in 10x Genomics droplet protocols. Using 8 distinct combinations of 7-nt index (contained within the TSO), and 8-nt Illumina adapter index, 74% of cell sequenced reads were confidently assigned to them. This was done via custom demultiplexing based on Levenshtein distance between the observed sequence at the index position, and authors’ known input indexes. In 99.8% of these selected R2C2 reads, the combination of assigned indexes matched one of the distinct combinations present in the cDNA pool, while when the same was done for pure 1 D reads (ONT regular linear cDNA sequencing protocol), ONLY 22% were mapped, suggesting the significance of the R2C2 method [Citation60].
Barcode modification for improved recognition: scCOLOR-seq
Very recently, a novel protocol was introduced, allowing for even more accurate barcode assignment in ONT long-read only single-cell sequencing [Citation74]. So far, the Drop-seq, InDrop and 10x Genomics protocols use non-error corrected barcodes, while in the scCOLOR-seq (single-cell corrected long-read sequencing), the celllBC and UMI parts of the RNA-capture probes on the microbeads, are synthesized using homodimeric nucleoside phosphoramidite building blocks, allowing for error-corrected barcode/UMI sequencing. This is achieved by comparing the homodimeric dinucleotide based barcodes for complementarity across the entire barcode lengths, and assigning them to accurate barcode group, while those with single nucleotide error were assigned to mismatch barcode group. Using the accurate group, the sequencing error was fixed in the mismatch group. Similarly, the UMIs were compared and fixed. In single-cell sequencing applications, same UMIs per transcript allow to distinguish the multiple copies of a single transcript that have been produced by PCR amplification from the ones that were a result of expression. The directional network-based method first proposed by UMI-tools [Citation75] was modified to correct for UMI sequence duplication. The method evaluation with Illumina sequencing data showed theoretical base-calling accuracy for the barcode to be around 98.4%, which aligns with the reported accuracy of Illumina sequencing, while when ONT sequencing data were used, the theoretical base-calling accuracy of single-cell nanopore sequencing dropped to 91.8%, and even less − 86%, when barcodes had more than one sequencing error. scCOLOR-seq was able to recover 100% of UMIs, making it the only method with sufficient perspective for ONT based scRNA-seq [Citation74].
Conclusions
The introduction of long-read sequencing in single-cell transcriptomics is a new avenue that has great potential for elucidating complex transcript isoforms with multiple alternative exons or containing retained introns, in their full length. Nanopore sequencing has yet another advantage that is not directly applicable in the single cell context at this point, but detecting per base modifications could bring an additional layer of epi-transcriptomics information in near future, when cDNA amplification is no longer necessary.
Disclosure statement
The authors report no conflict of interest.
Data availability
This review has considered other published sources, where actual data deposition has been made available.
Additional information
Funding
References
- Lähnemann D, Köster J, Szczurek E, et al. Eleven grand challenges in single-cell data science. Genome Biol. 2020;21(1):1–35.
- Schubert C. The deepest differences. Nature. 2011;472:1127–1131.
- Tang F, Barbacioru C, Wang Y, et al. mRNA-Seq whole-transcriptome analysis of a single cell. Nat Methods. 2009;6(5):377–382.
- van Gelder RN, von Zastrow ME, Yool A, et al. Amplified RNA synthesized from limited quantities of heterogeneous cDNA. Proc Natl Acad Sci U S A. 1990;87(5):1663–1667.
- Navin N, Kendall J, Troge J, et al. Tumour evolution inferred by single-cell sequencing. Nature. 2011;472(7341):90–94.
- Coufal NG, Garcia-Perez JL, Peng GE, et al. L1 retrotransposition in human neural progenitor cells. Nature. 2009;460(7259):1127–1131.
- Schubert C. The deepest differences. Nature. 2011;460:1127–1131.
- Schubert C. The deepest differences. Nature. 2011;472:90–94.
- Teichmann S, Efremova M. Computational methods for single cell omics across modalities. Nat Methods. 2020;17:14–17.
- Hashimshony T, Senderovich N, Avital G, et al. CEL-Seq2: sensitive highly-multiplexed single-cell RNA-Seq. Genome Biol. 2016;17:77.
- Hashimshony T, Wagner F, Sher N, et al. CEL-Seq: Single-Cell RNA-Seq by multiplexed linear amplification. Cell Rep. 2012;2(3):666–673.
- Choi JR, Yong KW, Choi JY, et al. Single-Cell RNA sequencing and its combination with protein and DNA analyses. Cells. 2020;9(5):1130.
- Soumillon M, Cacchiarelli D, Semrau S, et al. Characterization of directed differentiation by high-throughput single-cell RNA-Seq. 2014; bioRxiv 003236; DOI: 10.1101/003236.
- Nichterwitz S, Chen G, Aguila Benitez J, et al. Laser capture microscopy coupled with smart-seq2 for precise spatial transcriptomic profiling. Nat Commun. 2016;7:12139.
- DeLaughter DM. The use of the fluidigm C1 for RNA expression analyses of single cells. Curr Protocols Mol Biol. 2018;122(1):1–17,e55. DOI: 10.1002/cpmb.55.
- Klein AM, Mazutis L, Akartuna I, et al. Droplet barcoding for Single-Cell transcriptomics applied to embryonic stem cells. Cell. 2015;161(5):1187–1201.
- Macosko EZ, Basu A, Satija R, et al. Highly parallel genome-wide expression profiling of individual cells using nanoliter Droplets. Cell. 2015;161(5):1202–1214.
- Picelli S, Faridani OR, Björklund ÅK, et al . Full-length RNA-seq from single cells using Smart-seq2 . Nat Protoc. 2014;9(1):171–181.
- Sasagawa Y, Danno H, Takada H, et al. Quartz-Seq2: a high-throughput single-cell RNA-sequencing method that effectively uses limited sequence reads. Genome Biol. 2018;19(1):29.
- Goldstein LD, Chen Y-JJ, Dunne J, et al. Massively parallel nanowell-based single-cell gene expression profiling. BMC Genomics. 2017;18(1):519.
- Islam S, Zeisel A, Joost S, et al. Quantitative single-cell RNA-seq with unique molecular identifiers. Nat Methods. 2014;11(2):163–166.
- Islam S, Kjallquist U, Moliner A, et al. Characterization of the single-cell transcriptional landscape by highly multiplex RNA-seq. Genome Res. 2011;21(7):1160–1167.
- Zheng GXY, Terry JM, Belgrader P, et al. Massively parallel digital transcriptional profiling of single cells. Nat Commun. 2017;8:14049.
- Kong SL, Li H, Tai JA, et al. Concurrent Single-Cell RNA and targeted DNA sequencing on an automated platform for comeasurement of genomic and transcriptomic signatures. Clin Chem. 2019;65(2):272–281.
- Keren-Shaul H, Kenigsberg E, Jaitin DA, et al. MARS-seq2.0: an experimental and analytical pipeline for indexed sorting combined with single-cell RNA sequencing . Nat Protoc. 2019;14(6):1841–1862.
- Nayak R, Hasija Y. A hitchhiker’s guide to single-cell transcriptomics and data analysis pipelines. Genomics. 2021;113(2):606–619.
- Bentley DR, Balasubramanian S, Swerdlow HP, et al. Accurate whole human genome sequencing using reversible terminator chemistry. Nature. 2008;456(7218):53–59.
- Pollard MO, Gurdasani D, Mentzer AJ, et al. Long reads: their purpose and place. Hum Mol Genet. 2018;27(R2):R234–R241.
- Goodwin S, McPherson JD, McCombie WR. Coming of age: ten years of next-generation sequencing technologies. Nat Rev Genet. 2016;17(6):333–351.
- Jeon SA, Park JL, Kim J-H, et al. Comparison of the MGISEQ-2000 and Illumina HiSeq 4000 sequencing platforms for RNA sequencing. Genomics Inform. 2019;17(3):e32.
- Quail M, Smith ME, Coupland P, et al. A tale of three next generation sequencing platforms: comparison of ion torrent, pacific biosciences and illumina MiSeq sequencers. BMC Genomics. 2012;13:341.
- Rothberg JM, Hinz W, Rearick TM, et al. An integrated semiconductor device enabling non-optical genome sequencing. Nature. 2011;475(7356):348–352.
- Heather JM, Chain B. The sequence of sequencers: the history of sequencing DNA. Genomics. 2016;107(1):1–8.
- Amarasinghe SL, Su S, Dong X, et al. Opportunities and challenges in long-read sequencing data analysis. Genome Biol. 2020;21(1):30.
- Jain M, Olsen HE, Paten B, et al. The oxford nanopore MinION: delivery of nanopore sequencing to the genomics community. Genome Biol. 2016;17(1):239.
- Rang FJ, Kloosterman WP, de Ridder J. From squiggle to basepair: computational approaches for improving nanopore sequencing read accuracy. Genome Biol. 2018;19(90):1–11, DOI: 10.1186/s13059-018-1462-9.
- Codina-Fauteux V-A, Beaudoin M, Lalonde S, et al. PHACTR1 splicing isoforms and eQTLs in atherosclerosis-relevant human cells. BMC Med Genet. 2018;19(1):97.
- Park J-W, Jang H-J, Shin S, et al. Molecular analysis of alternative transcripts of the equine Cordon-Bleu WH2 repeat Protein-Like 1 (COBLL1) Gene. Asian-Australas J Anim Sci. 2015;28(6):870–875.
- Wen L, Tang F. Single-cell sequencing in stem cell biology. Genome Biol. 2016;17(71):1–12, DOI: 10.1186/s13059-016-0941-0.
- Zhong S, Zhang S, Fan X, et al. A single-cell RNA-seq survey of the developmental landscape of the human prefrontal cortex. Nature. 2018;555(7697):524–528.
- Wick RR, Judd LM, Holt KE. Performance of neural network basecalling tools for oxford nanopore sequencing. Genome Biol. 2019;20(1):129.
- Boža V, Brejová B, Vinař T. DeepNano: Deep recurrent neural networks for base calling in MinION nanopore reads. Plos One. 2017;12(6):e0178751.
- Ewing B, Green P. Base-Calling of automated sequencer traces using phred. II. Error probabilities. Genome Res. 1998;8(3):186–194.
- Ewing B, Hillier L, Wendl MC, et al. Base-Calling of automated sequencer traces using phred. I. Accuracy assessment. Genome Res. 1998;8(3):175–185.
- Weirather JL, de Cesare M, Wang Y, et al. Comprehensive comparison of pacific biosciences and oxford nanopore technologies and their applications to transcriptome analysis. F1000Res. 2017;6:100.
- Fu S, Wang A, Au KF. A comparative evaluation of hybrid error correction methods for error-prone long reads. Genome Biol. 2019;20(1):26.
- Lima L, Marchet C, Caboche S, et al. Comparative assessment of long-read error correction software applied to nanopore RNA-sequencing data. Brief Bioinform. 2020;21(4):1164–1181.
- Broseus L, Thomas A, Oldfield AJ, et al. TALC: Transcript-level aware long-read Correction. Bioinformatics. 2020;36(20):5000–5006.
- Wang JR, Holt J, McMillan L, et al. FMLRC: Hybrid long read error correction using an FM-index. BMC Bioinformatics. 2018;19(1):50.
- Zhang H, Jain C, Aluru S. A comprehensive evaluation of long read error correction methods. BMC Genomics. 2020;21(Suppl 6):889.
- Walker BJ, Abeel T, Shea T, et al. Pilon: an integrated tool for comprehensive microbial variant detection and genome assembly improvement. PLoS One. 2014;9(11):e112963.
- Vaser R, Sović I, Nagarajan N, et al. Fast and accurate de novo genome assembly from long uncorrected reads. Genome Res. 2017;27(5):737–746.
- Jansen HJ, Liem M, Jong-Raadsen SA, et al. Rapid de novo assembly of the European eel genome from nanopore sequencing reads. Sci Rep. 2017;7(1):7213.
- Koren S, Walenz BP, Berlin K, et al. Canu: scalable and accurate long-read assembly via adaptive k-mer weighting and repeat separation . Genome Res. 2017;27(5):722–736.
- Schmidt MH-W, Vogel A, Denton AK, et al. De novo assembly of a new solanum pennellii accession using nanopore sequencing. Plant Cell. 2017;29(10):2336–2348.
- Miller DE, Staber C, Zeitlinger J, et al. Highly contiguous genome assemblies of 15 drosophila species generated using nanopore sequencing. G3 (Bethesda). 2018;8(10):3131–3141.
- Warren RL, Coombe L, Mohamadi H, et al. ntEdit: scalable genome sequence polishing. Bioinformatics. 2019;35(21):4430–4432.
- Singh M, Al-Eryani G, Carswell S, et al. High-throughput targeted long-read single cell sequencing reveals the clonal and transcriptional landscape of lymphocytes. Nat Commun. 2019;10(1):3120.
- Lebrigand K, Magnone V, Barbry P, et al. High throughput error corrected nanopore single cell transcriptome sequencing. Nat Commun. 2020;11(1):4025.
- Volden R, Palmer T, Byrne A, et al. Improving nanopore read accuracy with the R2C2 method enables the sequencing of highly multiplexed full-length single-cell cDNA Proceedings of the National Academy of Sciences of the United States of America 2018. 115.
- Liu W, Zhang X. Single-cell alternative splicing analysis reveals dominance of single transcript variant. Genomics. 2020;112(3):2418–2425.
- Long Y, Liu Z, Jia J, et al. FlsnRNA-seq: protoplasting-free full-length single-nucleus RNA profiling in plants. Genome Biol. 2021;22(1):66.
- Jia J, Long Y, Zhang H, et al. Post-transcriptional splicing of nascent RNA contributes to widespread intron retention in plants. Nat Plants. 2020;6(7):780–788.
- Oguchi Y, Ozaki Y, Abdelmoez MN, et al. NanoSINC-seq dissects the isoform diversity in subcellular compartments of single cells. Sci Adv. 2021;7(15):eabe0317.
- Tian L, Jabbari JS, Thijssen R, et al. Comprehensive characterization of single cell full-length isoforms in human and mouse with long-read sequencing. BioRxiv. 2020.
- Wick RR, Judd LM, Gorrie CL, et al. Unicycler: Resolving bacterial genome assemblies from short and long sequencing reads. PLoS Comput Biol. 2017;13(6):e1005595.
- Ruan J, Li H. Fast and accurate long-read assembly with wtdbg2. Nat Methods. 2020;17(2):155–158.
- Li C, Chng KR, Boey EJH, et al. INC-Seq: accurate single molecule reads using nanopore sequencing. GigaScience. 2016;5(1):34.
- Wilson BD, Eisenstein M, Soh HT. High-Fidelity nanopore sequencing of ultra-short DNA targets. Anal Chem. 2019;91(10):6783–6789. acs.analchem.
- Simpson JT, Workman RE, Zuzarte PC, et al. Detecting DNA cytosine methylation using nanopore sequencing. Nat Methods. 2017;14(4):407–410.
- Byrne A, Beaudin AE, Olsen HE, et al. Nanopore long-read RNAseq reveals widespread transcriptional variation among the surface receptors of individual B cells. Nat Commun. 2017;8:16027.
- Kuo RI, Tseng E, Eory L, et al. Normalized long read RNA sequencing in chicken reveals transcriptome complexity similar to human. BMC Genomics. 2017;18(1):323.
- Cole C, Byrne A, Beaudin AE, et al. Tn5Prime, a Tn5 based 5’ capture method for single cell RNA-seq. Nucleic Acids Res. 2018;46(10):e62.
- Philpott M, Watson J, Thakurta A, et al. Nanopore sequencing of single-cell transcriptomes with scCOLOR-seq. Nat Biotechnol. 2021; DOI: 10.1038/s41587-021-00965-w.
- Smith T, Heger A, Sudbery I. UMI-tools: modeling sequencing errors in unique molecular identifiers to improve quantification accuracy. Genome Res. 2017;27(3):491–499.