
Abstract
Effective tiller number (ETN) is an important factor affecting plant architecture and wheat yield. The reduction of genetic diversity in common wheat breeding forces us to explore new genetic resources for ETN from wheat related species to increase wheat yield. Here, a tetraploid wheat recombinant inbred line (RIL) population developed from the cross between a durum and a wild emmer accession was used to construct a genetic map using the wheat 55 K single nucleotide polymorphism (SNP) array. The map contained 1154 SNP markers with a total length of 2452.79 cM and an average density of 2.13 cM/marker. Quantitative trait locus (QTL) analysis identified a major and stably expressed QTL, Qetn-DW-4B.1 for ENT, explaining 12.40–15.25% of the phenotypic variation. The favorable allele of this QTL was from wild emmer wheat and physically mapped in a 2.25 Mbp interval of 4BL containing 23 genes among which several were likely related to tiller development. Further comparison with previous studies showed that Qetn-DW-4B.1 is likely a novel QTL. Genetic associations between ETN and other agronomic traits were also analyzed. Collectively, this study reported a major QTL for ENT from related species and lays a foundation to fine mapping and further wheat molecular breeding.
Supplemental data for this article is available online at https://doi.org/10.1080/13102818.2021.1996271 .
Introduction
Bread wheat (Triticum aestivum L.) is among the most widely planted crops in the world providing about 20% of food energy to humans (http://www.fao.org/faostat). Increasing food production is of great importance for solving future food supply and security issues given the increase of world population and the decrease of the planting area. Wheat yield is determined by spike number per unit area (SNPA), kernel number per spike (KNS) and kernel weight (KW). Effective tiller number (ETN) directly affects SNPA, and thus plays an important role in wheat yield. Therefore, dissecting the genetic mechanism of ETN at QTL level could shed light on the role of ETN in yield formation.
Till now, a large number of QTL for ETN have been reported and they are distributed on all of the 21 chromosomes of bread wheat [Citation1–8]. However, very few of them are major and stably expressed across different environments. Compared to rice, for which some tiller-related genes (e.g. MOC1, HTD1, D10, D14) have been cloned [Citation9–13], almost no genes in wheat have been reported, although [Citation14] reported that a gene, TaD27-B, in wheat was involved in strigolactone biosynthesis and regulated the number of tillers and some researchers identified numerous QTL for tiller number (e.g. Liu et al. [Citation7]).
Modern wheat breeding is facing the bottleneck of narrow genetic basis. Luckily, numerous genetic resources from wheat related species can contribute to coping with future wheat production challenges. Wild emmer wheat is the tetraploid progenitor of modern tetraploid durum and hexaploid common wheat, and characterized by numerous advantages including resistance to various diseases and possession of important agronomic traits, thus serving as a promising source of favorable alleles in wheat breeding (Citation15–17). Therefore, it is necessary to identify genes from wild emmer wheat aiming at improving wheat breeding.
In this study, a high-quality genetic map was constructed based on a RIL population developed from the cross between a durum and a wild emmer wheat using the wheat 55 K SNP array. Further, we identified a major and stably expressed QTL for the ETN at multiple environments.
Materials and methods
Plant materials and trait measurement
The recombinant inbred line (RIL) used in this study, including 116 F6-F9 lines, was derived from a cross between a durum wheat (DU09123, Triticum turgidum L. var durum) and a wild emmer genotype (WE34021, T. turgidum subsp. dicoccoides). They were both provided by Sichuan Agricultural University. The RILs and their parents were evaluated for agronomic traits in completely randomized design for four consecutive years, 2017–18 (E1) and 2018–19 (E2), 2019–20 (E3), 2020–21 (E4) at the experimental field area of Southwest University of Science and Technology. Standard agronomic practices were applied from sowing to harvest. For the RILs, a single line was space-planted (0.1-m) in a single 1.5-m row with a 0.3-m of row spacing. Plant height (PH), spikelet number per spike (SNS), spike length (SL) and effective tiller number (ETN), from five plants for each line were determined as described by [Citation18]. Flowering date (AD) was calculated from the sowing date to the date when half of the plants for a given line flowered. Kernel number per spike (KNS) and kernel weight per spike (KWS) from five harvested representative and well-pollinated spikes per line were measured. After threshing and drying, the kernels were used for kernel length (KL) and width (KW) and thousand kernel weight (TKW) were measured for three replicates as described by [Citation19].
Data analysis
Pearson’s correlation, frequency distribution, standard error and the Student’s t-test (p < 0.05) were analyzed using the IBM SPSS Statistics 25 (Armonk, NY, USA). The broad-sense heritability (H2) and best linear unbiased prediction (BLUP) of agronomic traits from multiple environments were calculated using SAS version 8.0 (Cary, North Carolina).
Construction of the genetic map
The leaves of RILs and parents were used to extract DNA using the DNAsecure Plant Kit (Qiagen, Cat.No. DP320). The DNA of 116 RILs was subsequently genotyped by CapitalBio Technology (Beijing, China) using the wheat 55 K SNP array.
The genetic map was constructed as described by (6). Detailedly, as suggested by the company, only the Poly High-Resolution markers from A and B subgenomes showing a minor allele frequency (≥ 0.3) were kept. The BIN function of QTL IciMapping 4.1 [Citation20] was used to analyze the redundant markers with ‘Distortion value’ and ‘Missing rate’ being set as 0.01 and 20%, respectively. The bin markers were then grouped and sorted, and further used for genetic map construction using the Kosambi mapping function in IciMapping 4.1.
QTL detection
QTL was calculated using the inclusive composite interval mapping (ICIM) in the Biparental Populations (BIP) module of QTL IciMapping 4.1. A threshold of LOD > 2.5 was used to declare the presence of putative QTLs. QTL identified in at least three environments (including BLUP) and explained more than 10% of the phenotypic variation were regarded as major ones, while those having common flanking markers were treated as a single one.
Predicated genes in the interval of QTL
Sequences of the SNP markers were searched against the wild emmer (accession Zavitan) [Citation21], durum wheat (accession Svevo) [Citation22] and bread wheat genotype (accession ‘Chinese Spring’, CS) (IWGSC RefSeq v2.1) [Citation23] genome sequences to identify their physical positions to determine the physical interval of the QTL. Predicted genes located between the flanking markers and their function annotations were obtained from the Triticeae Multi-omics Center (http://202.194.139.32/).
Results
Construction of genetic map
A total of 8567 SNP markers (minor allele frequency ≥ 0.3) were obtained. As there is no D genome in tetraploid, 815 markers from the D genome were removed. Finally, 7752 SNP markers were classified into 1184 bins, which were used to construct the genetic map. Finally, 1154 bin markers were mapped on 14 linkage groups each representing each chromosome (, ). The linkage group ranged between 85.67 cM (4B) and 223.10 cM (5 A). The average distance of bin markers was between 1.16 cM (4B) and 3.64 cM (3B), with an average density of 2.13 cM/marker. The number of mapped markers ranged between 58 on chromosome 6 A and 118 on chromosome 2B (, ).
Table 1. Statistics of the genetic map for the RIL population.
Phenotype analysis
The ETN of DU and WE in multiple environments ranged between 8.40 and 9.40, and 10.06 and 12.20, respectively (). That of DW RILs ranged between 4.00 and 26.60. WE showed significant higher ETN than DU in four environments. Continuous variation and bidirectional transgressive segregation of ETN was observed in the RIL population. The estimated broad-sense heritability (H2) of ETN was 0.93, indicating that ETN was mainly affected by genetic factors. The frequency distribution of ETN in multiple environments indicated that it was polygenically inherited (). Significant Pearson’s correlation ranging from 0.70 to 0.92 (p < 0.01) was detected for SNS among the four environments ().
Figure 1. Phenotypic distribution of effective tiller number (ETN) in four environments. Different environments (E1–E4): 2017–18 (E1) and 2018–19 (E2), 2019–20 (E3), 2020–21 (E4).
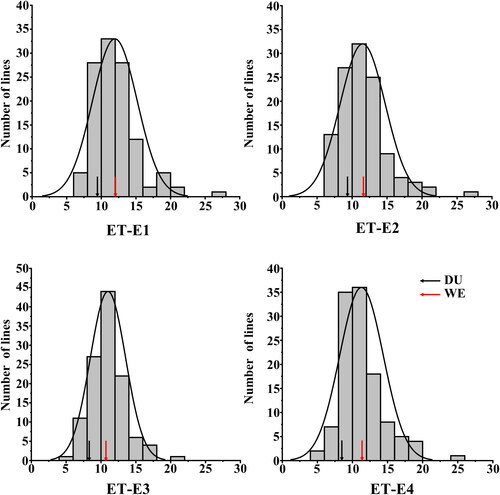
Table 2. Phenotypic data effective tiller number (ETN) for the DW population at different environments.
Table 3. Correlation coefficients of ET in different environments.
QTL analysis
Based on the constructed genetic map and phenotype data, two QTL for ETN were identified. They were both distributed on chromosome 4B, and the positive alleles of these two QTL were both from WE ().
Table 4. Quantitative trait loci (QTL) for effective tiller number (ETN) identified in multiple environments in the DW population.
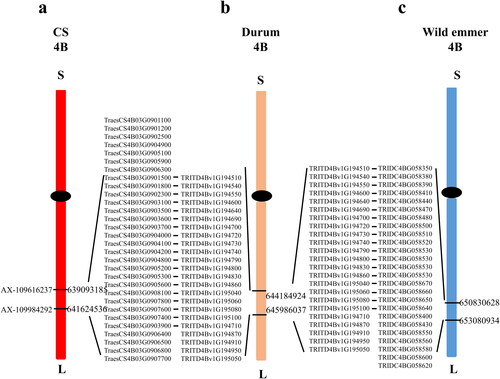
Qetn-DW-4B.1 was stably identified in three environments and the BLUP dataset, explaining 12.40–15.25% of the phenotypic variation, which was treated as a major QTL. The LOD scores ranged between 3.31 and 4.15 (, ). Its effect on increasing ETN was further analyzed according to the genotypes of the flanking markers (). Compared to the haplotype group carrying the negative alleles, that with favorable alleles of Qetn-DW-4B.1 increased ETN significantly by between 19.54% and 27.23%. It was physically located at 650.83–653.08 Mb (2.25 Mb) on chromosome 4BL of wild emmer genome, 644.18–645.95 Mb (1.80 Mb) on 4BL of durum genome, and 641.62–639.09 Mb (2.53 Mb) on 4BL of CS genome, and there were 25, 23 and 30 predicted genes in the respective intervals with 18 orthologs in the corresponding intervals (, ).
Figure 2. Genetic maps of the major QTL Qetn-DW-4B.1 and its effect. *Significance level at p < 0.05, **Significance level at p < 0.01.
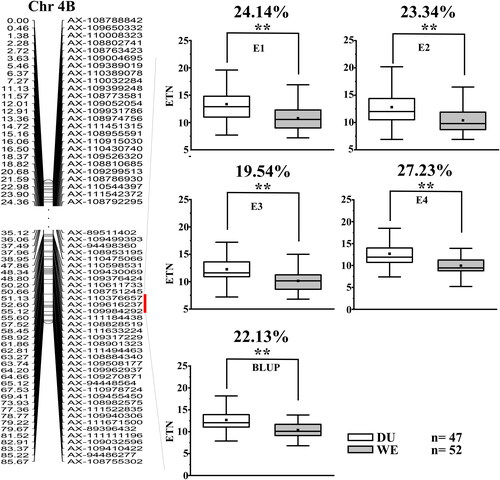
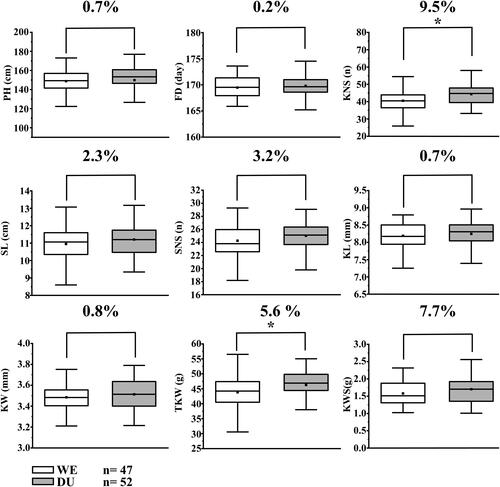
Figure 3. Student’s t-test against the two haplotype groups from DW population with the positive or negative alleles of Qetn -DW-4B.1 plant height (PH), flowering date (FD), kernel number per spike (KNS), spike length (SL), spikelet number per spike (SNS), kernel length (KL) and width (KW), thousand kernel weight (TKW), and kernel weight per spike (KWS). *Significance level at p < 0.05, **Significance level at p < 0.01.
Qetn-DW-4B.2 was only detected in a single environment being about 10 cM far away from Qetn-DW-4B.1, with the 3.24 of LOD and 13.00 of explained phenotypic variation (). As Qetn-DW-4B.2 is close to Qetn-DW-4B.1, whether they are the same locus is yet to be further analyzed by fine mapping in the future.
The QTL-by-Environment interaction analysis identified 17 QTL (). Two of them, Qetn-DW-4B.1 and Qetn-DW-4B.2, were the same as detected in individual environment analysis, indicating that they were major QTL for ETN.
Genetic correlations between Qetn-DW-4B.1 and other agronomic traits
We analyzed the correlation between Qetn-DU-4B.1 and other nine agronomic traits. The 114 lines in the DW population were divided into two groups (excluding heterozygous lines) based on the genotypes of the two flanking markers AX-109616237 and AX-109984292, with one carrying homozygous alleles from DU and the other group from WE. The results showed that lines carrying WE allele have significantly lower (p < 0.05) TKW and GNP that those carrying DU allele. No significant differences were detected between the groups for PH, FD, SL, SNS, KL, KW and KWS ()
Figure 4. Orthologs in the intervals of the major QTL Qetn -DW-4B.1.
Discussion
Evaluation, identification and utilization of genetic resources from wheat related species is of importance for increasing bread wheat yield. Here, we identified a major QTL for ETN from a tetraploid wheat RIL population developed from the cross between a durum and a wild emmer accession, which will be useful for fine mapping and wheat molecular breeding.
To date, several studies have reported QTL for ENT on chromosome 4B. Naruoka et al. [Citation24] identified a QTL for productive tiller number on 4B close to SSR marker gwm495 (at 482.8 Mbp on CS 4BL). Liu et al. [Citation25] and Deng et al. [Citation26] detected a major QTL for ETN close to Xgwm113 (256.3 Mbp) on CS 4BS. Liu et al. [Citation6] identified a major and stably expressed QTL between 28.9 and 32.1 Mbp. These reported QTL were all physically far away from Qetn-DU-4B.1 (639.1–641.6 Mbp) identified in this study. Additionally, the favorable allele of this QTL was from wild emmer, further indicating that Qetn-DU-4B.1 is most likely a novel locus and has great potential in common wheat breeding.
In the interval of the major QTL Qetn-DW-4B.1, there are 18 orthologs. Of them, TRIDC4BG058350 belongs to a member of the MADS-box gene family which has been reported to be involved in rice tillering [Citation27]. TRIDC4BG058410 is a gene encoding basic helix-loop-helix (bHLH) DNA-binding superfamily protein, which is broadly present in plants and participates in growth and development of various organs [Citation28]. These genes will be useful for further fine mapping and gene cloning ().
Numerous studies have reported correlations between ETN and other agronomic traits. Naruoka et al. [Citation24] reported that the TGW is negatively correlated with the ETN, being consistent with the result reported here. These results suggested that the favorable allele of Qetn-DU-4B.1 could negatively affect TGW and KNS, and thus it should be properly utilized in wheat breeding. As no significant differences were detected between the groups for PH, FD, SL, SNS, KL, KW and KWS (), it is likely that Qetn-DU-4B.1 plays an individual role without interaction with PH and FD. Liu et al. [Citation7] also reported that Qetn-sau-1B.1 for ETN was not related to FD.
Conclusions
We constructed a genetic map for a tetraploid wheat recombinant inbred line (RIL) population using the wheat 55 K single nucleotide polymorphism (SNP) array. The ETN for this RIL population was evaluated in four environments. Two major QTL for ENT were identified. The positive alleles of them were both from wild emmer, implying their great breading potential. One major QTL, Qetn-DW-4B.1 can be stably expressed in different environments. It was physically mapped in a 2.25 Mbp interval containing 23 genes with several likely related to tiller development on 4BL of wild emmer reference genome. Comparison analysis suggested Qetn-DW-4B.1 may be a novel locus for ENT. Genetic analysis revealed Qetn-DW-4B.1 was not correlated to PH and FD. These results provide an example of exploration favorable gene resources from wheat related species toward at improving wheat breeding.
Supplemental Material
Download MS Excel (191.2 KB)Disclosure statement
No potential conflict of interest was reported by the authors.
Data availability statement
All data generated or analyzed during this study are included in this article and its supplementary information files; further inquiries can be directed to the corresponding author.
Additional information
Funding
Related Research Data
References
- An D, Su J, Liu Q, et al. Mapping QTLs for nitrogen uptake in relation to the early growth of wheat (Triticum aestivum L.). Plant Soil. 2006;284(1–2):73–84.
- Araki E, Miura H, Sawada S. Identification of genetic loci affecting amylose content and agronomic traits on chromosome 4A of wheat. Theor Appl Genet. 1999;98:977–984.
- Kumar N, Kulwal P, Balyan H, et al. QTL mapping for yield and yield contributing traits in two mapping populations of bread wheat. Mol Breed. 2007;19(2):163–177.
- Li Z, Peng T, Xie Q, et al. Mapping of QTL for tiller number at different stages of growth in wheat using double haploid and immortalized F2 populations. J Genet. 2010;89(4):409–415.
- Liu G, Jia L, Lu L, et al. Mapping QTLs of yield-related traits using RIL population derived from common wheat and Tibetan semi-wild wheat. Theor Appl Genet. 2014;127(11):2415–2432.
- Liu J, Luo W, Qin N, et al. A 55 K SNP array-based genetic map and its utilization in QTL mapping for productive tiller number in common wheat . Theor Appl Genet. 2018;131(11):2439–2450.
- Liu J, Tang H, Qu X, et al. A novel, major, and validated QTL for the effective tiller number located on chromosome arm 1BL in bread wheat. Plant Mol Biol. 2020;104(1–2):173–185.
- Ren T, Hu Y, Tang Y, et al. Utilization of a Wheat55K SNP array for mapping of major QTL for temporal expression of the tiller number. Front Plant Sci. 2018;9:333.
- Arite T, Iwata H, Ohshima K, et al. DWARF10, an RMS1/MAX4/DAD1 ortholog, controls lateral bud outgrowth in rice. Plant J. 2007;51(6):1019–1029.
- Arite T, Umehara M, Ishikawa S, et al. d14, a strigolactone-insensitive mutant of rice, shows an accelerated outgrowth of tillers. Plant Cell Physiol. 2009;50(8):1416–1424.
- Li X, Qian Q, Fu Z, et al. Control of tillering in rice. Nature. 2003;422(6932):618–621.
- Zhang Z, Sun X, Ma X, et al. GNP6, a novel allele of MOC1, regulates panicle and tiller development in rice. Crop J. 2021;9(1):57–67.
- Zou J, Chen Z, Zhang S, et al. Characterizations and fine mapping of a mutant gene for high tillering and dwarf in rice (Oryza sativa L.). Planta. 2005;222(4):604–612.
- Zhao B, Wu TT, Ma SS, et al. TaD27-B gene controls the tiller number in hexaploid wheat. Plant Biotechnol J. 2020;18(2):513–525.
- Xie W, Nevo E. Wild emmer: genetic resources, gene mapping and potential for wheat improvement. Euphytica. 2008;164(3):603–614.
- Yin H, Fang X, Li P, et al. Genetic mapping of a novel powdery mildew resistance gene in wild emmer wheat from “ "Evolution Canyon" in Mt. Carmel Israel”. Theor Appl Genet. 2021;134(3):909–921.
- Yu J, Zhao Y, Ding M, et al. Wild emmer chromosome arm substitution lines: Useful resources for wheat genetic study and breeding. Crop Sci. 2020;60(4):1761–1769.
- Ma J, Ding P, Liu J, et al. Identification and validation of a major and stably expressed QTL for spikelet number per spike in bread wheat. Theor Appl Genet. 2019;132(11):3155–3167.
- Qu X, Liu J, Xie X, et al. Genetic mapping and validation of loci for kernel-related traits in wheat (Triticum aestivum L.). Front Plant Sci. 2021;12:667493.
- Meng L, Li H, Zhang L, et al. QTL IciMapping: Integrated software for genetic linkage map construction and quantitative trait locus mapping in biparental populations. Crop J. 2015;3(3):269–283.
- Zhu T, Wang L, Rodriguez JC, et al. Improved genome sequence of wild emmer wheat zavitan with the aid of optical maps. G3 (Bethesda). 2019;9(3):619–624.
- Maccaferri M, Harris NS, Twardziok SO, et al. Durum wheat genome highlights past domestication signatures and future improvement targets. Nat Genet. 2019;51(5):885–895.
- Zhu T, Wang L, Rimbert H, et al. Optical maps refine the bread wheat Triticum aestivum cv chinese spring genome assembly. Plant J. 2021;107(1):303-314.
- Naruoka Y, Talbert L, Lanning S, et al. Identification of quantitative trait loci for productive tiller number and its relationship to agronomic traits in spring wheat. Theor Appl Genet. 2011;123(6):1043–1053.
- Liu S, Zhou R, Dong Y, et al. Development, utilization of introgression lines using a synthetic wheat as donor. Theor Appl Genet. 2006;112(7):1360–1373.
- Deng S, Wu X, Wu Y, et al. Characterization and precise mapping of a QTL increasing spike number with pleiotropic effects in wheat. Theor Appl Genet. 2011;122(2):281–289.
- Guo S, Xu Y, Liu H, et al. The interaction between OsMADS57 and OsTB1 modulates rice tillering via DWARF14. Nat Commun. 2013;4:1566.
- Heim MA, Jakoby M, Werber M, et al. The basic helix-loop-helix transcription factor family in plants: a genome-wide study of protein structure and functional diversity . Mol Biol Evol. 2003;20(5):735–747.