
 ?Mathematical formulae have been encoded as MathML and are displayed in this HTML version using MathJax in order to improve their display. Uncheck the box to turn MathJax off. This feature requires Javascript. Click on a formula to zoom.
Abstract
Determining the genetic diversity and population structure of the modern hexaploid wheat varieties currently grown in Bulgaria is fundamental for selection of genotypes with desirable traits resilient under climatic fluctuations and development of successful crop improvement programmes. In this study, simple sequence repeat (SSR) markers were used to characterize a population of 117 modern wheat varieties (Triticum aestivum L.) from Bulgaria and several Western, Central and Eastern European countries. The genetic diversity was higher in the Western and Central European varieties than in the Bulgarian and the remaining Eastern European ones. Model-based population structure analysis defined 2 sub-populations (K = 2) dividing the Central and Western European varieties from the Bulgarian ones. Subsequent genetic structure analysis at K = 3 revealed an additional separation of the Bulgarian varieties in two distinct sub-populations. The phenotypic diversity among the varieties was evaluated in the fields of Dobrudzha Agricultural Institute, G. Toshevo in North-Eastern Bulgaria for three consecutive years. The distribution of the varieties in the biplot analysis in terms of grain yield and its components revealed differences in their adaptation to the agro-climatic conditions of North Bulgaria according to their geographical origin. These results and the prevalence of specific SSR alleles in the sub-populations suggest distinct adaptive mechanisms to specific agro-ecological regions. The data will be of interest for both breeders and farmers and could serve as a basis for wheat improvement programmes and further association mapping for important agronomic traits expressed under different environmental conditions.
Supplemental data for this article is available online at https://doi.org/10.1080/13102818.2021.1996274 .
Introduction
Wheat is the most important cereal crop, with 772 million tonnes produced in 2017 [Citation1] and one of the major staple food crops over the world after rice. It occupies a central place in human nutrition providing 20% of the daily protein and food calories [Citation2]. Wheat based foods provide a range of essential and beneficial components to the human diet, including protein, B vitamins, dietary fibres and phytochemicals [Citation3].
Among wheat crops, bread wheat (Triticum aestivum L.) is the most important because of its pivotal role in world food security. The Green Revolution has allowed an increase in wheat production and development of high-yielding varieties all over the world and in Europe. However, during the last 20 years, the wheat yield in Europe has faced stagnation [Citation4]. The necessity for increasing wheat production is of a high priority to reach a global food security under the deepening negative impact of climate changes and the growing human population, which is expected to reach over 9 billion by 2050 [Citation5].
Bread wheat has accumulated huge genetic diversity during its evolution from einkorn. However, during the last several decades the genetic diversity in the present-day wheat has decreased basically due to the repeated cultivation of landraces for desirable traits, adaptation to particular agro-climatic conditions, the development and use of uniform varieties to meet the requirements of the food industry [Citation6, Citation7]. Narrowing of the genetic diversity has become a major concern for future genetic progress. Genetic diversity is crucial for the adaptability and survival of wheat species against infectious pests and diseases [Citation8] and climate fluctuations, which are expected to become a major constraint for food security in the future. In order to avoid this, strategies to characterize and protect genetic diversity at both national and regional level are required. The reduction of genetic diversity encouraged the use of genetic resources in wheat breeding programmes.
The characterization of wheat varieties at molecular and phenotypic level is essential for preserving the existing genetic diversity, which would allow selection of varieties well adapted to the specific agro-climatic and soil conditions in order to meet the challenges imposed by the changing climatic conditions. However, the morphological markers are of limited number and the expression of quantitative traits is strongly affected by the environment.
The progress in molecular genetics technologies and the development of the Next Generation Sequencing (NGS) during the last few decades benefitted our understanding of the wheat genome organization and evolution, and provided reliable approaches for fast and efficient breeding. With the expansion of novel technologies, a range of polymerase chain reaction (PCR)-based DNA markers (RAPD, AFLP, SSR, EST-SSR, ISSR, IRAP, RBIP, TD, SNP, etc.) were developed in wheat, which allowed their utilization in genotypic identification, gene diversity analysis, QTL mapping, etc. in different Triticeae species [Citation9–13]. Molecular marker techniques vary in data generation efficiency and the genome area covered in the study [Citation6]. The choice of a marker type for a study depends on the crop species and the goals of experiments. Among the molecular markers used in wheat studies in recent years, SSR (simple sequence repeats or microsatellites) and SNP (single nucleotide polymorphism) markers are the most applicable due to their co-dominant nature and wide coverage across the genome.
SSR markers are widely distributed throughout the cereal genomes and can be found in both coding and non-coding regions [Citation14, Citation15]. Although their number is lower than SNP markers, they continue to be widely used in various research projects. Nowadays, SSR databases are publicly available for various crops including wheat [Citation16]. Moreover, many studies have claimed SSR markers to be a versatile tool in plant breeding programmes [Citation10] and they are the more efficient choice in genetic diversity studies than SNPs due to their faster rate of mutation and the elevated levels of polymorphism, which can be found with a small number of highly polymorphic markers [Citation17].
At present, large number of SSR markers have been developed and applied in wheat genetic studies, for identification of traits expressed under abiotic (drought and heat) [Citation18–22] and biotic stress (resistance to fusarium head blight, powdery mildew, septoria nodorum blotch, spot blotch) [Citation23–29].
SSR markers have been widely used for analysis of population structure, genetic diversity and relationships among wheat genotypes which are of major importance for the development of appropriate breeding plans [Citation22]. The population structure information allows utilization of the natural diversity for detection of genes/QTLs of agronomic importance using the existing genetic technologies [Citation30]. In the last few decades genetic diversity studies have made huge progress from simple detection of various morphological to molecular traits variation on DNA level [Citation31]. Determining the existing genetic diversity is of a high importance for selection of superior genotypes for further crop enhancement programmes [Citation32].
Bulgaria is one of the major producers of bread wheat in South-Eastern Europe. According to the Black Sea Agriculture Markets Analyst, Refinitiv (https://www.refinitiv.com/perspectives/trading/what-are-the-prospects-for-this-seasons-black-sea-wheat/), the wheat production of the Black Sea countries like Russia, Ukraine, Romania and Bulgaria accounts for 1/3 of the global wheat exports.
Improving the yield capacity and the quality of grain of bread wheat is a major task at present because of the unpredictable climatic changes in recent years. Hence, uncovering the molecular basis of complex adaptation of wheat including tolerance to abiotic and biotic stresses and selection of germplasm with better performance under unfavourable meteorological conditions is a primary aim of breeders to enhance the crop production in Bulgaria.
This study aimed to determine the genetic diversity and population structure of the bread wheat varieties currently grown in Bulgaria using SSR markers and phenotypic data to reveal the potential of the genotypes for further use in breeding programmes for sustainable agricultural production.
Materials and methods
Plant material
The plant material consisted of a germplasm collection of 117 modern winter wheat (Triticum aestivum L.) varieties currently grown in Bulgaria. The Bulgarian wheat is presented by 79 wheat varieties developed in Dobrudzha Agricultural Institute – G. Toshevo (DAI), Institute of Plant Genetic Resources – Sadovo (IPGR), and two Bulgarian Seed Houses (Supplemental material Table S1). The foreign germplasm is presented by the varieties from several European Union Member States and breeding companies: France (17), Austria (5), Serbia (6), Croatia (1), Germany (2), the Czech Republic (1), Syngenta (3) and KWS (3).
Table 1. SSR markers, major allele frequency, allele number, expected (He or GD), observed heterozygosity (Ho) and Polymorphic information content (PIC) in the studied wheat population consisting of 117 bread wheat varieties and across the three genomes.
Phenotype recording
Field experiments were conducted in three crop seasons (2017–2020) in the fields of Dobrudzha Agricultural Institute – G. Toshevo, North-Eastern Bulgaria. The region is typical for wheat production. Sowing was done up to the middle of October of each year. Field trials were organized in plots of 10 m2 each using complete randomized design with two replications. Ten plants per variety were used for the analysis before harvesting. The following traits were evaluated and measured each cropping season: Days-to-heading (HD), Plant height (PH), Thousand kernel weight (TKW), Grain yield (GY), Hectolitre weight (Hectl) and Number of grains per ear (NGE).
DNA extraction
DNA samples were extracted from a 100 mg bulked fresh leaf tissue of 10 individual plants/genotype using a Gene All (ExgeneTM Plant SV mini) (Tribioscience, Seoul, Korea). The concentration and the purity of DNA samples were determined with a NanoDrop spectrophotometer (Thermo Fisher Scientific, Wilmington, DE, USA).
Genotyping with SSR markers
PCR was done with 22 SSR markers including 16 Xgwm [Citation33], 1 Xwmc [Citation34], 4 Xbarc [Citation35] and 1 CFA (Xcfa) [Citation36]. Xbarc primers were extended with generic non-complementary nucleotide sequences tagF 5-ACGACGTTGTAAAA-3′ and tagR 5-CATTAAGTTCCCATTA-3′, respectively, at their 5′ ends as described in Hayden et al. [Citation37]. The SSR amplification was carried out according to Roder et al. [Citation33] and Hyden et al. [Citation37] using forward primers labelled with the FAM, ATTO565 (PET) or ATTO550 (NED) to allow direct detection of alleles on the automated capillary sequencer (ABI3130, Thermo Fisher Scientific, Wilmington, DE, USA). All primers were synthesized by Microsynth (Microsynth AG, Balgach, Switzerland).
All uniplex PCR reactions (PCR) were performed in a 6-µL reaction mixture containing 25–30 ng of genomic DNA, 2x MyTaq HS mix (Bioline), 0.5 pmol/L of each primer and miliQ water.
PCR was performed on a Veriti96 Thermal Cycler (Thermo Fisher Scientific, Wilmington, DE, USA) using the PCR conditions described for each marker type [Citation33, Citation37].
Electrophoresis and visualization of SSR alleles was performed on an ABI3130 DNA analyzer. A standardized multi-pooling procedure was used to prepare SSR products for electrophoresis. After PCR, a 3-fold (for Barc SSRs) or 10-fold (for the remaining SSRs) initial dilution of the PCR products was performed. Additional dilutions (up to 1/25–1/75× or 500–750×) were done depending of the intensity of the signal after the subsequent mixing of the labelled products, respectively FAM: PET: NED (Barc SSRs) or FAM: PET (Xgwm, Xwmc and Xfca). Nine mixed pools were used according to the length of the PCR products. Subsequently, the diluted products were mixed with labelled internal standards GeneScan™ 500 LIZ™ dye Size Standard (Thermo Fisher Scientific, Wilmington, DE, USA) and formamide, denatured and electrophoresed on an ABI3130 DNA analyzer. SSR allele sizing was performed with the Gene Mapper v4.0 software program (Thermo Fisher Scientific, Wilmington, DE, USA).
Data analysis
Allele number, frequency of alleles, observed heterozygosity (Ho), expected heterozygosity (He) and Polymorphic Information Content (PIC) were determined using Power Marker v. 3.25 [Citation38].
The Nei 83DA distance matrix [Citation39] was used to construct a phylogenetic tree with the unweighted pair group method with arithmetic mean (UPGMA) module of Power Marker v3.25. The resulting tree was visualized and annotated by using the Evolview v3 webserver [Citation40].
The genetic structure among the genotypes was studied using two approaches: a model-based method implemented with STRUCTURE 2.3 [Citation41] and discriminant analysis of principal components (DAPC) [Citation42]. The model-based analysis was run hypothesizing from one to ten distinct populations (K = 1 to K = 10), using an admixture model with correlated allele frequencies with 100,000 burn-in phases and 1,000,000 MCMC iterations in 10 independent runs. The most probable number of populations was determined using the ΔK method [Citation43] as implemented in Structure Harvester v. 6.93 [Citation44]. The visualization of the resulting clusters was done using pophelper package in R version 4.1.1 (https://www.r-project.org/). All basic statistics of genetic diversity and the level of differentiation between populations defined in the model-based analysis were evaluated in R version 4.1.1 (https://www.r-project.org/).The degree of differentiation between the resulting genetic clusters was evaluated using pairwise Jost’s D [Citation45] and analysis of molecular variance (AMOVA) in R version 4.1.1.
We examined how the genotypes from the populations established by the model-based method are clustered according to their performance in the six quantitative phenotypic traits described above, using principal component analysis (PCA). The PCA was done using the best unbiased linear predictions (BLUPs) across the three experimental seasons. The BLUP values were extracted from the model:
where μ is the overall mean, gi is the random effect of the ith genotype, rj is the random effect of the jth replication, sk is the random effect of the kth season, (gs)ik is the random effect of the interaction between ith genotype and kth season and εijk is the random error of the model [Citation46]. All phenotypic data analysis and visualization were performed in R version 4.0.5 (https://www.r-project.org/).
Results
Genetic diversity analysis
To explore the genetic diversity and population structure, we investigated the patterns of molecular diversity with 22 SSR markers in the wheat germplasm collection consisting of 117 accessions, including 79 modern Bulgarian varieties and 38 foreign varieties that were also phenotypically evaluated during 3 subsequent crop seasons (2017–2020).
The markers were selected to cover all 7 chromosomes of wheat with a minimum of 2 markers per chromosome. The diversity pattern of the 22 SSR loci across the whole set of accessions revealed a total of 179 distinct alleles ranging from 4 in locus Xgwm458-1DL to 15 in locus Xcfa2086-2AL with a mean of 8.14 alleles per locus (). Several genotypes showed null alleles in 5 out of 22 loci tested, which was confirmed by additional PCR. The mean PIC for all 22 SSR markers was 0.6240 with values ranging from 0.3841 for marker Xbarc273 on chromosome 6DL to 0.8074 for the marker Xcfa2086 on chromosome 2AL. A few additional markers like Xgwm11, Xbarc170 and Xwmc808 on chromosomes 1BL, 4A and 3BS, respectively, were also characterized with high PIC. The genetic diversity index (He or GD) ranged from 0.3941 (Xbarc273-6DL) to 0.8168 (Xcfa2086-2AL) with a mean of 0.6580. The average observed heterozygosity (Ho) across all 22 loci was 0.1853 with the highest values of 0.6496 in locus Xgwm619-2BL, and 0.5043 in locus Xbarc330-5AS. The lowest heterozygosity was recorded in locus Xgwm458-1DL (0.0256).
The B-genome had the highest mean number of alleles (8.75) followed by the A genome (8.33), whereas the D genome had the lowest number (6.8). The SSR markers used showed different levels of gene diversity between the wheat genomes. Тhe highest PIC and GD values were observed in the A genome (0.6537 and 0.6910) compared to B (0.6445 and 0.6768) and D (0.5375 and 0.5687) genomes, respectively ().
Comparative analysis of gene diversity among the germplasm pools from different geographical regions in Bulgaria (North and South Bulgaria) and Europe (Western, Central and Eastern Europe) ( and Supplemental material Table S2) revealed the highest mean GD in Western and Central European wheat (0.6240) and the lowest in Eastern European wheat (0.4896). The bread wheat varieties originating from North Bulgaria showed a higher mean number of alleles and GD value (5.91 and 0.5817, respectively) compared to those from South Bulgaria (4.82 and 0.5032). There was difference in the level of GD among the studied SSR loci in both regions in Bulgaria. The highest level of GD in the panel of wheat varieties bred in North Bulgaria was observed in loci Xcfa2086-2AL (0.8106), Xgwm11-1BL (0.7824) and Xbarc170-4A (0.7696). In contrast, the highest GD in the wheat panel from South Bulgaria was found in the loci Xgwm155-3AL (0.7067), Xbarc330-5AS (0.6828) and Xwmc808-1BL (0.6643).
Table 2. Comparison of genetic diversity among wheat populations with different geographical origin.
Population structure
The presence of a genetic structure among the genotypes in the studied collection was inferred using a model-based approach implemented in the STRUCTURE software. The analysis of the results showed two distinct peaks: a higher one at K = 2 and a lower one at K = 3 (). The resulting sub-populations at K = 2 divided the varieties in a pronounced geographical manner. The first sub-population (SP1) included 34 varieties, the majority of which originated from Western and Central Europe: 22 from France, 4 from Austria, 2 from Germany and 1 from the Czech Republic. The remaining five varieties were from the Balkans: 3 Serbian and 2 Bulgarian. The second sub-population (SP2), consisting of 79 genotypes, was composed mainly of varieties originating from Bulgaria. Seventy-five out of the 79 Bulgarian genotypes were grouped in SP2. It also included three Serbian varieties and one Austrian. There were four genotypes that were not assigned to any of the described sub-populations. The admixed group consisted of 1 French, 1 Croatian and 2 Bulgarian varieties.
Figure 1. Genetic structure among the studied 117 wheat genotypes according to model-based analysis. (A) Optimal number of K determined using ΔK [Citation43]; (B) Resulting sub-populations at K = 2 and K = 3.
![Figure 1. Genetic structure among the studied 117 wheat genotypes according to model-based analysis. (A) Optimal number of K determined using ΔK [Citation43]; (B) Resulting sub-populations at K = 2 and K = 3.](/cms/asset/bd477144-c86e-4b05-83a3-dd69da7e6078/tbeq_a_1996274_f0001_c.jpg)
At K = 3 the geographical division of the collection was even more pronounced as the Bulgarian varieties were sub-divided according to the geographic location of the breeding centres where they were selected. The first sub-population (SP1) consisted of 38 varieties, 36 of which developed in the North Bulgarian breeding centres (DAI, G. Toshevo and Pesticid EOOD, Shumen), one in the South Bulgarian breeding centres (IPGR, Sadovo and Seed House, Sadovo) and one Austrian variety (). The second sub-population (SP2) included exclusively Western European varieties. Twenty-eight out of 33 varieties in SP2 were from Western and Central Europe (22 French, 4 Austrian and 2 German) and the remaining 5 included 3 Serbian, 1 from Czech Republic and 1 variety from South Bulgaria. SP3 consisted of 31 Bulgarian varieties (26 from South and 4 from North Bulgaria) and 2 varieties developed in the Republic of Serbia. The group of admixed varieties consisted of 4 accessions from breeding centres located in South Bulgaria, 6 from North Bulgaria, 1 accession from the Republic of Serbia, 1 Croatian and 1 French.
To analyze how the genetic variance was distributed across the hierarchical levels of the grouping derived from the genetic structure analysis we performed an AMOVA, considering the sub-populations described above as populations. The analyses were done by excluding the genotypes that failed to group to any of the main sub-populations inferred by the structure analysis. When considering two main populations (K = 2), 56.3% of the genetic variance was distributed among the varieties within populations, 25.6% within the varieties and 18.1% between populations. When considering three main populations (K = 3), 19.6% of the genetic variance was partitioned among the populations, 52.8% among varieties and 25.5% within varieties. The differentiation among the populations was more pronounced at K = 3. Higher pairwise values of Jost’s index were observed between the SP2 and SP1 (0.41), and between SP2 and SP3 (0.40), than between SP1 and SP3 (0.22).
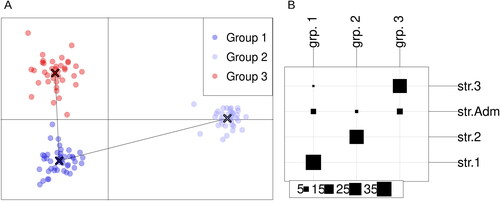
The presence of three distinct sub-populations was also confirmed by the DAPC analysis. The resulting DAPC inferred groups showed a high level of agreement with those formed at K = 3 in the model-based population structure analysis (). The above described sub-populations were completely preserved, with the only exceptions being the dislocation of variety Renesansa (RS) from SP3 to group 1, the latter corresponding to SP1 from the structure analysis, and the classification of the admixed genotypes across the three groups formed in the DAPC analysis. Group 3 and group 1 were located in the centre of quadrants two and three, respectively and group 2 was situated in the right part between quadrants one and four on the DAPC graph (). The most contributing alleles for the first axis were Xgwm261.192 bp, Xgwm261.196 bp and Xcfa2086.271 bp, and for the second axis Xgwm28.203 bp and Xfca2086.244 bp.
Figure 2. Groups inferred by DAPC analysis. (A) Visualization of the resulting groups with a minimum spanning tree; (B) Visualization of the agreement between the groups inferred by DAPC and STRUCTURE analysis. The columns represent the groups inferred by the DAPC analysis and the rows are the groups inferred by the STRUCTURE analysis. The numbers and the size of squares in the legend represent the number of genotypes in each group.
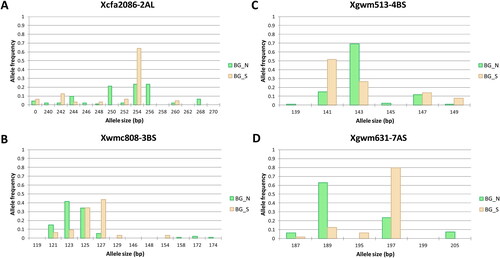
The clear separation of varieties bred in North and South Bulgaria at K = 3 prompted a more detailed analysis of the allele frequencies in the two groups. Analyzing the values of the indices of differentiation (Fst and Jost’s) in the studied loci, we identified four markers with the highest values (). The most contributing alleles for this separation were alleles Xgwm631.189 bp and 197 bp, Xcfa2086.254 bp, Xwmc808.123 bp and 127 bp and Xgwm513.141 bp and 143 bp.
Figure 3. Comparison of allele frequencies between wheat varieties bred in North Bulgaria (BG_N) and South Bulgaria (BG_S) in four SSR loci showing highest contribution to the sub-population differentiation.
Phylogenetic analysis
The phylogenetic tree () delineated the 117 varieties into 2 main clusters in agreement with the observed 2 main sub-populations inferred by the model-based approach at K = 2 in the genetic structure analysis. The first main cluster included mostly Western and Central European varieties with origin from France (22), Austria (4) and Germany (2) as well as a few Eastern European varieties from Serbia (3), South Bulgaria (1) and the Czech Republic (1). The second main cluster incorporated about 2/3 of the analyzed varieties, including all Bulgarian varieties, with the exception of Nikolay (No 24), and 6 foreign ones with origin from Serbia, Croatia, France and Austria (Supplemental material Table S1). This cluster is subdivided into several sub-clusters. The observed subdivision generally conforms to the sub-populations determined by the model-based approach at K = 3. The varieties originating from South Bulgaria were grouped close to each other, whereas those from North Bulgaria are distributed in several sub-clusters, some of which consisting only of genotypes developed in DAI, G. Toshevo. Three varieties from Serbia (Renesansa, Ilina and Simonida) clustered together with the varieties of IPGR, Sadovo, whereas the varieties Midas (Austria) and Andelka (Croatia) are grouped with the DAI varieties.
Figure 4. Phylogenetic tree of the collection of 117 European Triticum aestivum varieties. The tree was built using UPGMA algorithm based on Nei83 DA distance [Citation39] computed from the allele frequencies at 22 SSR loci. The origin of each variety is represented by abbreviations highlighted with different colours: AT – Austria, BG – Bulgaria, CZ – Czech Republic, DE – Germany, FR – France, HR – Croatia, RS – the Republic of Serbia. The abbreviations after the underscore: EE – East Europe, WE –West and Central Europe, N – Northern, S –Southern. The barplots to the right represent the membership to sub-populations inferred by the model-based approach at K = 2 and K = 3. The two main clusters are marked by vertical bars.
![Figure 4. Phylogenetic tree of the collection of 117 European Triticum aestivum varieties. The tree was built using UPGMA algorithm based on Nei83 DA distance [Citation39] computed from the allele frequencies at 22 SSR loci. The origin of each variety is represented by abbreviations highlighted with different colours: AT – Austria, BG – Bulgaria, CZ – Czech Republic, DE – Germany, FR – France, HR – Croatia, RS – the Republic of Serbia. The abbreviations after the underscore: EE – East Europe, WE –West and Central Europe, N – Northern, S –Southern. The barplots to the right represent the membership to sub-populations inferred by the model-based approach at K = 2 and K = 3. The two main clusters are marked by vertical bars.](/cms/asset/d4b91800-2067-47f2-ae96-cbc0a60e3f56/tbeq_a_1996274_f0004_c.jpg)
Phenotypic data
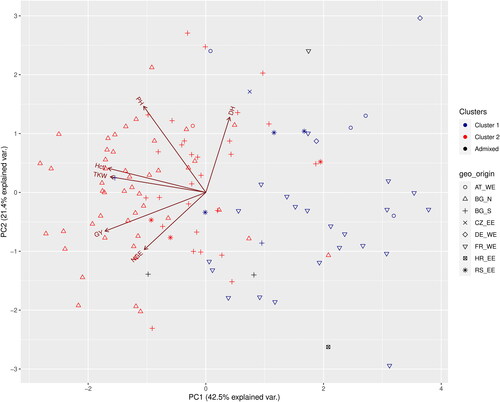
To analyze if there are patterns in the phenotypic performance of the genotypes classified in the two clusters resulting from the model-based method described above, we performed a PCA analysis with six quantitative phenotypic traits. The analysis was done using BLUPS extracted from a linear mixed model, with all independent variables taken as random. All of the used predictors in the model had a highly significant effect upon the studied traits except ‘replication’ (Supplemental material Table S3). The first two axes from the PCA explained 64% of the variance (). Grain yield (GY) and hectolitre weight (Hctl) had the highest contributions to the first axis, and plant height (PH) and days to heading (DH) were the most contributing variables for the second axis. The genotypes from Cluster 1 were situated mainly in quadrants one and four, except for the variety Nikolay (No24), which was located in the lower left part of quadrant two. The genotypes situated in quadrant four had a GY above average (the ones situated closer to the ordinate axis) or below average (those situated to the extreme right of the graph); the most common feature of these varieties was the low values (below average) of PH, TKW and Hclt. The genotypes in quadrant one had GY below the average, lower NGE than the average and higher or close to average DH. The genotypes from Cluster 2 were distributed predominantly in quadrants two and three, but 13 of them were scattered in the remaining two quadrants. Those in quadrants two and three had higher than the average GY, TKW and Hctl. The genotypes in quadrant two also had a higher PH.
Figure 5. PCA biplot of six quantitative traits and the distribution of the genotypes at K = 2. The cluster memberships are coded in colours and the country of origin in shapes. GY – grain yield, DH – days to heading, Hctl – hectolitre weight, NGE – number of grains per ear, PH – plant height, TKW – thousand kernel weight.
Discussion
Genetic diversity is vital for successful crop improvement programmes and food security because it underlies adaptation of crops to environmental changes and ecosystem resilience. However, many studies in bread wheat have claimed that modern breeding has led to narrowing of the genetic diversity in wheat in the last few decades [Citation8, Citation47–49]. Continuous assessment of genetic diversity to identify sources of new genetic variation in the wheat germplasm pool is critical for the development and selection of high-performing varieties that have the capacity to adapt to specific agro-ecosystems and overcome the ever-changing climate conditions [Citation22, Citation50].
In this study, we described genetic and phenotypic diversity and marker-based population structure of modern bread wheat (T. aestivum L.) varieties grown in Bulgaria.
Genetic diversity and SSR marker distribution
This study showed a significant level of genetic variation in the studied panel of 117 winter bread wheat currently grown in Bulgaria. A total of 179 alleles were identified by 22 polymorphic SSR markers with an average of 8.14 alleles per locus. The results are similar to the findings described in other studies. Belete et al. [Citation22] reported higher mean number of alleles (10.06) for 52 bread wheat accessions in a study aimed at identifying parental genotypes appropriate for drought tolerance breeding. A lower number of alleles per locus was reported by Zhang et al. [Citation51] (7.2 alleles/locus) who analyzed 205 elite wheat breeding lines from the major winter wheat breeding programmes in the USA using 245 SSRs and by Chen et al. [Citation52] (5.05 allele/locus) in 90 Chinese winter wheat accessions analyzed at 269 SSR loci. Landjeva et al. [Citation48] also identified a lower number of alleles (6.8 alleles/locus) in a set of 91 Bulgarian winter wheat (T. aestivum L.) varieties released in the twentieth century using 19 SSR markers and one secalin-specific marker for rye chromosome arm 1RS.
Allelic diversity depends on the genetic composition of the population and it is an important tool to discern the genetic attributes associated with specific traits. The polymorphic information content (PIC) across the tested loci observed in our study is a confirmation that the selected SSR markers are highly polymorphic and appropriate for genetic diversity studies. At the genome level, both A and B genomes had higher values than the D genome for both GD and PIC. The lower number of polymorphic markers on the D genome could be explained with the lower frequency of recombination events in the D genome of hexaploid wheat leading to its lower diversity. The latest originated from the A. tauchii, whereas the A and B genomes derived from its tetraploid ancestors which are characterized with larger proportion of genetic diversity [Citation53].
The average GD (0.6580) of the studied wheat panel presented by the national and foreign varieties registered and currently used in Bulgaria is higher than that reported in previous studies for the Bulgarian, Belgian and South-Eastern European wheat [Citation47, Citation48]. However, in the present study it was higher in the Western and Central European varieties than that in the Bulgarian and the rest of the Eastern European ones. This is in contrast to the report by Todorovska et al. [Citation47] on the GD values for the Bulgarian germplasm, consisting mostly of DAI, G. Toshevo varieties and lines, and Belgian germplasm collection (0.5834 vs 0.5273). However, the GD value for DAI germplasm collection (0.5834) reported by Todorovska et al. [Citation47] is nearly identical with the GD value for the Northern Bulgarian wheat sub-population (0.5817) observed in the present study.
Our study showed that the Bulgarian wheat varieties bred in North and South Bulgaria are characterized by different allele number and GD across the studied microsatellite loci. The highest difference in respect to the number of alleles and GD values between both sets of wheat varieties was observed in locus Xcfa2086-2AL. Higher GD values in the Northern Bulgarian wheat were calculated for several other loci like Xgwm11-1B, Xgwm619-7AS, Xbarc170-4AL. On the other hand, different loci like Xgwm680-6BS and Xgwm513-4BS contributed to the higher level of GD in wheat from South Bulgaria (Supplemental material Table S2). This could be explained by the distinct selection pressure provoked by the difference in the agro-ecological zones with distinct climatic patterns requiring different alleles or genes for local adaptation.
Population structure and differentiation of wheat varieties
Many studies have highlighted the importance of investigating the genetic structure of a population for effective exploitation of genetic diversity and broadening the genetic basis of modern varieties by selection of genotypes with desirable traits in further breeding programmes [Citation22, Citation54]. Analysis of the STRUCTURE software output by the approach described by Evanno et al. [Citation43] suggested that the most probable number of sub-populations in the studied collection of modern wheat cultivars is two. The distribution of the varieties across the resulting sub-populations showed a pronounced geographic pattern, separating those from Central and Western Europe from the majority of the Bulgarian and some of the varieties from Serbia. The analysis of the sub-populations at K = 3, prompted by the second peak on the Evanno graph, revealed a subdivision of the varieties originating from North and South Bulgaria into two distinct groups. A potential genetic structure consisting of three sub-populations was further supported by DAPC and the AMOVA results, the latter showing a higher between-subpopulation variance at K = 3. Geographical patterns in the genetic structure of wheat were reported by other authors [Citation4, Citation55] studying panels of European wheat varieties. Le Couviour et al. [Citation55] also observed a finer geographical separation with increasing the value of K from 2 up to 4. Our results are also in accordance with results of Tehseen et al. [Citation56] reporting a better geographical clustering in the DAPC analysis. It should be noted that in contrast to our results, Aleksandrov et al. [Citation57], studying a panel of 179 Bulgarian bread wheat (Bulwheat population) consisting of 128 modern semi-dwarf cultivars and 51 old germplasm with tall stature using SNP markers, inferred a genetic structure influenced mainly by the temporal factor and only to a limited extend by a geographical pattern.
The applied distance-based cluster approach () is in correspondence with the sub-populations of the studied panel of wheat with different geographical origins defined by the model-based approach at K = 2 and K = 3. The observed sub-clustering within the 2 main clusters reveals the effectiveness of the microsatellite markers in the assessment of genetic differentiation. It also clearly reflects the difference in the strategies for wheat improvement adopted in both breeding centres and seed houses located in the 2 eco-geographical regions (North and South Bulgaria) characterizing with continental, transitive-continental and Mediterranean climatic conditions determined by the positioning of Bulgaria at the meeting point of the Continental, Oceanic and Mediterranean air masses combined with the barrier effect of the Balkan mountain range.
The primary determinant for the group separation observed in our study could be the regional adaptation as reported in several studies on different wheat classes and traits [Citation58, Citation59] as well as the use of different genetic sources and breeding selection methods directed towards improvement of specific traits determined by the particular environmental conditions and market requirements. Many studies [Citation4, Citation47, Citation52, Citation60] have shown that some chromosome regions can contribute to population subgroup separation. Among the loci encoding for important agronomic traits, those responsible for plant height (Rht), day-length insensitivity (Ppd1) and flowering time (Vrn) have a major impact on the genetic separation of global wheat population [Citation4]. Our study showed that the observed allele variation at locus Xgwm 261(2DS), which is closely located to the dwarfing gene Rht8, contributed to the genetic separation of the studied wheat population. The allele of 192 bp contributing to the reduced plant height prevails in the South-Eastern European wheat [Citation4, Citation47]. In our study this allele was found mostly in Bulgarian and Serbian varieties belonging to Cluster 1 and 3 in the structure analysis at K = 3. In contrast, almost all foreign wheat varieties with origin from Western and Central Europe belonging to Cluster 2 carried the allele of 174 bp.
The climatic barrier formed by the Balkan mountain range determines different agro-climatic zones in northern and southern Bulgaria. As a result, the breeding of wheat in North Bulgaria is directed towards development of more cold tolerant varieties, whereas in South Bulgaria it is mostly targeted at the development of drought tolerant ones. The grouping of varieties of IPGR, Sadovo in close proximity within a distinct sub-cluster of the second main cluster provides evidence for narrowing the genetic basis of the modern Southern Bulgarian varieties as it has been reported by Aleksandrov et al. [Citation57]. Several drought tolerant varieties like Gines (No16), Katya (No4) and Gizda (No27) of IRGR-Sadovo were grouped next to each other forming a branch within one of the sub-clusters, which is a confirmation of the results from the physiological analysis on the drought tolerance at the early stage performed by Vassileva et al. [Citation61]. The observed grouping of the varieties of DAI, G. Toshevo in several sub-clusters that surrounded the sub-cluster formed mainly of varieties developed in IPGR, Sadovo reflects the higher diversity pattern in this sub-population as a result of the use of more diverse genetic sources for crop improvement in the last 30 years with origin from Romania, Russia, Ukraine, CIMMYT and ICARDA.
Such grouping is in correspondence with the breeding programmes in the two agro-ecological regions in Bulgaria and is determined by the predominance of specific alleles in some loci related to abiotic stress conditions (cold, drought) and productivity. Our study revealed that several microsatellite loci significantly contributed to this separation like Xgwm631-7AS, located near to QTL for PH [Citation62] and grain yield [Citation63], Xcfa2086-2AL located near to the QTLs for some agronomic traits (days to heading, ear peduncle length, grain yield) expressed under different environmental conditions in hexaploid and durum wheat [Citation64, Citation65], for TKW like Xgwm513-4BS [Citation66] as well as QTL for biofortification in wheat [Citation67] and to the meta QTL region associated with root architecture of bread wheat [Citation68] on group 3 chromosomes and to QTL for protein content and glutamine synthetase activity [Citation69].
Phenotypic diversity
In addition to the molecular markers, we used six quantitative phenotypic traits to analyze the genetic diversity in the studied wheat collection. According to the results of the fitted mixed model there was a substantial genetic variability in terms of the studied traits demonstrated by values of the genotypic component of variance. The clustering analysis separated the two sub-populations inferred by the model-based approach relatively well along the first composite axis according to the grain yield and its components. These results present the main trends in the realization of the genetic potential of the varieties from the working collection. The established differences are a result primarily of the selection pressure in the breeding process. It is determined by the priorities of the respective programmes and by the limiting factors of the targeted ecological and geographic regions. The varieties from Austria and Germany were with the longest time to heading, followed by the ones from Croatia and France. The variation of the latter group was within a wide range. The variety Avenue headed earliest, and Sorrial, Toskani, Solveig and Renan, latest. Considerable variability according to this trait was found between the accessions from Bulgaria and Serbia. The field observations showed they had similar phenological development. Among the new Bulgarian bread wheat varieties included in the study, Kalina was with the earliest date to heading, whereas Dragana was with the latest.
A considerable variation in the plant height among the groups of varieties with different geographical origin was observed. The variety from Croatia was with the shortest stem. Even its maximum value was much below the mean height of the rest of the groups. A low value of this trait was also observed for the varieties from France. The varieties from Austria were with the highest plant height. The variation in this trait was more strongly pronounced in the group of the Bulgarian varieties. The plant height of the majority of them was within a wide range (82 − 109 cm). Some varieties, such as Medeya, Geya 1, Kalina and Yoana, were with the shortest stem, whereas Sadovo 552 was with the tallest one.
Significant variation was also observed in the structural components of yield; it was the highest with regard to the number of grains per ear. The Bulgarian varieties had the highest predicted values for the number of grains per ear and for absolute weight (TKW), which compensated for their lower number of productive tillers. There was a similar trend in the group of the Serbian varieties. The varieties from Germany had a balanced combination of these traits, and to a lesser degree, the ones of Austria, which were characterized by lower absolute grain weight.
When comparing the range of variation in productivity, we found that in each group there were varieties with very high genetic potential realized under the conditions of Dobrudzha region. The lowest mean yield was observed in some Eastern (Croatia) and Western European (Austria) varieties. This was not incidental since the predominant part of them were from the group of wheats with good quality and a comparison is inappropriate. The variation in the varieties from Germany was due to a similar reason. The group of French varieties was presented by the highest number of medium wheat types and medium wheat types with increased dough strength. During the three crop seasons of evaluation in the Dobrudzha region (North Bulgaria), the Bulgarian wheat varieties that produced the highest yields were Pryaspa, Koprinka, Neda, Kiara and Dragana, whereas among the foreign varieties, Basmati and Santorin.
Conclusions
The present study revealed the extent of genetic diversity and the presence of genetic structures using SSR markers in a panel of 117 modern winter wheat varieties with origin from Western, Central and Eastern European countries which are currently used in both breeding programmes and grain production in Bulgaria. The genetic diversity (GD) was higher in Western and Central European wheat varieties in comparison to Bulgarian and Eastern European ones. Within the Bulgarian population, GD was slightly higher for the wheat sub-population from North Bulgaria in comparison to that of South Bulgaria. Both, the distance-based cluster analysis and the model-based structure analysis revealed an eco-geographical pattern of distribution of the studied modern winter varieties. The clustering of the studied varieties in the biplot analysis according to the phenotypic traits reflects the differences in adaptation to the agro-climatic conditions of North Bulgaria determined by the observed eco-geographical pattern of origin. The study provides information for selection of appropriate parents for further breeding purposes and is a basis for association mapping for important agronomic traits expressed under different environmental conditions.
Author contributions
Elena G. Todorovska (E.G.T.) conceptualized and designed the experiment, performed molecular experiments, analyzed data, prepared tables, prepared the original draft, and reviewed drafts, approved the final draft. Stefan Tsonev (S.T.) performed molecular experiments, analyzed data, prepared figures, prepared and reviewed drafts and approved the final draft. Nikolai Christov (N.C.) analyzed data, prepared tables and figures, prepared and reviewed drafts of the paper and approved the final draft. Gallina Mihova (G.M.) performed field experiments and phenotypic evaluation, described and contributed the plant material, reviewed drafts of paper and approved the final draft. Ana Dimitrova (A.D.) acquired funding, reviewed drafts of the paper and approved the final draft.
Disclosure statement
No potential conflict of interest was reported by the authors.
Data availability statement
All data that support the findings reported in this study are available from the corresponding author upon reasonable request.
Additional information
Funding
Related Research Data
References
- FAOSTAT-Crops and livestock products [Internet]. [cited 2021 Sep 23]. Available from: http://www.fao.org/faostat/en/#data/QCL
- Giraldo P, Benavente E, Manzano-Agugliaro F, et al. Worldwide research trends on wheat and barley: a bibliometric comparative analysis. Agronomy. 2019;9(7):352.
- Shewry PR, Hey SJ. The contribution of wheat to human diet and health. Food Energy Secur. 2015;4(3):178–202.
- Nielsen NH, Backes G, Stougaard J, et al. Genetic diversity and population structure analysis of European hexaploid bread wheat (Triticum aestivum L.) varieties. PLoS One. 2014;9(4):e94000.
- World population prospects – population division – United Nations [Internet]. [cited 2021 Sep 23]. Available from: https://population.un.org/wpp/
- Khan MK, Pandey A, Thomas G, et al. Genetic diversity and population structure of wheat in India and Turkey. AoB Plants [Internet]. [cited 2015 Aug 25]. Available from:
- Heal G, Walker B, Levin S, et al. Genetic diversity and interdependent crop choices in agriculture. Resour Energy Econ. 2004;26(2):175–184.
- Fu Y-B, Somers DJ. Genome-wide reduction of genetic diversity in wheat breeding. Crop Sci. 2009;49(1):161–168.
- Gupta PK, Varshney RK, Sharma PC, et al. Molecular markers and their applications in wheat breeding. Plant Breed. 1999;118(5):369–390.
- Gupta PK, Varshney RK. The development and use of microsatellite markers for genetic analysis and plant breeding with emphasis on bread wheat. Euphytica. 2000;113(3):163–185. doi:10.1023/A:1003910819967.
- Cui F, Zhang N, Fan X, et al. Utilization of a Wheat660K SNP array-derived high-density genetic map for high-resolution mapping of a major QTL for kernel number. Sci Rep. 2017;7(1):3788.
- Yang X, Tan B, Liu H, et al. Genetic diversity and population structure of Asian and European common wheat accessions based on genotyping-by-sequencing. Front Genet. 2020;11:580782.
- Tomar V, Dhillon GS, Singh D, et al. Elucidating SNP-based genetic diversity and population structure of advanced breeding lines of bread wheat (Triticum aestivum L.). PeerJ. 2021;9:e11593.
- Deng P, Wang M, Feng K, et al. Genome-wide characterization of microsatellites in triticeae species: abundance, distribution and evolution. Sci Rep. 2016;6:32224.
- Xu J, Liu L, Xu Y, et al. Development and characterization of simple sequence repeat markers providing genome-wide coverage and high resolution in maize. DNA Res. 2013;20(5):497–509.
- Blake VC, Woodhouse MR, Lazo GR, et al. GrainGenes: centralized small grain resources and digital platform for geneticists and breeders. Database. 2019;2019:baz065.
- Chao S, Zhang W, Akhunov E, et al. Analysis of gene-derived SNP marker polymorphism in US wheat (Triticum aestivum L.) cultivars. Mol Breeding. 2009;23(1):23–33.
- Peleg Z, Fahima T, Krugman T, et al . Genomic dissection of drought resistance in durum wheat x wild emmer wheat recombinant inbreed line population. Plant Cell Environ. 2009;32(7):758–779.
- Pinto RS, Reynolds MP, Mathews KL, et al. Heat and drought adaptive QTL in a wheat population designed to minimize confounding agronomic effects. Theor Appl Genet. 2010;121(6):1001–1021.
- Mondal S, Mason RE, Huggins T, et al. QTL on wheat (Triticum aestivum L.) chromosomes 1B, 3D and 5A are associated with constitutive production of leaf cuticular wax and may contribute to lower leaf temperatures under heat stress. Euphytica. 2015;201(1):123–130.
- Gupta PK, Balyan HS, Gahlaut V. QTL analysis for drought tolerance in wheat: Present status and future possibilities. Agronomy. 2017;7(1):5.
- Belete Y, Shimelis H, Laing M, et al. Genetic diversity and population structure of bread wheat genotypes determined via phenotypic and SSR marker analyses under drought-stress conditions. J. Crop Improv. 2021;35(3):303–325.
- Wiśniewska H, Surma M, Krystkowiak K, et al. Simultaneous selection for yield-related traits and susceptibility to Fusarium head blight in spring wheat RIL population. Breed Sci. 2016;66(2):281–292.
- Zhu Z, Bonnett D, Ellis M, et al. Characterization of Fusarium head blight resistance in a CIMMYT synthetic-derived bread wheat line. Euphytica. 2016;208(2):367–375.
- Zhang Z, Friesen TL, Simons KJ, et al. Development, identification, and validation of markers for marker-assisted selection against the Stagonospora nodorum toxin sensitivity genes Tsn1 and Snn2 in wheat. Mol Breeding. 2009;23(1):35–49.
- Kumar S, Röder MS, Tripathi SB, et al. Mendelization and fine mapping of a bread wheat spot blotch disease resistance QTL. Mol Breeding. 2015;35(11):218.
- Singh V, Singh G, Chaudhury A, et al. Phenotyping at hot spots and tagging of QTLs conferring spot blotch resistance in bread wheat. Mol Biol Rep. 2016;43(11):1293–1303.
- See PT, Moffat CS. Evaluation of a novel molecular marker associated with the tan spot disease response in wheat. Agriculture. 2021;11(6):513.
- Goutam U, Kukreja S, Yadav R, et al. Recent trends and perspectives of molecular markers against fungal diseases in wheat. Front Microbiol. 2015;6:861.
- Zhu X-G, Long SP, Ort DR. What is the maximum efficiency with which photosynthesis can convert solar energy into biomass? Curr Opin Biotechnol. 2008;19(2):153–159.
- Zhang Q, Maroof MAS, Kleinhofs A. Comparative diversity analysis of rflps and isozymes within and among populations of Hordeum vulgare ssp. spontaneum. Genetics. 1993;134(3):909–916.
- Bhandari H, Bhanu A, Srivastava K, et al. Assessment of genetic diversity in crop plants – an overview. Adv Plants Agric Res. 2017;7:279–286.
- Röder MS, Korzun V, Wendehake K, et al. A microsatellite map of wheat. Genetics. 1998;149(4):2007–2023.
- Gupta K, Balyan S, Edwards J, et al. Genetic mapping of 66 new microsatellite (SSR) loci in bread wheat. Theor Appl Genet. 2002;105(2-3):413–422.
- Song QJ, Shi JR, Singh S, et al. Development and mapping of microsatellite (SSR) markers in wheat. Theor Appl Genet. 2005;110(3):550–560.
- Sourdille P, Guyomarc’h H, Baron C, et al. Improvement of the genetic maps of wheat using new microsatellite markers plant & animal genome IX. Final Abstracts Guide. 2001;167
- Hayden M, Nguyen TM, Waterman A, et al. Multiplex-ready PCR: a new method for multiplexed SSR and SNP genotyping. BMC Genomics. 2008;9:80.
- Liu K, Muse SV. PowerMarker: an integrated analysis environment for genetic marker analysis. Bioinformatics. 2005;21(9):2128–2129.
- Nei M, Tajima F, Tateno Y. Accuracy of estimated phylogenetic trees from molecular data. II. Gene frequency data. J Mol Evol. 1983;19(2):153–170.
- Subramanian B, Gao S, Lercher MJ, et al. Evolview v3: a webserver for visualization, annotation, and management of phylogenetic trees. Nucleic Acids Res. 2019;47(W1):W270–W275.
- Pritchard JK, Stephens M, Donnelly P. Inference of population structure using multilocus genotype data. Genetics. 2000;155(2):945–959.
- Jombart T, Devillard S, Balloux F. Discriminant analysis of principal components: a new method for the analysis of genetically structured populations. BMC Genet. 2010;11:94.
- Evanno G, Regnaut S, Goudet J. Detecting the number of clusters of individuals using the software structure: a simulation study. Mol Ecol. 2005;14(8):2611–2620.
- Earl DA, vonHoldt BM. STRUCTURE HARVESTER: a website and program for visualizing STRUCTURE output and implementing the Evanno method. Conserv Genet Resour. 2012;4(2):359–361.
- Jost L . G(ST) and its relatives do not measure differentiation. Mol Ecol. 2008;17(18):4015–4026.
- Almeida GD, Makumbi D, Magorokosho C, et al. QTL mapping in three tropical maize populations reveals a set of constitutive and adaptive genomic regions for drought tolerance. Theor Appl Genet. 2013;126(3):583–600.
- Todorovska E, Zheleva D, Kolev S, et al. Microsatellite variation in genomic regions responsible for agro-ecological adaptation of wheat. Biotechnol Biotechnol Equip. 2009;23(sup1):960–964.
- Landjeva S, Korzun V, Ganeva G. Evaluation of genetic diversity among Bulgarian winter wheat (Triticum aestivum L.) varieties during the period 1925–2003 using microsatellites. Genet Resour Crop Evol. 2006;53(8):1605–1614.
- Roussel V, Koenig J, Beckert M, et al. Molecular diversity in French bread wheat accessions related to temporal trends and breeding programmes. Theor Appl Genet. 2004;108(5):920–930.
- Arora A, Kundu S, Dilbaghi N, et al. Population structure and genetic diversity among Indian wheat varieties using microsatellite (SSR) markers. AJCS. 2014;8:1281–1289.
- Zhang D, Bai G, Zhu C, et al. Genetic diversity, population structure, and linkage disequilibrium in U.S. elite winter wheat. Plant Genome 2010 [Internet]. [cited 2021 Sep 23]. Available from: https://doi.org/10.3835/plantgenome2010.03.0004
- Chen X, Min D, Yasir TA, et al. Genetic diversity, population structure and linkage disequilibrium in elite Chinese winter wheat investigated with SSR markers. PLoS One. 2012;7(9):e44510.
- Dubcovsky J, Dvorak J. Genome plasticity a key factor in the success of polyploid wheat under domestication. Science. 2007;316(5833):1862–1866.
- Zhang X, Liu D, Yang W, et al. Development of a new marker system for identifying the complex members of the low-molecular-weight glutenin subunit gene family in bread wheat (Triticum aestivum L.). Theor Appl Genet. 2011;122(8):1503–1516.
- Le Couviour F, Faure S, Poupard B, et al. Analysis of genetic structure in a panel of elite wheat varieties and relevance for association mapping. Theor Appl Genet. 2011;123(5):715–727.
- Tehseen MM, Istipliler D, Kehel Z, et al. Genetic diversity and population structure analysis of Triticum aestivum L. landrace panel from Afghanistan. Genes (Basel). 2021;12(3):340.
- Aleksandrov V, Kartseva T, Alqudah AM, et al. Genetic diversity, linkage disequilibrium and population structure of Bulgarian bread wheat assessed by genome-wide distributed SNP markers: from old germplasm to semi-dwarf cultivars. Plants. 2021;10(6):1116.
- Maccaferri M, Sanguineti MC, Noli E, et al. Population structure and long-range linkage disequilibrium in a durum wheat elite collection. Mol Breeding. 2005;15(3):271–290.
- White J, Law JR, MacKay I, et al. The genetic diversity of UK, US and Australian cultivars of Triticum aestivum measured by DArT markers and considered by genome. Theor Appl Genet. 2008;116(3):439–453.
- Hao C, Wang L, Ge H, et al. Genetic diversity and linkage disequilibrium in Chinese bread wheat (Triticum aestivum L.) revealed by SSR markers. PLoS One. 2011;6(2):e17279.
- Vassileva V, Vaseva I, Dimitrova A. Expression profiling of DNA methyltransferase genes in wheat genotypes with contrasting drought tolerance. Bulg J Agric Sci. 2019;25:845–851.
- Genc Y, Oldach K, Gogel B, et al. Quantitative trait loci for agronomic and physiological traits for a bread wheat population grown in environments with a range of salinity levels. Mol Breeding. 2013;32(1):39–59.
- Mladenov V, Dimitrijević M, Petrović S, et al. Agronomic performance of wheat cultivars and their molecular characterization. Genetika. 2018;50(2):591–602.
- Paillard S, Schnurbusch T, Tiwari R, et al. QTL analysis of resistance to Fusarium head blight in Swiss winter wheat (Triticum aestivum L.). Theor Appl Genet. 2004;109(2):323–332.
- Maccaferri M, Sanguineti MC, Demontis A, et al. Association mapping in durum wheat grown across a broad range of water regimes. J Exp Bot. 2011;62(2):409–438.
- Peleg Z, Fahima T, Korol AB, et al. Genetic analysis of wheat domestication and evolution under domestication. J Exp Bot. 2011;62(14):5051–5061.
- Krishnappa G, Singh AM, Chaudhary S, et al. Molecular mapping of the grain iron and zinc concentration, protein content and thousand kernel weight in wheat (Triticum aestivum L.). PLoS One. 2017;12(4):e0174972.
- Darzi-Ramandi H, Shariati V, Tavakol E, et al. Detection of consensus genomic regions associated with root architecture of bread wheat on groups 2 and 3 chromosomes using QTL meta–analysis. AJCS. 2017;11.
- Li HM, Liang H, Li Z, et al. Dynamic QTL analysis of protein content and glutamine synthetase activity in recombinant inbred wheat lines. Genet Mol Res. 2015;14(3):8706–8715. doi:10.4238/2015.July.31.19.