
ABSTRACT
Glutathione S-transferases (GSTs) are a class of enzymes with detoxification function. GSTs can be used for the degradation of toxic aromatic compounds, such as dyes. In order to promote their application and cost-effective dye degradation and to understand their structure and function more deeply, we cloned and expressed a gst2 gene from Trametes gibbosa—a white rot fungus. T.gibbosa gst2 has a 672-bp open reading frame (ORF) and encodes 223 amino acids. The recombinant Tg-gst2 in Escherichia coli has a molecular weight of 25.59 k. Real-time polymerase chain reaction and high throughput sequencing technique were used to verify Tg-gst2 gene response to congo red dye. GST activity enhanced with congo red treatment. The tertiary structure of Tg-GST2 was predicted using homology modeling, and we found that it belongs to Ure2pA family of GST, which is a specific family of fungi. Active sites contained catalytic tri-linked groups, such as Gly15-Pro16-Asn17. Oxidized glutathione binding residues are Gln 44, Arg 57, Ile 58, Glu 73, Ser 74, Ser 111, Arg 137 and Trp 174. Molecular docking predicted that the binding effect of Tg-GST2 with oxidized glutathione and congo red was strong. This study has great significance in the research and application GST of Ure2pA family in dye decolorization and detoxification.
Supplemental data for this article is available online at https://doi.org/10.1080/13102818.2021.1997157 .
Introduction
Trametes gibbosa is a common large wood-rot fungus in Northeast China that grows on a variety of broad-leaved dead or living trees. It is with a fast growth rate and strong degradation effect on wood. T. gibbosa not only degrades wood, but also degrades various dyes. White-rot fungi, are able to degrade all wood and dye components. The degradation effect of fungi has been linked to their ability to secrete extracellular enzymes that are able to degrade wood polymers and dyes [Citation1], such as laccases and manganese peroxidases [Citation2]. Also a large number of studies have focused on intracellular chrome P450 monooxygenases, which are involved in the oxidation of potentially toxic molecules (phase I of the detoxification pathways) [Citation3]. In the detoxification process, the resulting oxidized compounds are conjugated to hydrophilic molecules, such as glutathione. This conjugation step is catalyzed by cytosolic transferases. Based on our previous research on the transcriptome sequencing data of T.gibbosa treated by congo red, we screened out a glutathione metabolic pathway (ko00480) that is related to the detoxification process.
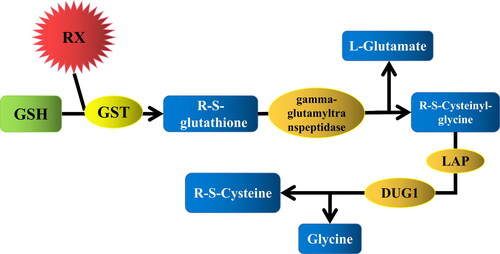
The glutathione metabolic pathway is an important metabolic detoxification process in organisms (). As shown in , glutathione S-transferase (GST, EC: 2.5.1.18) is the focus substance in this pathway. GST involvement is the first step in the metabolic pathway of toxic substances. Through GST catalysis, the sulfhydryl group of reduced glutathione binds to the electrophilic or lipophilic groups of exogenous toxic and harmful substances to form water-soluble complexes. These water-soluble complexes are located outside the cell for detoxification [Citation4]. The complexes are further decomposed by the gamma-glutamyl transpeptidase, LAP and DUG1.
Figure 1. The catabolism pathway of toxic substances participated by glutathione. RX: poison material.
Therefore, GSTs may be one class of the key enzymes involved in dye degradation and detoxification. Furthermore, the number of genes encoding cytosolic transferases is also largely higher in the genomes of wood-decaying fungi than in other fungi [Citation5], which has brought new ideas to the degradation of dyes and detoxification by white rot fungi.
GSTs belong to a family that is ubiquitous in different organisms and has different biological functions [Citation6]. According to some studies, GSTs could induce stress response and regulate the synthesis of secondary metabolites in plants [Citation7,Citation8]. GSTs are associated with the phase II cellular detoxification system, and they participate in the elimination of potentially harmful compounds, such as xenobiotic compounds, drugs, environmental pollutants, pesticides, herbicides and chemical carcinogens [Citation9–12]. GSTs are classified into four major groups: cytosolic GSTs, kappa GSTs (mitochondria), MAPEG (microsomes) and bacterial fosfomycin resistant proteins. Among them, the abundant cytosolic GSTs are further classified into several subclasses: mu, alpha, beta, delta, pi, theta, epsilon, sigma, zeta, phi, tau, omega, nu, lambda, iota, rho, and chi [Citation9,Citation13–15]. The GSTs family in fungi mainly comprise the phylogenetic classes, such as EF1Bγ, PHI, GSTFuA, Ure2p, GHR, SIGMA, GTE, MAK16, GST Omega and GTT2 [Citation16–18]. The extension of this GSTs superfamily in wood-decaying fungi is mainly linked to the presence of specific class called Ure2p [Citation5,Citation9]. GSTs belonging to this class usually exhibit classical glutathione transferase activity (that is, transfer of glutathione to electrophilic molecules) and the ability to interact with a variety of non-enzymatical molecules (ligandin properties) [Citation9,Citation19]. Some GSTs of Ure2p lack glutathione transferase activity, but show glutathione-dependent peroxidase (GPx) activity, which is an adjunct activity of glutathione transferase and they play a role in intracellular detoxification metabolism [Citation20].
The studies of secondary and tertiary structures of proteins provide valuable insight into the molecular mechanisms of their functions. Understanding the structure of proteins could provide a basis for site-directed mutations or alterations in their structures. For example, Kalita et al. altered the conserved sites of a glutathione S-transferase to increase its xenobiotic-metabolizing activity [Citation21]. The structure and function of unknown proteins have been inferred from the existing structure of the same or similar family proteins. Alternative homology-based modeling of proteins is an efficient tool that could be used to predict the structure and function of unknown proteins.
At present, the GSTs in fungi have not been widely studied as in plants and animals. Fungi have their own family of GSTs. Fungal GSTs applications are mostly related to the degradation of wood and lignin [Citation22,Citation23]. However, the application of fungal GSTs in dye degradation and detoxification has rarely been studied, in order to understand their detoxification effect in dye degradation, it is necessary to understand the molecular structure and function of GSTs.
In this paper, we reported the cloning and sequencing of a glutathione S-transferase gene from T. gibbosa for the first time, as well as its expression in E. coil BL21 at different stages under congo red treatment. Furthermore, we predicted the 3-D structure of the glutathione S-transferase by using homology modeling based on the crystal structure of Ure2pA4 GST from Phanerochaete chrysosporium to gain deeper insight into the overall structure, the active site residues and the catalytic domain.
Materials and methods
Strains and vectors
White-rot fungus T. gibbosa CB1 was collected from the Changbai Mountain and separated by Professor Chi Yujie. The sampling site was located in Changbai Mountain Nature Reserve, Northeast China (127。42′ 55″-128°16′ 48″ E,41°41′ 49″-42° 51′ 18″N), with an average elevation of 802 m. The culture was stored on Potato Dextrose Agar medium and kept at 4 °C at the Forest Protection Department, School of Forestry, Northeast Forestry University. Escherichia coli clone strain DH5α, expression strain BL21 DE3, and pMD18-T vector were purchased from TaKaRa Company (Beijing, China).The expression vector pET-32a(+) was preserved in the laboratory.
Materials and chemicals
The RNA extraction kit was purchased from Beijing Tiangen Biochemistry Technology Co., Ltd. (Beijing, China). PrimeScriptTM II 1st Strand cDNA Synthesis Kit, PrimeScript™ RT reagent Kit with gDNA Eraser (Perfect Real Time), and restriction enzyme EcoR I and Hind III were purchased from TaKaRa Company (Beijing, China). Plasmid extraction and DNA gel extraction kits were purchased from OMEGA Company.
Extraction of hyphae RNA and cDNA synthesis
T. gibbosa hyphae were cultured in liquid Low Nitrogen Asparagine Succinate (LNAS) medium for 10 days, and then, the hyphae were picked up. The hyphae were washed with sterile water, dried and processed into the powdered form using liquid nitrogen. Total RNA of T. gibbosa was extracted by using RNA extraction kit. The Purity (260/280 nm and 260/230 nm) and concentration of RNA were detected by a UV spectrophotometer, and subsequently, cDNA was synthesised using the primeScript™ 1st strand cDNA synthesis kit. The reaction products were stored at −20 °C.
Clonging of T. gibbosa gst2 coding sequence (CDS)
An important detoxification pathway associated with congo red degradation is the glutathione metabolic pathway (ko00480), and genes associated with this pathway were selected from the transcriptome data of T. gibbosa at 0, 3, 7, 10 and 14 h of congo red treatment (the raw reads of RNA sequencing were deposited in GenBank with the accession number SRR11617831-SRR11617845). A gst gene (gene_3381) named T. gibbosa gst2 (hereinafter referred to as Tg-gst2) was found to be associated with the ko00480 pathway. The primers Tg-gst2-F, Tg-gst2-R, Tg-gst2-p-F and Tg-gst2-p-R were designed () according to the transcriptome sequence. PCR amplification was performed using cDNA with promoter as the template. A 20 μL reaction system was set up, comprising 7 μL of ddH2O, 10 μL of 2×Taq PCR StarMix with loading Dye (GenStar), 1 μL of primer pair Tg-gst2-F and Tg-gst2-R or Tg-gst2-p-F and Tg-gst2-p-R (10 μmol/L) and 1 μL of cDNA template. The PCR program was designed as follows: 5 min at 94 °C; 30 cycles of 94 °C for 30 s, 70 or 59 °C for 30 s, 72 °C for 40 s; and a final extension at 72 °C for 10 min. Agarose gel electrophoresis (1%) was performed, and a single band was obtained. PCR products were sent to the company for sequencing (Sangong Biotech Technology Co., Ltd., Shanghai, China). The cDNA and promoter sequences were compared with the transcriptome sequences using bioinformatics analysis.
Table 1. Primers for PCR amplification in this study.
Bioinformatics analysis of Tg-gst2 and Tg-GST2
A phylogenetic tree was built using the MEGAX program and GST sequences including the conserved motif identified through MEME online tools using the ProtParam tool software from ExPASy (http://www.expasy.ch/cgi-bin/protparam) to analyze amino acid sequences in ORF. The molecular weight, amino acid composition, theoretical pI and hydrophilicity of the GSTs were forecasted on the ProtParam software website (http://web.expasy.org/protparam/). Furthermore, the analysis of the affinity/hydrophobicity of amino acids were also performed using the ProtScale software (http://web.expasy.org/protscale/). The transmembrane regions of proteins were determined using online tools TMHMM (http://www.cbs.dtu.dk/services/TMHMM/) and analysis of protein signal peptides were performed using SignalP version 4.1 server (http://www.cbs.dtu.dk/services/SignalP-4.1/). N and O-glycosylation sites were predicted using NetNGlyc1.0 (http://www.cbs.dtu.dk/services/NetNGlyc/) and NetOGlyc3.1 (http://www.cbs.dtu.dk/services/NetOGlyc/), respectively. NetPhos version 3.1 server was used to predict the phosphorylation sites of proteins using the online software (http://www.cbs.dtu.dk/services/NetPhos/) and the sub-cellular localization of the Tg-GST2 protein was determined by using the online software PSORT II.
The two-dimensional structure of the protein was predicted by the multivariate linear regression combined prediction method (https://www.predictprotein.org/), while the 3-D structure was constructed by homology modeling using the Swiss model server (http://www.expasy.ch/swissmod/SWISS-MODEL.html) in the automated mode.
The promoter was analyzed using PlantCARE (http://bioinformatics.psb.ugent.be/webtools/plantcare/html/).
Molecular docking
The Tg-GST2 amino acid sequence in FASTA format was submitted to the SWISS-MODEL server for protein structure modeling. The 2-D structure of oxidized glutathione disulfide (GSSG) was retrieved and downloaded from the PUBCHEM database, and the structure was optimized using PyRx, and AutoDock Tool software was used to generate the Tg-GST2-GSSG binding model. AutoDock version 1.5.6 visualization software was used to set GridBox parameters and perform molecular docking for congo red and Tg-GST2-GSSG. Finally, PyMOL software was used to visualize the docking results. It was performed individually to duck the GSSH with the Tg-GST2 and congo red with the Tg-GST2.
The prokaryotic expression of Tg-gst2
Construction of recombinant plasmid pMD18-T-Tg-gst2
Primers YH-Tg-gst2-F and YH-Tg-gst2-R were designed according to the Tg-gst2 CDS sequence obtained in the previous stage (). On the basis of the In-Fusion cloning principle, the EcoR I site and its upstream 15 bp, the HindIII site and the downstream 15 bp were introduced into the F and R primers according to the pET-32a(+) plasmid sequence. Using cDNA as template, PCR amplification was carried out. The PCR program was as follows: 5 min at 94 °C; 35 cycles at 94 °C for 30 s, 70 °C for 30 s, 72 °C for 40 s; final extension at 72 °C for 10 min. PCR amplified products were detected by electrophoresis and recovered by DNA gel recovery kit. The recovered product was linked to the pMD18-T vector to transform E. coli DH5α competent cells. The blue-white spots screening was carried out, and the white spot single colony was selected to expand the culture. PCR was performed using YH-Tg-gst2-F and YH-Tg-gst2-R primers. Sequencing analysis was also performed, and the PCR products of the bacterium were subjected to gel electrophoresis.
Construction of prokaryotic expression vector of Tg-GST 2gene
pET-32a(+) plasmids were digested with restriction endonuclease EcoR I and Hind III. A 40 μL double enzyme digestion system, comprising 5 μL of 10× Quick Cut Buffer, 1 μL of plasmid DNA, 1 μL each of EcoR I and Hind III, and 32 μL of ddH2O, was set up, and the reaction conditions were enzyme digestion at 37 °C for 3 h. Enzymatic digestion products were recovered by electrophoresis. Using In-Fusion cloning (Hanheng Biotechnology Co., Ltd.), the pET-32a(+) enzyme degumming product was connected with the PCR gum recovery product of pMD18-T-Tg-gst2 in bacterial solution. The connection system comprised 10 μL of HB-infusion master mix(2×), 2 μL of enzymatic digestion product of linear vector plasmid, 6 μL of clone fragment gel recovery product, and 2 μL of ultra-pure H2O at 50 °C for 1 h. Connected products into E. coli BL21 DE3 competent cells were screened for positive transformants. After further expansion of culture, primers YH-Tg-gst2-F,YH-Tg-gst2-R, and universal primers pET-32a(+)- F, pET-32a(+)- R were used for PCR analysis of the bacterial solution. Gel electrophoresis and sequencing were performed to verify whether the target gene has been connected successfully.
Induced expression of recombinant vector
The positive clones obtained were inoculated into Luriae-Bertani broth (LB) liquid medium containing 100 μg/mL Amp, followed by culturing at 37 °C for 12 h. For inoculation, 250 μL liquid was added to 25 mL fresh LB liquid medium in a shaking incubator (37 °C, 200 rpm) until the cells reached the mid-log phase (OD600 = 0.5-0.8). pET-Tg-gst2 and pET-32a(+) bacteria solutions (1 mL) were used as controls. IPTG (1 mmol/L) was released to the remaining bacterial solution to induce expression in a shaking incubator (28 °C; 200 rpm). Bacterial suspension was collected each 2 h for 10 h and centrifuged at 10 000 rpm for 10 min to collect the bacteria. Next, SDS-PAGE appraisal [using the SDS-PAGE Gel Kit, Commassie Blue Staining Kit and 4× SDS-PAGE loading buffer (with DTT; Solarbio company)] was performed.
Analysis of Tg-gst2 expression in dye treatment
The T. gibbosa hyphae treated with congo red for 0, 3, 7, 10 and 14 h were collected. The total RNA of each treated hyphae was extracted, and the cDNAs were synthesised using TaKaRa reverse transcription kit. Bio-Rad CFX Maestro nucleic acid amplification fluorescence detector was used for real-time qPCR. The reaction system was as follows: 0.4 μL each of 10 μmol/L qRT-Tg-gst2-F and qRT-Tg-gst2-R (), 1 μL cDNA template, 10 μL 2 × RealStar Green Power Mixture, 8.2 μL of ddH2O. The reaction conditions were as follows: 95 °C for 3 min; 95 °C for 30 s, 60 °C for 30 s, 72 °C for 1 min, 40 cycles: 95 °C for 10 s, 55 °C for 30 s, 95 °C for 30 s. Each reaction was carried out three times.
The qRT-PCR reaction was based on an internal reference (). Transcription levels were calculated using the 2-ΔΔCT method [Citation24] to determine the expression pattern of the Tg-gst2 gene in the dye environment.
Detection of intracellular GST activity
T. gibbosa hyphae treated by congo red were extracted and ground into powder with liquid nitrogen. The powder was added to the same volume of PBS, and the PBS homogenate was subjected to centrifugation at 13000 rpm and 4 °C for 10 min to extract the supernatant. The intracellular GST activity of T. gibbosa mycelia was determined by using the glutathione S-transferase and TP assay kits (Number: A004 and A045-2, Nanjing Jiancheng Reagent Company, China).
Results
Extraction of total RNA and target gene amplification
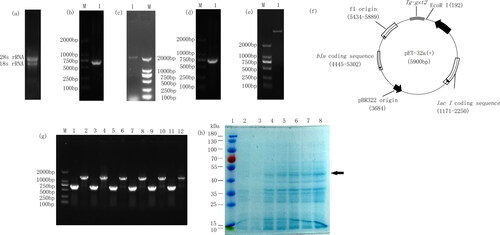
According to the transcriptome data of T.gibbosa treated by congo red (the raw reads of RNA sequencing were deposited in GenBank with the accession numbers SRR11617831-SRR11617845), an important detoxification pathway associated with congo red degradation was screened out to be the glutathione metabolic pathway (ko00480), and a GST gene, i. e. Tg-gst2 in this pathway was selected. The concentration of total RNA extracted from T. gibbosa hyphae was 1313 µg/mL, and the 260/280 and 260/230 values were 1.97 and 2.27, respectively. As shown in , the result of the gel electrophoresis showed that the 18 s and 28 s bands were clear and the RNA quality was good. Using the cDNA as template, the gene Tg-gst2 was amplified with primers Tg-gst2-F and Tg-gst2-R. A single-gene band was amplified at a size of 500–750 bp (), which was consistent with the predicted target band 672 bp. PCR products were sent for sequencing, and the sequencing results were completely consistent with the downloaded transcriptome sequence. The sequence for Tg-gst2 was submitted to the National Center for Biotechnology Information (NCBI, https://www.ncbi.nlm.nih.gov/) and the GenBank accession number is: MW056198.
Figure 2. Cloning and expression of glutathione-S-transferase (gst) gene from T.gibbosa. (a) Gel electrophoresis of total RNA of T. gibbosa hyphae; (b) Tg-gst2 was amplified by PCR using gene-specific primers. Lane M: DNA ladder 2 kb, lane 1: Amplified PCR product; (c) The promoter of Tg-gst2 was amplified by PCR using gene specific primers. Lane M: DNA ladder 2 kb, lane 1: Amplified PCR product; (d) pMD18-T-Tg-gst2 PCR gel electrophoresis; (e) Gel electrophoresis of EcoR I and Hind III digestion products of pET-32a(+); (f) Construction of recombinant plasmid containing Tg-gst2 from T. gibbosa. The expression vector pET-32a (+) was inserted with Tg-gst2 to form the recombinant plasmid pET-32a(+)-Tg-gst2; (g) Transforming Tg-gst2 from pMD18-T-Tg-gst2 into expression plasmid pET-32a(+)-Tg-gst2 PCR amplification validation. Singular: pET-32a(+)-Tg-gst2 PCR amplification, PCR amplification using pET-32a(+) universal primers; (h) Heterologous expression in E. coli with IPTG induction (1 mmol/L) at 37 °C for 0, 2, 4, 6, 8 and 10 h. Lane 1: Protein Marker (10 kD-180 kD) (Solarbio, China); Lane 2-8: E.coli harboring empty vector, E.coli harboring pET-Tg-gst2 construct induced by IPTG (1 mmol/L) at 0 h, 2 h, 4 h, 6 h, 8 h and 10 h.
Analysis of the Tg-gst2 promoter
A 2138-bp Tg-gst2 promoter was obtained (). The result indicated that the Tg-gst2 promoter contained typical promoter elements (). ABA signals play a very important role in non-biological stress responses, and ABA-mediated gene regulation occurs through the conserved ABA response element (ABRE) in the gene promoter [Citation25]. ABRE contains ATCG as a core nucleotide sequence, which acts as a binding site for the bZIP transcription factor. It was also found that some members of the MYB/MYC (bHLH) family transcription factor were also involved in the ABA reaction [Citation26,Citation27]. The Tg-gst2 promoter had five ABREs, one MYB, one Myb-binding site, and two MYCs. This indicates that Tg-gst2 may be involved in non-biological stress.
Table 2. Cis-acting regulatory elements of Tg-gst2 promoter.
Tg-GST 2 phylogenetic evolution analysis
The Tg-gst2 contained a 672 bp ORF encoding 223 amino acids (). The amino acid sequence of Tg-GST2 was searched for and blasted in NCBI (https://blast.ncbi.nlm.nih.gov/Blast.cgi?PROGRAM=blastp&PAGE_TYPE=BlastSearch&LINK_LOC=blasthome), and 38 homologous protein sequences were selected. The amino acid sequence of Tg-GST2 had the highest homology of 87.89% with GSTs of other species. All the 38 GSTs amino acid sequences were associated with 12 fungal species (Polyporus brumalis, P. arcularius,Trametes pubescens,T. versicolor, T. coccinea, Dichomitus squalens, Lentinus tigrinus, Wolfiporia cocos, Daedalea quercina, Obba rivulosa, Fomitopsis pinicola, and Grifola frondos). The MEGAX software was used to build a phylogenetic tree, as shown in . The GST proteins of all the fungi clustered into a large branch and then divided into two, indicating that these GST proteins shared a common ancestor. Tg-GST2 was closely related to Trametes GST proteins. Tg-GST2 was most similar to T. versicolor GST (XP_008034241.1) and T. pubescens GST (OJT10732.1), as they belonged to the same branch. These phylogenetic relationships were consistent with classical classification of species.
Figure 3. Phylogenetic tree and motif prediction of glutathione-S-transferase (GST) proteins sequences of various species. Orange shades represent Tg-GST 2 protein. (a) Phylogenetic tree of GSTs. The blue shadow represents two GSTs closely to Tg-GST2 protein affinities. (b) Analysis of gene structure, conserved motif elements and domains of GSTs.
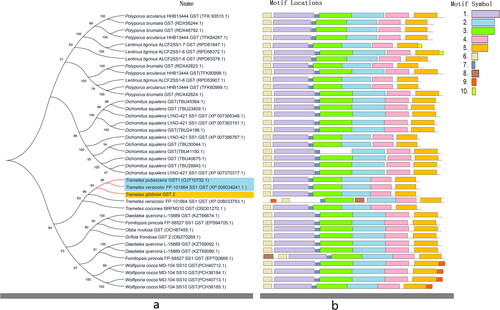
The 10 conserved motifs of the 39 GSTs were identified using the MEME online tool, and it was found that different members contained 7-8 motifs and the amino acid length of each conserved motif was between 6 and 50 aa ( and ). Using NCBI-CDD (https://www.ncbi.nlm.nih.gov/Structure/cdd/wrpsb.cgi) identification, we found that motifs 1 and 3 were thioredoxin-like and they belonged to the GST_N motif; motifs 2 and 5 were GST_C, which belonged to different types of GST proteins C conserved domains; and the functions of motifs 6-10 were unknown. Motifs 2, 4 and 5 were present in all 39 members, indicating that they were the most conservative in the GSTs. According to MEME projections, the motifs of Tg-GST2, Trametes versicolor (XP_008034241.1) GST, and T. pubescens (OJT10732.1) GST were identical, which were consistent with the phylogenetic tree results.
Table 3. Sequence and funtion of GST motifs.
Bioinformatics analysis of Tg-GST2
According to ProtParam, the molecular weight of Tg-GST2 was 25.59 kDa, and the theoretical isoelectric point was 7.03. This protein was a neutral protein, and the most abundant amino acids were Ala (A) and Lys (K) (the proportions of both were 8.5%), and the least abundant was His (H) (2.7%). There were 26 negatively charged amino acid residues (Asp + Glu) and 26 positively charged amino acid residues (Arg + Lys). The protein’s grand average of hydropathy (GRAVY) was −0.421,instability index was 23.16 (>40, unstable; < 40, stable), and aliphatic index(Ai) was 75.25, indicating that the protein was stable and hydrophilic in a wide temperature range. According to the parent/hydrophobic signal obtained by Protscale analysis, the C-terminal of GST protein contained a hydrophobic head, whereas the N-terminal contains a hydrophilic head. The 149th amino acid was the most hydrophobic, with a value of 2.044, and the 140th amino acid was the most hydrophilic, with a value of −2.933.24. O-glycosylation sites were predicted in the protein sequence; three sites (at 22nd, 26th, and 108th position) with scores higher than 0.5 were predicted as glycosylated and marked with the string “positive.” Eleven sites, 4 serine (2nd,40th,92nd, and 133rd), 4 threonine (60th, 70th, 94th, and 147th), and 3 tyrosine (10th, 36th, and 100th) as “non potential N-glycosylation site”.
Transmembrane region prediction is to detect the ability if a protein has the ability to transmit substances or signals. The transmembrane region of Tg-GST2 was predicted using TMHMM, and all amino acids (1–223 sites) of the protein were located outside the cell membrane. The result showed that the protein had no transmembrane structure. Signal peptide sequence is used to direct newly synthesised proteins into different subcellular organelles of cell. SignalP was used to predict the signal peptide of Tg-GST2. There was no signal peptide shear site in the protein, and it did not have the ability to transmit substances or signals, indicating that it belonged to cytosolic GST. Proteins are a basic components of life; each protein could function only within specific subcellular compartments. To predict the subcellular region of the protein,it was helpful to understand the functional properties of the protein and the subcellular localization as well as the relationships among the protein and other proteins. The PSORT II prediction results showed that Tg-GST2 mainly located in the cytoplasm (56.5%), and it was also found in the nucleus (26.1%), mitochondrial (13.0%) and Golgi body (4.3%). In summary, the Tg-GST2 is non-secretory, and it directly plays its role in the cytoplasmic matrix.
Structure-function prediction of Tg-GST 2 by GST homology-based modeling
Tg-GST2 has GST signature domain, N-domain (from 6aa to 87aa) and C-domain (from 98aa to 213aa), based on the prediction by NCBI (https://www.ncbi.nlm.nih.gov/Structure/cdd/wrpsb.cgi). Tg-GST2 belongs to Ure2p subfamily of GSTs. Studies have shown that Ure2p subfamily is involved in many physiological processes of fungi, such as metal ion stress [Citation28], nitrogen metabolism [Citation29] and lignocellulose degradation [Citation5,Citation16]. Phylogenetic studies have shown that the Ure2pclusters in two subclasses, Ure2pA and Ure2pB [Citation22]. The Ure2pB subfamily is widespread in fungi, and the GSTs of Ure2pA subfamily are found only in fungi and can degrade lignocellulose, and neither Boletales nor Agaricales contain this type of GSTs [Citation23].
The Tg-GST2 has four β strands and eight α helixs according to the prediction of the secondary structure (). Based on the SWISS-MODEL, the three-dimensional structure of Tg-GST2 was predicted using the protein structure of Ure2pA4 from P. chrysosporium (PcUre2pA4, PDB:4zb6) as a template (). Between the template and the Tg-GST2 sequence, the coverage was 98% and the sequence identity was 59.17%. Proteins that normally belong to the same GST family generally require a sequence similarity above 40% in mammals, plants, bacteria, etc. Thus, it was inferred that Tg-GST2 was a type of Ure2pA GST [Citation23]. Relevant studies have showed that the Ure2pAs of GSTs are fungal-specific.
Figure 4. Three-dimensional structure schematic representation of Tg-GST2 and multiple sequence alignment of deduced amino acid sequence of Tg-GST2; (a) Three-dimensional structure schematic representation of Tg-GST2. A and B monomers were colored yellow and cyan, respectively. Black font indicates protein secondary structure; (b) Identical residues were shaded in black. The secondary structure elements of Tg-GST2 were labeled and indicated by coils for helix α and by oblong shape for strand β. The amino acid sequence of Tg-GST2 was compared with those of other GST available in phylogenetic tree from NCBI public database. Numbers on the right were the residue number of the last amino acid in each line. Single letter amino acid code was used. The sequences were aligned and box shaded using BioXM .T.g.: Tg-GST2 amino acid sequence, T.V.:T. versicolor FP-101664 SS1 GST C-terminal (XP_008034241.1) amino acid sequence, percentage matching 85.65%, T.P.:T. pubescens GST1 (OJT10732.1) amino acid sequence, percentage matching 87.89%. Position of conserved characteristic residues of GSH binding site (G-site) and polypeptide binding site (H-site) were marked as ▲; (c) Structure-based sequence alignment of Tg-GST2 with two Ure2pA glutathione transferases from P. chrysosporium PcUre2pA4 (PDB no.4Z6B) and PcUre2pA6 (PDB no.4ZB8). The catalytic motifs were shaded yellow. The residues involved in the binding of GS1 and GS2 moieties were shaded blue and purple, respectively. The residue pair which constitutes the inter-subunit ‘ock-and key’hydrophilic interaction was shaded green. The quasi invariant residues in the GST superfamily were shaded orange.
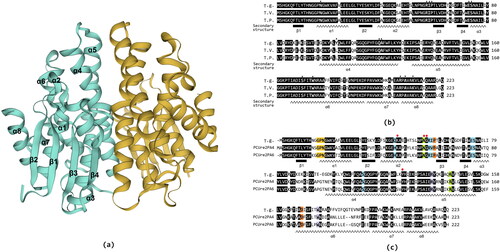
Tg-GST2 is a dimer protein, and based on the predicted secondary and tertiary structures, most of the Tg-GST2 amino acid sequences are in spiral crimp state. Each subunit of the dimer consists of an N-terminal thioredoxin-like domain (β1, α1, β2, α2, β3, β4 and α3), followed by an all-helical C-terminal domain (α4, α5, α6, α7 and α8), and a variable junction region (linker) between the two domains. Four β strands are in the order of β4, β3, β1, and β2 at N-terminal thioredoxin-like domain, and β3 is antiparallel to the other three strands (). Unlike most GSTs, the GSTs from PcUre2pA monomers mainly interact with polar contacts, as was previously observed for the beta GSTs [Citation30].
According to the prediction of conserved domains, the GSH binding site (G-site) of Tg-GST2 is at the end of the GST_N domain, and the conserved characteristic residues are N17, R57, I58, P59, E73 and S74 (). The polypeptide binding site (H-site) of Tg-GST2 is at the end of the GST_C domain, it may combine with exogenous toxic substances [Citation7], and the conserved characteristic residues of the H-site are Y103, Q109, A110, S170, T173, W174, R207, A209 and K212 (). The amino acid sequences of the two GSTs most closely related to Tg-GST2 in the phylogenetic tree (T. versicolor XP_008034241.1 and T. pubescens OJT10732.1) () aligned with the Tg-GST2 amino acid sequences (). The conserved characteristic residues of predicted G-site and H-site were found to appear stably on the other two GSTs, except for the Y103 residue from the H-site. This was because that the H-site was used to bind hydrophobic substrates (usually exogenous toxic substances). Since the hydrophobic substrates, are generally large, the space of the binding site is relatively larger than that of the G-site and the structure of the site is also very large according to the different types of GSTs involved in the reaction. The prediction of conserved domains and feature sites alignment showed that Tg-GST2 had typical GST conserved features and residues with a slight change. These analyses demonstrated the ability of Tg-GST2 to combine GSH and exogenous toxic substances.
Table 4. Information of Tg-GST2 G-site and H-site.
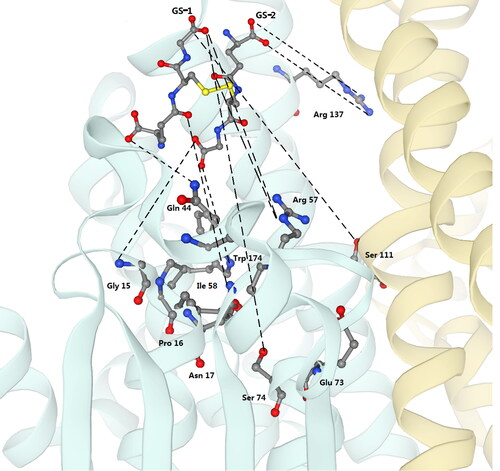
Two templates, PcUre2pA4 and PcUre2pA6 (PDB: 4zb6,PDB: 4zb8), both being from gluathione transferase Ure2pA of P. chrysosporium and with the highest similarity to Tg-GST2, were retrieved using the SWISS-MODEL. The amino acid sequences of Tg-GST2, PcUre2pA4 and PcUre2pA6 were blasted. Based on the amino acid function of PcUre2pA4 and PcUre2pA6, the structure and function of Tg-GST2 were determined. The GSTs of Ure2pA share a quite conserved Thr-Pro-Asn motif, where the side chains of the threonine and the asparagine residues are thought to be critical for catalysis [Citation31–33]. However, according to a comparative analysis, the predicted Tg-GST2 lacked threonine, the catalytic triplet residues of Tg-GST2 was Gly-Pro-Asn (). Of the residues, the asparagine (Asn, N, 17) residue was thought to be critical for catalysis. Asparagine was the only residue that could assume a role in GS-1 (one half of oxidized glutathione GSSG) activation. GS-1 was bound in the canonical GST G-site. The GS-1 binding sites in Tg-GST2 were assumed to be glutamine (Gln, Q, 44), arginine (Arg, R, 57), isoleucine (Ile, I, 58), glutamine (Glu, E, 73) and serine (Ser, S, 74 and 111) ( and Citation6). Serine (Ser, S, 111) residue from α4 of the adjacent subunit participated in the stabilization of the GS1 ammonium group (). GS-2 (the second half of GSSG) was antiparallel to GS-1 and packed along the α4 near the dimer interface. The GS-2 binding sites in the Tg-GST2 were presumed to be arginine (Arg, R, 137) and trytophane (Trp, W, 174) (Figures 4c, 5c and Citation6). The well-known inter-subunit “lock-and key” hydrophobic interaction identified in several GST structures was replaced by three hydrogen bonds between the residues Asn55, which was between N-domain α2 and β3 and Arg144, which was in the C-terminal α5 [Citation34] (Figures 4c and 5e). The quasi-invariant residues in the GST superfamily were Pro 59 and Asp 168 ( and 5).
Figure 5. View of the active sites of Tg-GST2. (a) Residues of catalytic motif, which is indicated by yellow shadow in ; (b) Residues of the binding of GSSG (GS-1 moieties), which is indicated by blue shadow in ; (c) Residues of the binding of GSSG (GS-2 moieties), which is indicated by purple shadow in ; (d) The quasi invariant residues in the Tg-GST2, which is indicated by orange shadow in ; (e) The residue pair which constitutes the inter-subunit ‘lock-and key’ hydrophilic interaction, which is indicated by green shadow in .
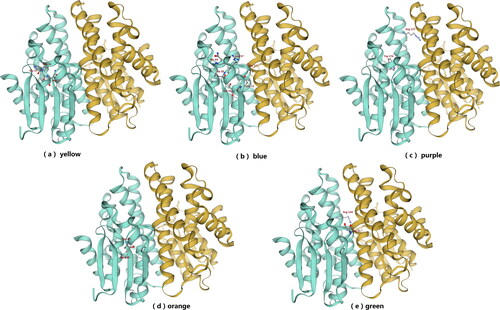
Figure 6. Close-up view of the active sites of Tg-GST2. Residues involved in the binding of GSSG (GS-1 and GS-2 moieties) and GSSG molecules are shown as sticks and labeled and colored according to atom type. A and B monomers are colored green and yellow, respectively. Black dashed lines are connected between the ligands and the enzyme (version of this article).
Molecular docking analysis
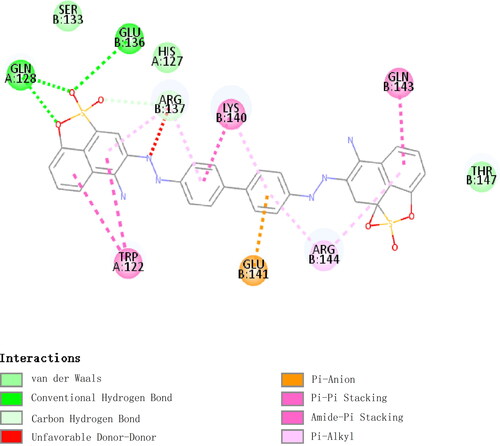
A binding energy ˂ 0 indicates that the ligand could bind to the receptor spontaneously, and a lower binding energy indicates a more stable binding conformation. Binding energy values ˂-5.0 kcal/mol and −7.0 kcal/mol indicate good and strong binding activity, respectively. The binding energy between Tg-GST2 and GSSG was −8.5 kcal/mol and that between Tg-GST2-GSSG and congo red was −9.12 kcal/mol. This showed that Tg-GST2 could combine with congo red. According to the tertiary structure, it was found that GSSG and Tg-GST2 interacted through 11 hydrogen bonds (), including 20 Lys, 53 Asn, 55 Asn, 57 Arg, 58 Ile, 59 Pro, 73 Glu, 109 Gln, and 119 Gln from A subunit and 116 Tyr and 137 Arg from B subunit. Congo red interacted with Tg-GST2 through three hydrogen bonds, two hydrogen bonds on Gln 128 on A subunit and one hydrogen bond on B subunit. Congo red also interacted through pi-pi stacking with 122 Trp of A subunit, carbon hydrogen bond with 137 Arg, pi-anion interactions with 141 Glu and 143 Gln and pi-alkyl interactions with 144 Arg of B subunits (). The 2 D and 3 D predictions by molecular docking indicated a strong binding ability between Tg-GST2 and congo red. Through the molecular docking analysis, it was also inferred that Tg-GST2 might play a role in the degradation of congo red.
Figure 7. 3 D molecular docking results of Congo and GSSG with Tg-GST2.The yellow dotted line was a hydrogen bond link.
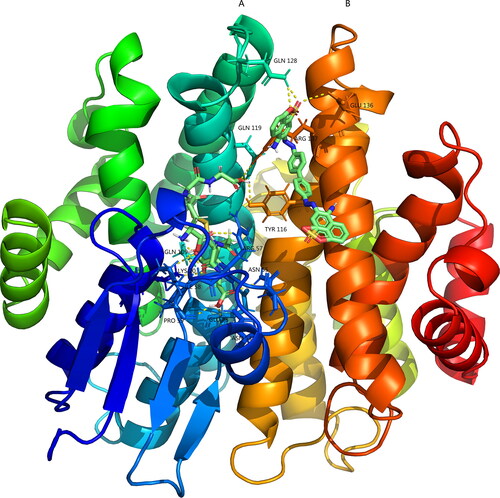
Figure 8. 2D molecular docking results of congo red with Tg-GST2.
Prokaryotic expression of Tg-gst2
The Tg-gst2 was successfully transferred to the pMD18-T vector (). pET-32a(+) was digested with EcoR I and Hind III enzymes (). In-Fusion cloning technology was used to transfer Tg-gst2 into digested pET-32a(+) plasmid. PCR detection and the position where Tg-gst2 was inserted into pET-32a(+) are shown in Citation2f and 2g, respectively. The recombinant plasmid pET-32a(+)- Tg-gst2 was transformed into BL21 DE3 and isopropyl β-D-thiogalactoside (IPTG) was used to induce the expression of recombinant protein (). E.coli harbouring empty vector had no target protein bands at 0 h. When the recombinant plasmid pET-32a(+)- Tg-gst2 was induced by IPTG for 2, 4, 6, 8 and 10 h, respectively, there was a 43.29 KDa protein (Tg-GST2 25.59 KDa + Tag protein 17.7 KDa) with the expected size. In addition, we found that the expression of protein was not affected by the induction time. This showed that the prokaryotic expression vector pET-32a(+)- Tg-gst2 was successfully constructed, and the target protein was successfully expressed through IPTG induction.
Transcription level of Tg-gst2 at different stages congo red treatment
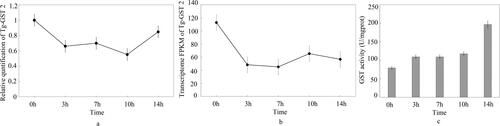
The expression of Tg-gst2 treated with congo red was detected by real-time qPCR and transcriptome analysis, and the expression was generally consistent for the different methods (). After treatment with congo red, Tg-gst2 expression initially decreased and then increased later. Tg-gst2 expression was inhibited by congo red, and the effect of congo red reduced after adaptation of T. gibbosa to congo red.
Figure 9. Expression of the Tggst2 and GST activity from T.gibbosa at different stages of congo red treatment. (a) Expression of the Tg-gst2 by Real time qPCR; (b) Expression of the Tggst2 by transcriptional sequencing; (c) GST activity.
GST activity of T.gibbosa treated by congo red
The GST activity of T. gibbosa treated by congo red increased with time, and the highest GST activity was 196.4 U/mg prot at 14 h. GST activity became much higher than other time from 10 to 14 h ().
Discussion
Research had shown that the harmful effect of polycyclic aromatic hydrocarbons (PAHs) in water environments was gaining increasing attention, and exposure under PAHs could induce a series of detoxification responses in organisms, including aryl hydrocarbon receptor signaling (AhR) pathway and phase I, II and III detoxification systems [Citation35,Citation36]. Genes associated with PAHs detoxification may include the genes encoding heat shock protein 90 (HSP90), aryl hydrocarbon receptor (AhR), aryl hydrocarbon receptor nuclear translocator (ARNT) and the key genes of detoxification metabolism in phase 0 detoxification system [P-glycoprotein(PgP)], phase I detoxification system (cytochrome P450), and phase II detoxification system (glutathione S-transferase) [Citation37]. Glutathione S_transferase is an important component of the PAHs detoxification system.
Currently, the classification system for the mainstream of fungal GSTs is unclear. The existing criteria could not be used for the classification of some fungal GST proteins. Fungal GSTs have a more complex phylogenetic relationship than other species [Citation17,Citation28]. The Ure2p family of GSTs are abundant in most fungi, and they contains a conserved GST_N_Ure2p_like functional domain (cd03048). The Ure2p family of GSTs are involved in various fungal physiological processes, such as metal ion stress [Citation38], nitrogen metabolism [Citation16] and lignocellulose degradation [Citation5,Citation16]. The Ure2p family could be divided into two types: Ure2pA and Ure2pB. Ure2pB has a conserved functional domain (GST_C_YfcG_like) of bacterial GST, compared with Ure2pA. The Ure2pB subfamily is widespread in fungi, while the GSTs of the Ure2pA subfamily exists only in Polyporus with the ability to degrade lignocellulose. Boletales and Agaricales do not have GSTs of Ure2pA. The GSTs of Ure2pA are believed to participate in the degradation of lignocellulose and the intracellular scavenging of toxic molecules in wood-degrading fungi [Citation19,Citation23]. The structure of the congo red is similar to that of lignin, thus, it is speculated that the Ure2pA GSTs may participate in the degradation of the dye. According to the results of transcriptome expression and real-time qPCR, the Ure2pA gene of T. gibbosa was expressed differently under congo red conditions.
Bchini et al. using real-time analyses of biomolecular interactions, showed that GSSG allowed eEF1Bγ to physically interact with other GSTs from Ure2p and played a role in oxidative stress reactions [Citation39]. The molecular docking study of GSSG, congo red, and Tg-GST2 in this paper showed that there was a lower binding energy between Tg-GST2 and GSSG and between Tg-GST2-GSSG and congo red, which indicated that Tg-GST2, GSSG, and congo red could bind and interreact with each other. Further functional studies on fungal GSTs from Ure2p subfamily are necessary in the future.
Conclusions
In the present study, a glutathione transferase gene from T. gibbosa was cloned and sequenced. Successful expression of a 25.59 KDa Tg-GST2 in E. coil BL21 was achieved. Real-time qPCR and high throughput sequencing technique were used to verify the response of gene Tg-gst2 in congo red environment. GST activity was enhanced with congo red treatment. Tg-GST2 is a fungal GST, and it belongs to the Ure2pA subfamily of GSTs. Homology-based modeling of Tg-GST2 provided in-depth insight into its secondary and 3D structures, including G-site and H-site conserved site residues, active-site residues, GSSG-related mechanisms, and “lock-and key” hydrophilic interaction residues. Molecular docking showed that Tg-GST2 had a strong docking energy for congo red. The binding sites of Tg-GST2 and congo red were predicted. This study described gene cloning, heterologous expression and 3D structure prediction of a GST of Ure2pA from white-rot fungus T. gibbosa. Therefore, this study had a great significance for the application of GST in the decolorization and detoxification of dyes.
Ethical approval
This article does not contain any studies with human participants or animals performed by any of the authors.
Authors’ contributions
Conceived and designed experiments: YC, JZ. Acquired Funding: JZ, YC. Collected the data and performed the analysis: JZ, LF, YY, SL, XG. Administrated resources for the project: YC, JZ. Drafted the manuscript: JZ and YC. Performed critical review of the manuscript with editions: YC. All authors read and approved the final manuscript.
tbeq_a_1997157_sm1670.pdf
Download PDF (156.1 KB)Disclosure statement
No potential conflict of interest was reported by the authors.
Data availability statement
The data that support the findings of this study are available upon request from the corresponding author. The raw reads of RNA sequencing were deposited in GenBank with the accession numbers of SRR11617831-SRR11617845.
Additional information
Funding
References
- Dittmann J, Heyser W, Bücking H. Biodegradation of aromatic compounds by white rot and ectomycorrhizal fungal species and the accumulation of chlorinated benzoic acid in ectomycorrhizal pine seedlings. Chemosphere. 2002;49(3):297–306.
- Cameron MD, Timofeevski S, Aust SD. Enzymology of Phanerochaete chrysosporium with respect to the degradation of recalcitrant compounds and xenobiotics. Appl Microbiol Biotechnol. 2000;54(6):751–758.
- Syed K, Shale K, Pagadala NS, et al. Systematic identification and evolutionary analysis of catalytically versatile cytochrome p450 monooxygenase families enriched in model basidiomycete fungi. PLoS One. 2014;9(1):e86683.
- Liao W-Q, Liang X-F, Wang L, et al. Molecular cloning and characterization of alpha-class glutathione S-transferase gene from the liver of silver carp, bighead carp, and other major Chinese freshwater fishes. J Biochem Mol Toxicol. 2006;20(3):114–126.
- Morel M, Meux E, Mathieu Y, et al. Xenomic networks variability and adaptation traits in wooddecaying fungi. Microb Biotechnol. 2013;6(3):248–263.
- Hayes JD, Pulford DJ. The glutathione S-transferase supergene family: regulation of GST and the contribution of the lsoenzymes to cancer chemoprotection and drug resistance part II. Crit. Rev. Biochem. Mol. Biol. 1995;30(6):455–520.
- Dixon DP, Lapthorn A, Edwards R. Plant glutathione transferases. Genome Biol. 2002;3(3):1–10.
- Marrs KA. The functions and regulation of glutathione S-transferases in plants. Annu Rev Plant Physiol Plant Mol Biol. 1996;47:127–158.
- Sheehan D, Meade G, Foley V, et al. Structure, function and evolution of glutathione transferases: implications for classification of non-mammalian members of an ancient enzyme superfamily. Biochem J. 2001;360(Pt 1):1–16.
- Tsuchida S, Sato K. Glutathione transferases and cancer. CRC Crit. Rev. Biochem. Mol. Biol. 1992;27(4–5):337–384.
- Hayes JD, Wolf CR. Glutathione conjugation: Mechanisms and biological significance. London: Academic Press; 1988.
- Schröder P, Scheer CE, Diekmann F, et al. How plants cope with foreign compounds. Translocation of xenobiotic glutathione conjugates in roots of barley (hordeum vulgare). Environ Sci Pollut Res Int. 2007;14(2):114–122.
- Nebert DW, Vasiliou V. Analysis of the glutathione S-transferase (GST) gene family. Hum Genomics 1. 2004;6:460–464.
- Tripathi T, Rahlfs S, Becker K, et al. Glutathione mediated regulation of oligomeric structure and functional activity of Plasmodium falciparum glutathione S transferase. BMC Struct Biol. 2007;7:67.
- Pandey T, Singh SK, Chhetri G, et al. Characterization of a highly pH stable chi-class glutathione S-transferase from synechocystis PCC 6803. PLoS One. 2015;10(5):e0126811.
- Morel M, Ngadin AA, Droux M, et al. The fungal glutathione S-transferase system. Evidence of new classes in the wood-degrading basidiomycete Phanerochaete chrysosporium. Cell Mol Life Sci. 2009;66(23):3711–3725.
- Goldrick SM, O’Sullivan SM, Sheehan D. Glutathione transferase-like proteins encoded in genomes of yeasts and fungi: insights into evolution of a multifunctional protein superfamily. FEMS Microbiol Lett. 2005;242(1):1–12.
- Xun L, Belchik S, Xun R, et al. S-Glutathionyl-(chloro)hydroquinone reductases: a novel class of glutathione transferases . Biochem J. 2010;428(3):419–427.
- Mathieu Y, Prosper P, Favier F, et al. Diversification of fungal specific class a glutathione transferases in saprotrophic fungi. PLoS One. 2013;8(11):e80298.
- Zhang Z-R, Bai M, Wang X-Y, et al. “Restoration” of glutathione transferase activity by single-site mutation of the yeast prion protein Ure2. J Mol Biol. 2008;384(3):641–651.
- Kalita J, Shukla H, Tripathi T. Engineering glutathione S-transferase with a point mutation at conserved F136 residue increases the xenobiotic-metabolizing activity. Int J Biol Macromol. 2020;163:1117–1126.
- Thuillier A, Ngadin AA, Thion C, et al. Functional diversification of fungal glutathione transferases from the Ure2p class. Int J Evol Biol. 2011;2011:938308.
- Roret T, Thuillier A, Favier F, et al. Evolutionary divergence of Ure2pA glutathione transferases in wood degrading fungi. Fungal Genet Biol. 2015;83:103–112.
- Qi YC, Liu C, Sun XK, et al. The identification of transcriptional regulation related gene of laccase poxc through yeast one-hybrid screening from Pleurotus ostreatus . Fungal Biol. 2017;121(11):905–910.
- Hattori T, Totsuka M, Hobo T, et al. Experimentally determined sequence requirement of ACGT-containing abscisic acid response element. Plant Cell Physiol. 2002;43(1):136–140.
- Cardi M, Chibani K, Cafasso D, et al. Abscisic acid effects on activity and expression of barley (hordeum vulgare) plastidial glucose-6-phosphate dehydrogenase. J Exp Bot. 2011;62(11):4013–4023.
- Kashiwakura Y, Kobayashi D, Jikumaru Y, et al. Highly sprouting-tolerant wheat grain exhibits extreme dormancy and cold imbibition-resistant accumulation of abscisic acid. Plant Cell Physiol. 2016;57(4):715–732.
- Shen M, Zhao DK, Qiao Q, et al. Identification of glutathione S-transferase (GST) genes from a dark septate endophytic fungus (exophiala pisciphila) and their expression patterns under varied metals stress. PLoS One. 2015;10(4):e0123418.
- Magasanik B. The transduction of the nitrogen regulation signal in Saccharomyces cerevisiae. Proc Natl Acad Sci U S A. 2005;102(46):16537–16538.
- Rossjohn J, Polekhina G, Feil SC, et al. A mixed disulfifide bond in bacterial glutathione transferase: functional and evolutionary implications. Structure. 1998;6(6):721–734.
- Stourman NV, Branch MC, Schaab MR, et al. Structure and function of YghU, a nu-class glutathione transferase related to YfcG from Escherichia coli. Biochemistry. 2011;50(7):1274–1281.
- Thuillier A, Roret T, Favier F, et al. Atypical features of a Ure2p glutathione transferase from Phanerochaete chrysosporium. FEBS Lett. 2013;587(14):2125–2130.
- Wadington MC, Ladner JE, Stourman NV, et al. Analysis of the structure and function of YfcG from Escherichia coli reveals an efficient and unique disulfide bond reductase. Biochemistry. 2009;48(28):6559–6561.
- Sheehan D, Meade G, Foley VM, et al. Structure, function and evolution of glutathione transferases: implications for classifification of non-mammalian members of an ancient enzyme superfamily. Biochem. J. 2001;360(1):1–16.
- Paetzold SC, Ross NW, Richards RC, et al. Up-regulation of hepatic ABCC2, ABCG2, CYP1A1 and GST in multixenobiotic-resistant killifish (Fundulus heteroclitus) from the Sydney Tar Ponds, Nova Scotia. Mar Environ Res. 2009;68(1):37–47.
- Sarkar A, Bhagat J, Sarker MS, et al. Evaluation of the impact of bioaccumulation of PAH from the marine environment on DNA integrity and oxidative stress in marine rock oyster (Saccostrea cucullata) along the Arabian sea coast. Ecotoxicology. 2017;26(8):1105–1116.
- Zhou YY, Yao LL, Pan LQ, et al. Bioaccumulation and function analysis of glutathione S-transferase isoforms in manila clam ruditapes philippinarum exposed to different kinds of PAHs. J Environ Sci. 2022;112:129–139.
- Magasanik B, Kaiser CA. Nitrogen regulation in Saccharomyces cerevisiae. Gene. 2002;290(1–2):1–18.
- Bchini R, Girardet J-M, Sormani R, et al. Oxidized glutathione promotes association between eukaryotic translation elongation factor 1Bγ and Ure2p glutathione transferase from Phanerochaete chrysosporium. Febs J. 2021;288(9):2956–2969.