
Abstract
The research objects of this paper are Vigna angularis, Vigna radiata and Phaseolus vulgaris, which are important grain legume resources in China. However, the genetic structure between the three species is not clear. Therefore, this study developed a set of universal gSSR (simple sequence repeat) primers based on the whole-genome sequences of adzuki beans, mung beans and common beans and analysed the genetic diversity of the test resources based on universal gSSR loci. A total of 53,099 pairs of universal primers were developed, and 43 universal primer pairs were selected for analysis of their test resources. The genetic diversity of the tested common bean germplasm resources was the largest, and the genetic diversity of the tested mung bean germplasm resources was the smallest. Based on the structural analysis and NJ algorithm, the genetic relationships of the test resources were analysed. When ΔK = 3, 3 and 2, the test resources were divided into 3, 3 and 2 subgroups, respectively. The average genetic differentiation coefficient among the three species was 0.24, and the average gene flow value was 0.78. The genetic distances among the three species ranged from 0.27 to 0.90. The genetic distance between the tested adzuki bean germplasm resources and the tested mung bean germplasm resources was the closest, and the genetic distance between the test adzuki bean germplasm resources and the tested common bean germplasm resources was the farthest. This study provides a scientific basis for the rational development, protection and sustainable use of germplasm resources.
Introduction
With more than 2000 species and 800 genera, Leguminosae is the third largest flowering plant family after Compositae and Orchidaceae [Citation1]. Some legumes are farmland weeds, while others are important food crops [Citation2]. Grain legumes refer to the beans that are harvested for seeds [Citation3]. However, unlike cereals, most grain legumes are important sources of plant protein [Citation2]. Beans can interact with rhizobia in soils to fix nitrogen in their external environments to maintain the growth of the beans, which reduces the dependence of crops on nitrogen fertilizers [Citation4]. The research objects of this study are the adzuki bean (Vigna angularis), mung bean (Vigna radiata) and common bean (Phaseolus vulgaris). Adzuki beans, mung beans and common beans belong to the Phaseoleae tribe, Papilionaceae family. With people’s pursuit of quality lives and more reasonable diet structures, there is an increasing demand for high-quality adzuki beans, mung beans and common beans.
At present, many scholars have studied the genetic diversity of adzuki beans, mung beans and common beans. Wild adzuki bean (Vigna angularis var. nipponensis), considered to be the ancestor of cultivated adzuki bean, occurs in East Asia and in the Himalayan Region, which are presumed to be where the domestication of adzuki bean took place [Citation5]. Xu et al. [Citation6] analysed the genetic diversity of 146 Asian adzuki bean germplasm resources and found that adzuki bean seed resources are mainly divided into five categories: Himalayan wild, Nepal–Bhutan cultivated, Chinese wild, Taiwan wild–Bhutan cultivated and northeast Asian accessions, and initially believed that the cultivated adzuki bean may have a polycentric origin and evolution. The study of Jin et al. [Citation7] reported similar results. Noble et al. [Citation8] conducted genome-wide association analysis on 466 mung bean resources and identified four different clusters among the cultivated varieties. Bangar et al. [Citation9] also obtained similar results in 52 mung bean germplasm resources. Kaur et al. [Citation10] used simple sequence repeat (SSR) molecular markers to analyse the genetic diversity of 23 mung bean varieties. The clustering based on SSR marker data clearly showed the narrowness of the genetic basis of mung bean genotype. There are two domestication centres for common beans, namely the Mesoamerican domestication centre and the Andean domestication centre [Citation11–13]. Gepts et al. [Citation14] identified the protein types of common bean seeds. The data favour two primary areas of domestication, one in Middle America leading to small-seeded cultivars with ‘S’ phaseolin patterns and the other in the Andes giving rise to large-seeded cultivars with ‘T’ (and possibly ‘C,’ ‘H’ and ‘A’) phaseolin patterns [Citation14]. Chen et al. [Citation15] developed 90 pairs of markers for diversity analysis. It was found that among the 131 Chinese common bean germplasm resources, most of the germplasm resources came from the Mesoamerican domestication centre.
The SSR site is not conserved but the upstream and downstream primer annealing sites are conserved. A certain SSR site of a given species is universal among species within the same family or species of closer kinship. Based on common SSRs in several species, the primers developed at SSR sites are called universal primers. Statistics show that the closer the genetic distance between species is, the more common SSR sites there are [Citation16–18]. Zhao et al. [Citation19] constructed a high-density genetic linkage map of mung bean. The transferability of the SSR markers from these relatives of mung bean, including azuki bean (V. angularis), black gram (V. mungo), common bean (Phaseolus vulgaris) and cowpea (V. unguiculata) was also evaluated. About 65% of adzuki beans, 72% of black beans, 42% of common beans, and 30% of cowpea SSR markers can be effectively amplified in mung bean. In recent years, research on genetic diversity of adzuki bean, mung bean and common bean germplasm resources has mainly focused on EST-SSR marker analysis. And there is little research on the development of adzuki bean, mung bean or common bean gSSR primers or SSR universal primers [Citation20–23]. The aim of this study was to construct gSSR universal primers for adzuki bean, mung bean and common bean, which can be used for both intraspecific and interspecific genetic diversity analysis.
Materials and methods
Plant materials
In this study, 100 local adzuki bean germplasm resources were analysed: 2 from Shanxi Province, 9 from Liaoning Province, 9 from Jilin Province, and the remaining from Heilongjiang Province, all of which were cultivated varieties and farm varieties (Supplemental Table S1). There were 118 local mung bean germplasm resources analysed: 7 from Liaoning Province, 7 from Jilin Province, 3 from Xinjiang, 1 each from Henan Province and Inner Mongolia, and 1 from Syria, while the remaining resources were from Heilongjiang Province. For the cultivated species and farm varieties, see Supplemental Table S2. There were 303 local common bean germplasm resources analysed in this study, including 3 common bean germplasm resources from Jilin Province, 4 from Inner Mongolia, 1 from Shandong Province and 1 from Gansu Province, 3 from Syria, 2 from Japan, and 1 each from Canada, Britain and the United States. The rest of the germplasm resources came from Heilongjiang, all of which were cultivated species and farm varieties (Supplemental Table S3).
Table 1. SSR type distributions in grain legume genomes.
Table 2. Proportions of repeated motifs in adzuki bean di/trinucleotides.
Table 3. Proportions of repeated motifs in mung bean di/trinucleotides.
Design of gSSR primers for adzuki bean, mung bean and common bean
MISA software was used to find the whole genome microsatellite (gSSR) sites of adzuki beans, mung beans and common beans [Citation24–26]. The parameters were set to 1–10, 2–6, 3–5, 4–5, 5–5 and 6–5 (repeat unit type – minimum number of repetitions), and the maximum number of bases between 2 composite SSR sites was 100 [Citation27]. Combined with the whole-genome information, a self-programmed MATLAB script was used to extend the upstream and downstream regions of each gSSR site by 500 bp, and the results were output as BOULDER-IO files. Primer3-1.1.4-WINXP was used to design batches of gSSR primers for adzuki beans, mung beans and common beans. The default pri-mer3-1.1.4-WINXP parameter settings were used, and the output primers were named “physical location of species abbreviated linkage group name” [Citation28, Citation29].
Design of universal gSSR primers for adzuki bean, mung bean and common bean
The makeblastdb tool was used to build a database for the whole-genome information of adzuki beans, mung beans and common beans and to simultaneously compare the output results with the database and output the fa files. The pl files were programmed individually to sort the output fa files, the universal primers were extracted [Citation30], 10 pairs of primers were randomly selected from adzuki beans and common beans according to the physical distance of each chromosome, and 30 pairs of universal primers were randomly selected from mung beans, total 250 pairs. The primers were used for the evaluation of universal primers (Supplemental Table S4).
Table 4. Proportions of repeated motifs in common bean di/trinucleotides.
DNA extraction, PCR amplification and polyacrylamide gel electrophoresis of adzuki bean, mung bean and common bean germplasm resources
Twelve resources (G000064, G000023, G000021, G000086, F000017, F000069, F000030, F000050, E000080, E000004, E000093, E000001) were selected from the tested adzuki bean, mung bean and common bean resources from which to extract DNA for the screening of universal SSR primers. The DNA extraction was conducted using the CTAB method commonly used in laboratories, and we used a nanodrop spectrophotometer to detect the content and purity of DNA. The DNA samples were diluted to 100 ng/μL and stored at −80 °C for later use. PCR was conducted using a 10-μL reaction system: a 10% DNA sample, 10% SSR primer, 6% deoxyribonucleoside triphosphates (dNTP), and 10% 10 × Easy Taq buffer were combined, 5% Easy Taq enzyme was added under refrigeration, and ddH2O was finally added. The PCR amplification program was as follows: predenaturation was conducted at 95 °C for 5 min; after entering the cycle, denaturation was conducted at 94 °C for 30 s; annealing was conducted at 55 °C for 30 s; and extension was conducted at 72 °C for 30 s. After 35 cycles, the temperature was lowered to 72 °C, and the reaction continued for 5 min. The PCR products were detected using 8% nondenaturing polyacrylamide gel electrophoresis.
SSR primer polymorphism analysis
The electrophoresis results are marked as “AA, BB, CC, …” in descending order of molecular weight. The heterozygous bands are marked according to their corresponding positions (for example: AC), and the positions without bands are marked as "." [Citation31]. The marking results were sorted into the Popgene.32 input format (codominant marker date), the diploid data in each codominant was analysed and selected, and the analysis method was chosen (the number of alleles (Na), the effective number of alleles (Ne), Shannon’s information index (I), observed heterozygosity (Ho) or expected heterozygosity (He) [Citation32]. and the band matrix was transformed into a 01 matrix; that is, each allele was a locus, and each band was marked as 1. No band was recorded as 0, and PIC_CALC software was used to calculate the polymorphic information (PIC) of each primer [Citation33, Citation34]. According to the polymorphism of each primer, the species and the location on each chromosome, 43 pairs of universal gSSR primers were selected for the analysis of the genetic diversity and cluster analysis of interspecific and intraspecific adzuki beans, mung beans and common beans (Supplemental Table S5).
Table 5. Distributions of SSR sequences in various chromosomes of universal primers.
Analysis of genetic diversity between species and within species
Popgene32 software was used to calculate the genetic diversity of the tested adzuki bean, mung bean and common bean resources. Additional population cluster analysis and F-statistical analysis of the genetic diversity between species, namely, the population average inbreeding coefficient (Fis), genetic differentiation coefficient (Fst) and gene flow (Nm), were conducted [Citation35, Citation36].
Analysis of genetic structure of test resources
The electrophoresis results were marked as “1, 2, 3, …” according to the molecular weight in descending order, heterozygous sites were marked as 99, and no bands were marked as −9. The results were entered into the STRUCTURE software, the K value was set to 1–9, and the number of repetitions was set to 10 [Citation37–41]. The output results were uploaded to Structure Harves (http://taylor0.biology.ucla.edu/struct_harvest/) to obtain the best K value to ensure the best number of subgroups and the best output results [Citation41, Citation42]. The bionj function was used to perform a cluster analysis on the electrophoresis results based on the NJ algorithm, and iTol (https://itol.embl.de) was used to draw a cluster map [Citation43].
Results
Development of universal labels for adzuki bean, mung bean and common bean
gSSR loci in adzuki beans, mung beans and common beans
Based on the whole genome information of adzuki bean, mung bean and common bean, 61,430, 72,549 and 57,709 SSR loci were excavated, respectively (). The SSR sequences of adzuki bean, mung bean and common bean all have 5 repeat types. Among them, the dinucleotide repeat types are the most common, accounting for 69.51%, 71.34% and 67.86% of the total repeat types of adzuki bean, mung bean and common bean, respectively. The trinucleotide repeat types rank second, accounting for 26.92%, 24.64% and 28.94% of the total repeat types of adzuki bean, mung bean and common bean, respectively. In the whole genomes of adzuki bean, mung bean and common bean, the microsatellite loci with 6 repetitions are the most, which are 13,728, 12,097 and 12,369, respectively, accounting for 22.35%, 16.68% and 21.43%of the total number of microsatellite loci in adzuki bean, mung bean and common bean, respectively. The microsatellite loci with 10 repetitions were the fewest, accounting for 6.26%, 3.41% and 5.43% of adzuki bean, mung bean and common bean, respectively. After removing more than 10 repeats in the SSR site, among the dinucleotide repeat types of adzuki bean, mung bean and common bean, 6 repeats are the most common and 10 repeats are the least common.
There were four repeat motifs in the dinucleotide repeat types of SSR loci in the whole genome of adzuki beans (). These motifs were the AC/GT, AG/CT, AT/AT and CG/CG repeats, among which the number of AT/AT repeat motifs was the largest, accounting for 73.39% of the dinucleotide repeat types in the SSR loci of adzuki beans. The number of CG/CG repeat motifs was the smallest, accounting for 0.03% of the dinucleotide repeat types in the SSR loci of adzuki beans, and the numbers of the remaining two repeat motifs. There were 10 types of trinucleotide repeats at SSR loci in the whole genome of adzuki beans. Among them, the number of AAT/ATT repeats was the largest, accounting for 50.53% of the trinucleotide repeats in adzuki bean SSR loci. The number of ACG/CGT repeat motifs was the smallest, with 69 repeat motifs, accounting for 0.42% of the trinucleotide repeat types at SSR loci in the whole genome of adzuki beans.
There were four repetitive motifs () of the dinucleotide repeat type of SSR sites in the whole mung bean genome, among which the AT/AT repeats were the most common, accounting for 76.94% of the mung bean SSR dinucleotide repeat types, and CG/CG repeat motifs were the least common, accounting for 0.04% of the mung bean SSR dinucleotide repeat types. There were 10 repetitive motifs of the trinucleotide repeat type at SSR sites in the whole mung bean genome, among them, the AAT/ATT repeat motifs were the most common, accounting for 60.57% of trinucleotide repeat types in mung bean SSR sites. The number of ACG/CGT repeat motifs was the smallest, with 73 repeat motifs, accounting for 0.41% of the trinucleotide repeat types at SSR loci in the whole genome of mung beans.
There were four kinds of repeat motifs of the dinucleotide repeat type among the SSR loci in the whole common bean genome (): AC/GT, AG/CT, AT/AT, CG/CG, among which the number of AT/AT repeat motifs was the largest, accounting for 77.57% of the total number of dinucleotide repeat types in common bean SSR sites. The CG/CG repetitive motifs were the least common, accounting for 0.05% of the total number of dinucleotide repetitive types. There were 10 types of trinucleotide repeats of SSR sites in the common bean genome, among them, AAT/ATT repeat motifs were the most common, accounting for 67.10% of the total number of trinucleotide repeat types. The number of ACG/CGT repeat motifs was the smallest, with 44 repeat motifs, accounting for 0.26% of the trinucleotide repeat types at SSR loci in the whole genome of common beans.
Development of universal primers for adzuki beans, mung beans and common beans
A universal gSSR marker was developed based on the whole-genome SSR sites of adzuki beans, mung beans and common beans. The results are shown in . A total of 53,099 pairs of universal primers for adzuki beans, mung beans and common beans were screened. Among the universal primers, 24,400 pairs of primers were derived from adzuki beans, accounting for 45.95% of the total proportion of universal primers; 28,167 pairs of universal primers were derived from common beans, accounting for 53.05% of the total proportion of universal primers; and 532 pairs of universal primers were derived from mung beans, accounting for 1.00% of the total proportion of universal primers. The adzuki bean universal primers were distributed in the adzuki bean linkage group with a total of 24,123 pairs of primers. Among them, the first adzuki bean linkage group contained the most universal SSR primers, with 3037 pairs, and the sixth adzuki bean linkage group contained the fewest universal SSR primers, with 1488 pairs. The unplaced genomic scaffold contained 277 pairs of universal primers in the whole genome of adzuki beans. The universal primers derived from common beans were distributed in the common bean linkage group with a total of 28,084 pairs of primers. The third common bean linkage group contained the most universal SSR primers, with 3210 pairs of SSR loci, and the tenth common bean linkage group contained the fewest universal SSR primers, with 1938 pairs. The unplaced genomic scaffold in the whole common bean genome contained 83 pairs of universal primers. The universal primers derived from mung beans were distributed in the mung bean linkage group. There were only 11 pairs of gSSR primers. The first mung bean linkage group contained 3 pairs of universal SSR primers, and the second to ninth linkage groups each contained 1 pair of universal SSR primer. The Article 10 and Article 11 mung bean linkage groups did not contain any universal primers. The universal primers derived from mung bean were mainly distributed in the unplaced genomic scaffold of the whole mung bean genome, with a total of 521 pairs of universal primers.
Polymorphism analysis of universal gSSR primers
The 250 selected pairs of universal primers were analysed to determine their polymorphisms by PCR and PAGE (polyacrylamide gel electrophoresis) (Supplemental Table S6). A total of 71 pairs of primers out of the 250 total pairs of universal primers had good polymorphisms. A total of 252 alleles (Na) were detected in the tested universal SSR primers, and the alleles (Na) of the tested universal primers ranged from 2 to 6 with an average of 3.55. The effective alleles (Ne) of the universal primers tested ranged from 1.47 to 4.80, with an average of 2.84. The Shannon index (I) values of the tested universal primers varied widely, from 0.50 to 1.68, with an average of 1.09. The observed heterozygosity (Ho) and expected heterozygosity (He) values of the tested universal primers ranged from 0.17 to 0.66 and from 0.34 to 0.83, respectively. The average observed heterozygosity (Ho) and expected heterozygosity (He) values were 0.36 and 0.64, respectively. Among 71 universal SSR primers with polymorphisms, the observed heterozygosity (Ho) values of 12 SSR primers were greater than their expected heterozygosity (He) values, indicating that a small number of polymorphic SSR primers have heterozygosity deletion phenomena. The average Nei’s genetic diversity index (H) and polymorphic information content (PIC) values of the tested universal primers were 0.61 and 0.56, respectively, indicating that 71 pairs of universal SSR primers with polymorphisms have high genetic diversities. Among the 71 pairs of primers with polymorphisms, 43 pairs of primers with the best polymorphisms were selected for the genetic diversity analysis of the test resources.
Table 6. Genetic consistency and genetic distance.
Analysis of genetic diversity based on SSR markers
Genetic diversity analysis of adzuki bean, mung bean and common bean
Using 43 pairs of SSR marker loci to analyse the genetic diversity of the tested adzuki bean, mung bean and common bean resources, it can be seen from Supplemental Table S7 that in 43 pairs of SSR primers, 134, 139, and 165 alleles (Na) were detected in the tested adzuki bean, mung bean and common bean resources, respectively. The sizes of the tested adzuki bean, mung bean and common bean resource alleles (Na) ranged from 1–6, 1–7, 1–9, respectively, and the average alleles (Na) of the tested adzuki bean, mung bean, and common bean resources were 3.12, 3.23, 3.84, respectively. The numbers of effective alleles (Ne) of the tested adzuki bean resources ranged from 1.00 to 3.65, the numbers of effective alleles (Ne) of the tested mung bean resources ranged from 1.00 to 4.17, and numbers of the effective alleles (Ne) of the tested common bean resources ranged from 1.00 to 4.76. The average effective allele (Ne) values of the tested adzuki bean, mung bean and common bean resources were 2.25, 2.19 and 2.59, respectively, The Shannon’s index (I) values for the tested adzuki bean resources ranged from 0 to 1.48, the Shannon’s index (I) values for the tested mung bean resources ranged from 0 to 1.51, and the Shannon’s index (I) values for the tested common bean resources ranged from 0 to 1.65. The average Shannon’s index (I) values of the adzuki bean, mung bean and common bean resources were 0.83, 0.81 and 1.00, respectively, indicating that the community heterogeneity of the common bean germplasm resources was the largest among the tested adzuki bean, mung bean and common bean germplasm resources, and the community heterogeneity of the mung bean resources was the smallest. The observed heterozygosity (Ho) values of the tested adzuki bean resources ranged from 0.26 to 1, and the expected heterozygosity (He) values of the tested adzuki bean resources ranged from 0 to 0.74; the observed heterozygosity (Ho) values of the tested mung bean resources ranged from 0.23 to 1, and the expected heterozygosity (He) values of the tested mung bean resources ranged from 0 to 0.77. The observed heterozygosity (Ho) values of the tested common bean resources ranged from 0.21 to 1, and the expected heterozygosity (He) values of the tested common bean resources ranged from 0 to 0.79. The average observed heterozygosity (Ho) values of the tested adzuki bean, mung bean and common bean resources were 0.51, 0.53 and 0.42, respectively, and the expected heterozygosity (He) values of the tested adzuki bean, mung bean and common bean resources were 0.49, 0.47 and 0.58, respectively. Sixteen SSR sites of the tested adzuki bean resource had Ho values greater than the corresponding He values, 20 of the tested mung bean resource sites had Ho values greater than the corresponding He values, and 10 SSR sites of the tested common bean resource had Ho values greater than the corresponding He values. The results showed absence of heterozygotes in most of the SSR loci of adzuki bean, mung bean and common bean germplasm resources. The average Nei’s genetic diversity index (H) values of the tested adzuki bean, mung bean, and common bean resources were 0.48, 0.46 and 0.57, respectively, indicating that the genetic diversity of the tested common bean germplasm resources was the largest, the genetic diversity of the tested adzuki bean germplasm resources was the second-largest, and the genetic diversity of the tested mung bean germplasm resources was the smallest.
Intraspecific genetic structure analysis and cluster analysis of adzuki beans, mung beans and common beans
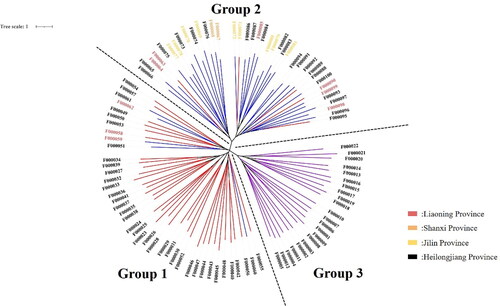
STRUCTURE software was used to analyse the genetic structure of a population of 100 adzuki bean germplasm resources, and the results were obtained according to Structure Harvester. From , it can be seen that when ΔK = 3, the peak value is reached; that is, the genetic relationships of the analysed adzuki bean resources can be divided into 3 subgroups (). The compositions of germplasm resources in the three groups are shown in Supplemental Table S8. Group I, Group II and Group III contained 22, 38 and 21 adzuki bean germplasm resources, respectively. Based on the NJ algorithm, the tested adzuki bean resources were clustered to further explore the germplasm resource structure of adzuki bean resources at the optimal K value. As shown in , the adzuki bean germplasm resources can be divided into 3 groups: group 1 mainly corresponds to the third group of adzuki bean resources obtained in the STRUCTURE analysis results, group 2 mainly corresponds to the second group of adzuki bean resources obtained in the STRUCTURE analysis results, and group 3 mainly corresponds to the first group of adzuki bean resources obtained in the STRUCTURE analysis results. Based on the NJ cluster diagram, the three adzuki bean germplasm resource groups can be subdivided into two sister subgroups. Among the adzuki bean germplasm resources, the germplasm resources from Heilongjiang are evenly distributed in 3 groups, while the adzuki bean resources from Liaoning, Shanxi and Jilin provinces are mainly concentrated in group 2. The results of the genetic structure analysis were basically consistent with the NJ clustering results.
Figure 1. Classification of adzuki bean population genetic structure ΔK.
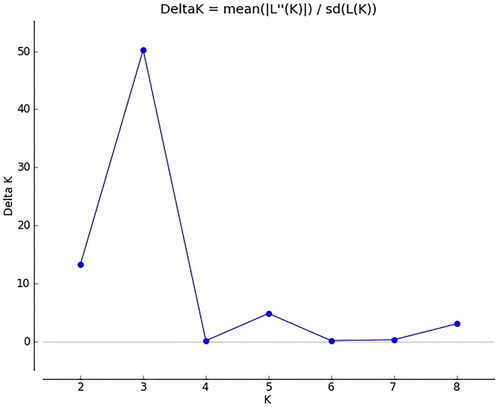
Figure 2. Division of the genetic structure of the adzuki bean population.
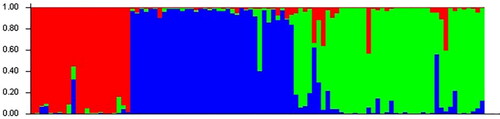
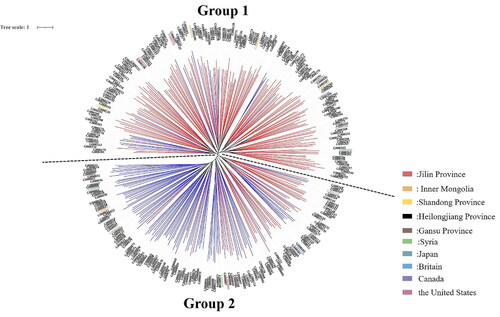
Figure 3. Adzuki bean system tree diagram based on the NJ algorithm. Based on the NJ algorithm, the clustering results can be divided into three groups according to the dotted line. The bean resources marked in red in the figure correspond to Group III in Supplemental Table S8; the bean resources marked in blue correspond to Group II in Supplemental Table S8; and the bean resources marked in purple correspond to Group I in Supplemental Table S8.
STRUCTURE software was used to analyse the genetic structure of a population of 118 mung bean germplasm resources. According to the results obtained by the Structure Harvester, shown in , the peak value is reached when ΔK = 3; that is, the analysed genetic relationships of mung bean resources can be divided into 3 subgroups (). The compositions of the germplasm resources in the three groups are shown in Supplemental Table S9. Group I, Group II and Group III contained 22, 38 and 58 mung bean germplasm resources, respectively (Supplemental Table S9). Based on the NJ algorithm, the tested mung bean resources were clustered to further explore the germplasm resource structure of mung bean resources at the optimal K value. shows that mung bean germplasm resources can be divided into 3 groups. Group 1 mainly corresponds to Group II of the mung bean resources obtained in the STRUCTURE analysis results, Group 2 mainly corresponds to Group III of the mung bean resources in the STRUCTURE analysis results, and Group 3 mainly corresponds to Group I of the mung bean resources obtained in the STRUCTURE analysis results. Based on the NJ cluster diagram, Group 2 can be further divided into two sister subgroups, and Group 3 can be further divided into 3 sister subgroups. Among the mung bean germplasm resources, the germplasm resources from Heilongjiang are evenly distributed in 3 groups, while the mung bean germplasm resources from Liaoning Province, Xinjiang, Jilin Province and other places are distributed in group1 and group2. The results of the genetic structure analysis were basically consistent with the NJ clustering results.
Figure 4. Classification of Mung bean population genetic structure ΔK.
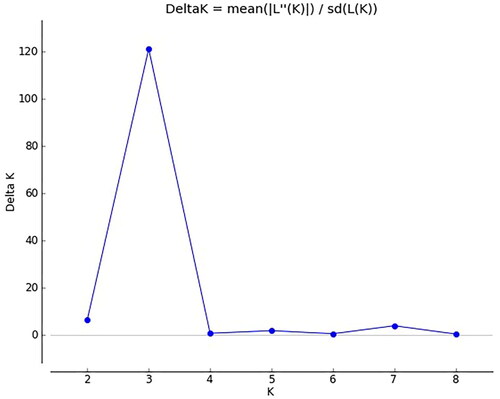
Figure 5. Division of the genetic structure of the Mung bean population.
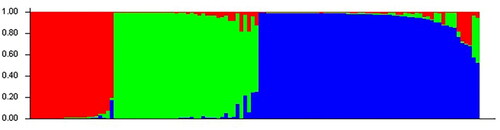
Figure 6. Mung bean system tree diagram based on the NJ algorithm. The clustering results obtained based on the NJ algorithm can be used to divide the tested mung bean resources into three groups, as shown with the dotted line. Mung bean resources marked in red correspond to group II in Supplemental Table S9; mung bean resources marked in blue correspond to group I in Table S9; and mung bean resources marked in purple correspond to group III in Supplemental Table S9.
As shown in , when using STRUCTURE software to analyse the genetic structure of a population of 303 common bean germplasm resources, the peak value is reached when ΔK = 2; that is, the genetic relationships of the analysed common bean resources can be divided into 2 groups (). The compositions of the germplasm resources in the two groups are shown in Supplemental Table S10. Group I and Group II contained 179 and 122 tested common bean germplasm resources, respectively (Supplemental Table S10). Based on the NJ algorithm, the tested common bean resources were clustered to further explore the germplasm resource structures of the common bean resources at the optimal K value. As shown in , the common bean germplasm resources can be divided into 2 groups. Group 1 mainly corresponds to Group I of the common bean resources obtained in the STRUCTURE analysis results, and Group 2 mainly corresponds to Group II of the common bean resources obtained in the STRUCTURE analysis results. Based on the NJ cluster diagram, Group 1 and Group 2 can be further divided into two sister subgroups. Among common bean germplasm resources, the germplasm resources from Heilongjiang are evenly distributed in two groups; the germplasm resources from the United States, Canada and Britain are distributed in group 1, and the two germplasm resources from Japan are distributed in group 2. The results of the genetic structure analysis were basically consistent with the NJ clustering results.
Figure 7. Classification of common bean population genetic structure ΔK.
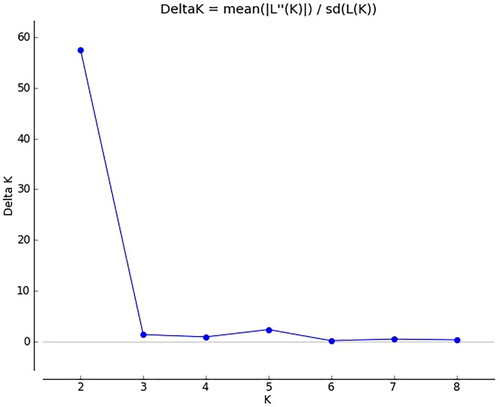
Figure 8. Division of the genetic structure of the common bean population.
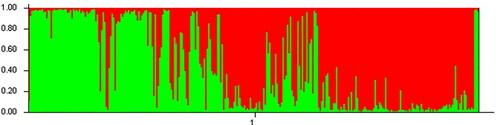
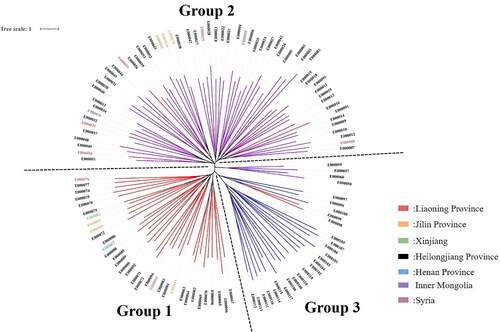
Figure 9. Common bean system tree diagram based on the NJ algorithm. The clustering results obtained based on the NJ algorithm can be used to divide the tested common bean resources into two groups, as shown on the dotted line. The bean resources marked in red in the figure correspond to Group I in Supplemental Table S10; the bean resources marked in blue correspond to Group II in Table S10.
Analysis of genetic diversity among the adzuki bean, mung bean and common bean species
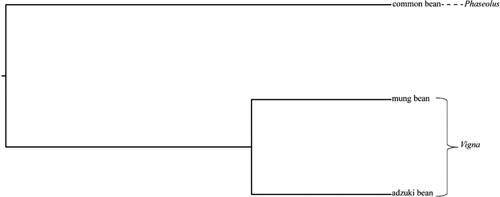
Supplemental Table S11 shows that for the three resource populations of the tested adzuki bean, mung bean and common bean resources obtained based on the analysis of 43 pairs of universal SSR loci, the inbreeding coefficient (Fis) values range from 0.70 to 1, and there are 10 inbreeding coefficients of the SSR markers (Fis) below 1, indicating that the 3 resource populations of adzuki beans, mung beans and common beans are heterozygous in these 10 SSR markers and that the degree of gene purification is low. The average inbreeding coefficient (Fis) was 0.97, indicating that the tested adzuki bean, mung bean and common bean resources had high degrees of gene purification at 43 SSR loci. The coefficient of genetic differentiation (Fst) ranged from 0.02 to 0.86, and the average coefficient of genetic differentiation was 0.24, which indicates that the genetic variation (75.70%) within the three resource populations was significantly higher than the genetic variation among species (24.30%). The gene flow(Nm*) of the three populations varied from 0.04 (CC-2-16793101) to 15.83 (CC-7-98733968), with an average value of 0.78, indicating that intraspecific flow of the adzuki bean, mung bean and common bean genes was more frequent than interspecific flow. Based on the use of self-developed SSR primers to analyse the genetic identities and genetic distances of the tested adzuki bean, mung bean and common bean resources (), the obtained genetic distance between adzuki beans, mung beans and common beans ranged from 0.27 to 0.90, among which the genetic distance between adzuki beans and mung beans was the closest and the genetic distance between adzuki beans and common beans was the farthest. The genetic identities between adzuki beans, mung beans and common beans ranged from 0.41 to 0.76. The genetic identity between adzuki beans and mung beans was the lowest, and the genetic identity between adzuki beans and common beans was the largest. This result agrees with the size relationships of the genetic distances among the three species populations of adzuki beans, mung beans and common beans. Interspecies cluster analysis was performed on the tested adzuki bean, mung bean and common bean resources (). The adzuki bean resources and the mung bean resources could be placed into one group, and the common bean resources could be placed into another group, conforming to the fact that both adzuki beans and mung beans belong to the genus Vigna. Common beans belong to the genus Phaseolus, which is also in line with the genetic consistency results and genetic distance analysis of the tested resources.
Figure 10. Cluster analysis of test resources.
Discussion
To more accurately evaluate the genetic diversity of adzuki bean, mung bean and common bean germplasm resources, this experiment used SSR markers to analyse the test resources [Citation6]. The average Nei’s genetic diversity index (H) values of the tested adzuki bean, mung bean and common bean resources were 0.48, 0.46 and 0.57, respectively, indicating that the genetic diversity of the tested common bean germplasm resources was the largest, that of the tested adzuki bean germplasm resources was the second-largest, and the one of the tested mung bean germplasm resources was the smallest. The most possible reasons for the obtained genetic diversity of the tested common bean germplasm resources are as follows. In this experiment, the various common bean resources collected had obvious differences in phenotypic traits such as grain colour, flower colour, pod colour and growth habit, so their genetic diversity index values showed the largest value, while the test resources of adzuki beans and mung beans had smaller differences in their phenotypic traits, so their genetic diversity index values were smaller. The genetic variation among adzuki bean, mung bean and common bean species was 24.30%, and the gene flow was 0.78. This shows that in the ancestors of adzuki bean, mung bean and common bean, the gene exchange within species was more frequent than that between species. and the gene exchange among the three species has reached the level of 0.78. From the perspective of the genetic identities and genetic distances among the three species, the genetic distance between adzuki beans and mung beans was the smallest, and the genetic identity was the largest. The genetic distance between adzuki beans and common beans was the farthest, and the degree of genetic agreement was the smallest. A possible explanation could be that among the ancestors, the gene exchanges between adzuki beans and mung beans ancestors were more frequent, followed by those between mung beans and common beans ancestors and those between adzuki beans and common beans ancestors, whose interaction was the least frequent. This result is consistent with the basic knowledge that adzuki beans and mung beans belong to the genus Vigna, while common beans belong to the genus Phaseolus. Therefore, when analyzing the species evolution, adzuki beans and mung beans are more likely to evolve similar shapes. When considering distant hybridization, it is easier to choose adzuki bean and mung bean varieties with high combination abilities.
We determined the most appropriate number of subgroups of ΔK based on the method proposed by Evanno et al. [Citation41]. It is a common method to explore the optimal K value of test resources through Structure software and Structure Harvester [Citation41, Citation42]. From and , it can be seen that the tested adzuki bean and mung bean germplasm resources reached the most reasonable number of subgroups when ΔK = 3, and showed that the tested common bean germplasm resources reached the most reasonable number of subgroups when ΔK = 2. The optimal number of subgroups of the tested adzuki bean, mung bean and common bean germplasm resources and the composition of the germplasm resources in each subgroup are shown in Supplemental Tables S8, S9 and S10. On the basis of the existing data, the NJ algorithm was used to verify the structure of the tested adzuki bean, mung bean and common bean germplasm resources (, Citation6, Citation9), and the results showed that the structure genetic structure analysis was basically consistent with the results of NJ clustering. It shows that cluster analysis of germplasm resources by STRUCTURE software and NJ algorithm is more reasonable. The tested common bean resources could be divided into 3 groups. At the same time, the Nei’s genetic diversity index values of the tested common bean resources were also the largest, while the Nei’s genetic diversity index values of the tested adzuki beans and mung bean resources were similar. The tested adzuki bean and mung bean resources were equally divided into 2 taxa. This shows that the tested common bean germplasm resources have the highest abundance and produce more variation than the tested adzuki bean or mung bean resources, so their genetic structure is more complicated, while the tested adzuki bean and mung bean germplasm resources are less rich and produce less variation, so their genetic structures are relatively simple. Xu et al. [Citation6] divided the Asian adzuki bean germplasm resources into 5 groups by AFLP marker analysis, and Jin et al. [Citation7] divided 99 adzuki bean germplasm resources into 5 subgroups by RAPD analysis. In this experiment, 100 adzuki bean resources were divided into 3 groups by using SSR universal primers. According to the research results of Noble et al. [Citation8] and Bangar et al. [Citation9], mung bean germplasm resources are divided into 4 groups. In this paper, mung bean germplasm resources are also divided into 3 groups. And the PIC value in this study is slightly lower than previous research results. It shows that for a long time, only a few groups of adzuki bean and mung bean germplasm resources may have been introduced into China. Chen et al. [Citation15] conducted a genetic diversity analysis of 131 common bean germplasm resources in 2014 and found that most of the common bean germplasm resources in China came from the Central American Domestication Center. In this experiment, 303 common bean germplasm resources were evenly distributed among the two subgroups, which indicated that common bean germplasm resources from the Andean domestication Center had been introduced into China in recent years.
In recent years, a greater number of universal markers have been developed and used for microorganisms and animals [Citation44–48]. Universal primers are mainly used for agricultural product detections, epidemic symptom predictions and DNA barcode constructions [Citation47, Citation49, Citation50]. The use of universal primers mainly involves the following advantages. First, sets of primer labels can be used for different species, which is convenient. Second, universal primers can detect the same marker sites in different species and can be used to conveniently analyse the genetic relationships and genetic evolution between species. Adzuki beans, mung beans and common beans are all species of the Papilionoideae. Although they belong to different genera, the relationships among the three species are still relatively close, and the number of chromosomes is 2n = 2x = 22. This relation provides a theoretical basis for the development of universal primers for adzuki beans, mung beans and common beans. Based on the whole genome information of adzuki beans, mung beans and common beans, a total of 53,099 pairs of universal primers for adzuki beans, mung beans and common beans were developed in this experiment. Among them, the primers extracted from common beans were the most abundant, and those extracted from mung beans were the least abundant. Combined with previous research, only 42% of the SSR primers developed in common beans can be effectively amplified in mung beans, while the adzuki beans have 65% of the markers. It can be effectively amplified in mung bean, which shows that the upstream and downstream sequences of mung bean SSR sites are quite different from those of adzuki bean and common bean. Therefore, when extracting universal primers, mung bean provides the least SSR primers [Citation19].
Conclusions
In the whole genomes of adzuki beans, mung beans and common beans, 61,430, 72,549 and 57,709 SSR loci were mined, respectively. Based on the gSSR loci of adzuki beans, mung beans and common beans, a total of 53,099 pairs of universal SSR primers were screened. The highest number of primers were obtained from common beans and the fewest, from mung beans. The polymorphism of the tested universal primers was good. The genetic diversity of the tested common bean germplasm resources was the largest, followed by that of the tested adzuki bean germplasm resources; the genetic diversity of the tested mung bean germplasm resources was the smallest. According to the genetic relationships, the tested adzuki beans, mung beans and common beans could be divided into 3 subgroups, 3 subgroups and 2 subgroups, respectively. It shows that only a few groups of adzuki bean and mung bean germplasm resources may have been introduced into China. In recent years, the common bean germplasm resources of the Andean domestication Center have been introduced into China. Among the 43 universal SSR loci of the tested adzuki bean, mung bean and common bean germplasm resources, the inbreeding coefficient of 10 SSR markers was less than 1, indicating that the 10 SSR markers were heterozygous at the interspecific level. The average genetic differentiation coefficient of the tested resources was 0.24, and the average gene flow value was 0.78. The genetic distances between the three species ranged from 0.27 to 0.90. The genetic distance between the tested adzuki bean germplasm resources and the tested mung bean germplasm resources was the closest, and the genetic difference between the tested adzuki bean germplasm resources and the tested common bean species was the farthest.
Author contributions
Y.Z., X.-X.W. and Q.-S.C. conceived the study and designed and managed the experiments. R.-N.Z.,S-.Q.Y.,B.Z. provided the plant germplasm resources. R.-N.Z., P.C., Y. -Q. B., S.-N.L., Z.-G.Y. performed the trials and collected the data. R.-N.Z.,B.-S.Z.,Y.-J.Z. analysed the data and interpreted the results. R.-N.Z., D.-W.X., Z.-M.Q. prepared the manuscript. All authors agreed to be accountable for all aspects of the work in ensuring that questions related to the accuracy or integrity of any part of the work are appropriately investigated and resolved and approved the final version to be published.
Funding
This study was financially supported by Heilongjiang provincial system for collaborative and innovative promotion of miscellaneous grain industry technology and National Natural Science Foundation of China Grant (31971899).
Declaration of competing interest
None
Supplemental Material
Download PDF (403.1 KB)Data availability statement
The data that support the findings of this study are openly available in Figshare at 10.6084/m9.figshare.14904822.
Supplemental data: Table S1. Local adzuki bean germplasm resources; Table S2. Local mung bean germplasm resources; Table S3. Local common bean germplasm resources; Table S4. List of 250 primer pairs selected based on universal primers; Table S5. List of 43 SSR primers for resource identification; Table S6. Polymorphism analysis of universal SSR primers, Table S7. Analysis of genetic diversity of test resources; Table S8. Structure analysis of adzuki bean resources; Table S9. Structure analysis of mung bean resources; Table S10. Structure analysis of common bean resources; Table S11. Summary of F statistics and gene flow for the SSR locus.
References
- Smýkal P, J CC, J AM, et al. Legume crops phylogeny and genetic diversity for science and breeding. Crit Rev Plant Sci. 2015;34(1–3):43–104.
- Nacira M, Ailin I, Leo K, et al. Potential uses of wild germplasms of grain legumes for crop improvement. IJMS. 2017;18(2):328.
- Foyer CH, Lam HM, Nguyen HT, et al. Neglecting legumes has compromised human health and sustainable food production. Nat Plants. 2016; 2:16112.
- Rong L, Chen HF, Yang ZL, et al. Research status of soybean symbiosis nitrogen fixation. Oil Crop Science. 2020; 5:6–10.
- Wang LX, Wang J, Cheng XZ. Adzuki bean (vigna angularis (willd.) ohwi & ohashi) breeding. In: Advances in plant breeding strategies: Legumes: Volume 7. Springer International Publishing: Cham, 2019. pp. 1–23.
- Xu XZ, Akito K, Norihiko T, et al. The genetic diversity of the Vigna angularis complex in Asia. Genome. 2003; 46:647–658.
- Jin WL, Wen ZX, Pu SJ, et al. Genetic diversity of adzuki bean germplasm resources based on RAPD markers. Zuo Wu Xue Bao. 2004; 30:686–691.
- Noble TJ, Tao YF, Mace ES, et al. Characterization of linkage disequilibrium and population structure in a mungbean diversity panel. Front Plant Sci. 2017; 8:2102.
- Bangar P, Chaudhury A, Umdale S, et al. Detection and characterization of polymorphic simple sequence repeats markers for the analysis of genetic diversity in indian mungbean [vigna radiata (L.) wilczek]. Ind J Gen Plnt Bree. 2017;78(1):111–117.
- Kaur G, Joshi A, Jain D. SSR-marker assisted evaluation of genetic diversity in mung bean (Vigna radiata) genotypes. Braz Arch Biol Technol. 2018;61(0):e180613.
- Gepts P. A Middle american and an andean common bean gene Pool. Springer Netherlands. 1988. 375–390.
- Gepts P, Debouck DG. Origin, domestication, and evolution of the common bean (Phaseolus vulgaris L.). In: van Schoonhoven A, Voysest O., editors. Common beans: research for crop improvement. Commonwealth Agricultural Bureaux International, Wallingford, United Kingdom; 1991. p. 7–53.
- Schmutz J, McClean PE, Mamidi S, et al. A reference genome for common bean and genome-wide analysis of dual domestications. Nat Genet. 2014; 46(7):707–713.
- Gepts P, Osborn TC, Rashka K, et al. Phaseolin-protein variability in wild forms and landraces of the common bean (Phaseolus vulgaris): evidence for multiple centers of domestication. Econ Bot. 1986;40(4):451–468.
- Chen ML, Wu J, Wang LF, et al. Development of mapped simple sequence repeat markers from common bean (Phaseolus vulgaris L.) based on genome sequences of a Chinese landrace and diversity evaluation. Mol Breeding. 2014; 33(2):489–496.
- Decroocq V, Favé MG, Hagen L, et al. Development and transferability of apricot and grape Est microsatellite markers across taxa. Theor Appl Genet. 2003; 106(5):912–922.
- Varshney RK, Sigmund R, Börner A, et al. Interspecific transferability and comparative mapping of barley Est-SSR markers in wheat, rye and rice. Plant Sci. 2005; 168(1):195–202.
- Li H, Handsaker B, Wysoker A, et al. The Sequence Alignment/Map format and SAMtools. Bioinformatics. 2009;25(16):2078–2079.
- Zhao D, Cheng XZ, Wang LX, et al. Construction of mungbean genetic linkage map. Acta Agron Sin. 2010; 36(6):932–939.
- Xu RQ, Tomooka N, Vaughan DA, et al. The vigna angularis complex: Genetic variation and relationships revealed by RAPD analysis, and their implications for in situ conservation and domestication. Genet Resour Crop Evol. 2000;47(2):123–134.
- Chen HL, Liu LP, Wang LX, et al. Development of SSR markers and assessment of genetic diversity of adzuki bean in the chinese germplasm collection. Mol Breeding. 2015;35(10):191.
- Chen HL, Wang LX, Wang SL, et al. Transcriptome sequencing of mung bean (Vigna radiate L.) genes and the identification of Est-SSR markers. Plos One. 2015; 10(4):e0120273.
- Gill-Langarica HR, Muruaga-Martínez JS, Vargas-Vázquez MLP, et al. Genetic diversity analysis of common beans based on molecular markers. Genet Mol Biol. 2011; 34(4):595–605.
- Kang YJ, Satyawan D, Shim S, et al. Draft genome sequence of adzuki bean, Vigna angularis. Sci Rep. 2015; 5:8069.
- Kang YJ, Kim SK, Kim MY, et al. Genome sequence of mungbean and insights into evolution within vigna species. Nat Commun. 2014; 5:5443.
- Vlasova A, Capella-Gutiérrez S, Rendón-Anaya M, et al. Genome and transcriptome analysis of the mesoamerican common bean and the role of gene duplications in establishing tissue and temporal specialization of genes. Genome Biol. 2016; 17(1):32.
- Li H, Handsaker B, Wysoker A, et al. The sequence alignment/map format and SAMtools. Bioinformatics. 2009; 25(16):2078–2079.
- Untergasser A, Cutcutache I, Koressaar T, et al. Primer3-new capabilities and interfaces. Nucleic Acids Res. 2012;40(15):e115.
- Koressaar T, Remm M. Enhancements and modifications of primer design program Primer3. Bioinformatics. 2007; 23(10):1289–1291.
- Page M, MacLean D, Schudoma C. Blastjs: a BLAST + wrapper for node.js. BMC Res Notes. 2016; 9(1):1–4.
- Yeh FC, Yang RC, Boyle T. POPGENE, version 1.32. microsoft window-based Freeware for population genetic analysis. University of Alberta. Edmonton; 1999.
- Raza A, Mehmood SS, Ashraf F, et al. Genetic diversity analysis of brassica species using PCR-based SSR markers. Gesunde Pflanzen. 2019; 71(1):1–7.
- Zhang J, Waryani B, Zhou QH. Isolation and characterization of microsatellite loci from an ice fish, neosalanx tangkahkeii (osmeriformes, salangidae). PJZ. 2019; 51(5):1853.
- Oduoye OT, Oluwasanya OA, Arikawe OO, et al. Genetic variation via SSR polymorphic information content and ecological distribution of nigerian sesame. African J Biotechnol. 2020; 19(4):165–170.
- Yang W, Dan Y, Xin ZL. Genetic diversity of toona ciliata populations based on SSR markers. J Resour Ecol. 2020; 11(5):466–474.
- Daghighi S, Alizadeh Z, Habibi H. Determination of chromosome number and genetic diversity using SSR and RAPD markers in ziziphus jujuba mill. Iran J Sci Technol Trans Sci. 2021;45(1):77–89.
- Gu XZ, Cao YC, Zhang ZH, et al. Genetic diversity and population structure analysis of capsicum germplasm accessions. J Integr Agricult. 2019; 18(6):1312–1320.
- Pritchard JK, Stephens M, Donnelly P. Inference of population structure using multilocus genotype data. Genetics. 2000; 155(2):945–959.
- Gopalan P, Hao W, Blei DM, et al. Scaling probabilistic models of genetic variation to millions of humans. Nat Genet. 2016;48(12):1587–1590.
- Dennis JRDR, Nico K, Tom VDS, et al. Dispersal limitation of the mangrove avicennia marina at its South african range limit in strong contrast to connectivity in its core east african region. Mar Ecol Prog Ser. 2016; 545:123–134.
- Evanno G, Regnaut S, Goudet J. Detecting the number of clusters of individuals using the software STRUCTURE: a simulation study. Mol Ecol. 2005; 14(8):2611–2620.
- Jakobsson M, Rosenberg NA. CLUMPP: a cluster matching and permutation program for dealing with label switching and multimodality in analysis of population structure. Bioinformatics. 2007; 23(14):1801–1806.
- Letunic I, Bork P. Interactive tree of life (iTOL) v4: recent updates and new developments. Nucleic Acids Res. 2019;47(W1):W256–W259.
- Scaramozzino N, Crance J, Jouan A, et al. Comparison of flavivirus universal primer pairs and development of a rapid, highly sensitive heminested reverse transcription-PCR assay for detection of flaviviruses targeted to a conserved region of the NS5 gene sequences. J Clin Microbiol. 2001; 39(5):1922–1927.
- Elbrecht V, Leese F. Validation and development of COI metabarcoding primers for freshwater macroinvertebrate bioassessment. Front Environ Sci. 2017; 5:11.
- Hu H, Jung K, Wang QH, et al. Development of a one-step RT-PCR assay for detection of pancoronaviruses (α-, β-, γ-, and δ-coronaviruses) using newly designed degenerate primers for porcine and avian ‘fecal samples. J Virol Methods. 2018; 256:116–122.
- Ivanova NV, Zemlak TS, Hanner RH, et al. Universal primer cocktails for fish DNA barcoding. Food Chem. 2007; 7(4):544–548.
- Meiyu F, Huosheng C, Cuihua C, et al. Detection of flaviviruses by reverse transcriptase-polymerase chain reaction with the universal primer set. Microbiol Immunol. 1997; 41(3):209–213.
- Yang J, Vázquez L, Chen XD, et al. Development of chloroplast and nuclear DNA markers for chinese oaks (quercus subgenus quercus) and assessment of their utility as DNA barcodes. Front Plant Sci. 2017; 8:816.
- Xue CB, Wang PY, Zhao J, et al. Development and validation of a universal primer pair for the simultaneous detection of eight animal species. Food Chem. 2017; 221:790–796.