
ABSTRACT
Potassium transporter genes are essential for plant salt stress tolerance. Identification of gene regulatory elements is vital for the recognition of gene expression patterns. Thus, understanding gene regulatory systems of potassium transporter genes is useful to improve the salt tolerance of crop plants. The present study was aimed at in silico analysis of promoter and regulatory elements of potassium transporter genes in coffee, peanut, soybean, maize, sorghum and potato crops. A total of 19 potassium transporter genes were identified, and the transcription start site (TSS), conserved motif, CpG islands were analysed using various computational tools. The highest promoter prediction score (1) was obtained in one gene sequence (LOC113728271) for Coffea arabica transcription start site, whereas the lowest score (0.8) was recorded in one gene sequence (LOC8065633) for Sorghum bicolor transcription start site. The analysis also showed that 66% of the genes contained more than one transcription start site whereas 63.16% had only one transcription start site. Five motifs were identified. Motif 1 was found as the common promoter motif residing on 78.95% of potassium transporter promoter sequences with an E-value of 3.4e − 002.C2H2 zinc finger transcription factors are predicted to bind to these conserved motifs with high statistical probability (2.28e − 03). Very few CpG islands were observed both in the promoter and body region of the gene sequences using two algorithms. The present study could contribute for better understanding of gene expression and the improvement of crops’ tolerance to environmental stresses through molecular assisted breeding or genetic engineering techniques.
Introduction
Potassium (K+) is one of the most significant macronutrients for plant health and it contributes up to 0.8%–8% of plant dry weight [Citation1]. It is involved in plant growth and development and determines the yield and quality of crop production. Potassium is associated with enzyme activation, opening and closing of the stomata and exchange of water vapor, oxygen and carbon dioxide [Citation2, Citation3]. Therefore, it helps plants in resisting salinity, drought and diseases. Moreover, in the phloem, K+ is critical for the transport of photoassimilates from source to sink [Citation4]. Most of these functions depend on the activities and regulation of membrane-bound K+ transport proteins, working over a large range of K+ concentrations [Citation5].
Potassium is absorbed by plant roots and translocated into plants through several K+ channels and transporters [Citation6, Citation7]. K+ transport systems are proteins controlled by a large family of genes that are expressed in almost all plant tissues. As plants require significant amounts of K+, there is a large number of K+ transport systems to allow its uptake from the complex soil environments and its redistribution to plant tissues [Citation3]. These transporter genes have been clustered into four main gene families in plants: the KT/HAK/KUP family, Trk/HKT family, KEA (K+ efflux antiporter) family, and CHX (cation/hydrogen exchanger) family [Citation8, Citation9]. Transporters of the HKT family are few in plants. For instance, there is only one HKT gene in Arabidopsis thaliana [Citation10] and probably two genes in Oryza sativa [Citation11] and Eucalyptus spp [Citation12]. In contrast, the HAK transporter family also referred to as the KT or KUP transporter family is the largest gene family found in plants [Citation13]. Members of this family are expressed virtually in all plant tissues that have been investigated in a wide variety of species [Citation14].
Several previous investigations discovered that numerous plant HAK/KUP/KT families reveal diversity in terms of expression patterns in different tissues and cell types and response to specific signals [Citation2]. As an example, under normal K+ conditions, the AtHAK5 transcripts were detected in roots, however not in shoots but under K+ deficiency conditions, the AtHAK5 transcript was present in both roots and shoots, though in roots the degrees of expression were higher [Citation15]. Similarly, the qRT-PCR (qualitative real-time polymerase chain reaction) analysis showed that the expression levels of TaHAK genes in wheat seedlings were considerably up-or down-regulated once seedlings were exposed to K+ deficiency, high salinity or dehydration [Citation16].
The study of gene expression regulation is an important step in understanding the molecular mechanisms of plant stress response and gene function. Gene expression is usually controlled by the gene promoter sequence. The promoter is a non-coding DNA segment that is composed of multiple motifs or cis-acting regulatory elements (CAREs) and CpG Island that take part in the regulation of gene expression [Citation17, Citation18]. A promoter is usually located upstream from the transcription start site (TSS) and is responsible for the initiation of transcription. CAREs are short conserved motifs (5 to 20 nucleotides) which are specific binding sites for proteins such as transcription factors (TFs). TFs bind to the promoter region on a particular motif and orchestrate the initiation of transcription, promote or block the recruitment of the RNA polymerase II (Pol II) complex. CpG islands (CGIs) are clusters of CpG dinucleotides in GC-rich regions, often located on the 5′ end of genes. Methylation of promoter-associated CGIs plays an important role in the regulation of tissue-specific genes [Citation19].
Accurate prediction of promoter regions and identification of regulatory elements are useful in improving genome annotation and elucidating the regulation and expression pattern of genes and may even produce valuable information about the function and signalling of novel and uncharacterized genes [Citation20]. Modern molecular techniques such as RNA interference, microarrays, RNAseq and others have permitted prediction and analysis of promoter regions of target genes but these techniques are costly and technically difficult. In recent times, plenty of computational tools are available to search the promoter regions for different regulatory elements responsible for gene regulation [Citation21, Citation22]. Despite many recent efforts, the in silico identification of promoter regions is still in its infancy compared to gene prediction. Therefore, the present study was aimed to predict the promotor region, conserved motifs and CpG islands for potassium transporter genes in some selected crop plants.
Materials and methods
Gene search
The sequences of three maize, four potato, four sorghum, two peanut, three soybean and three coffee potassium transporter encoding genes were retrieved from the National Center for Biotechnology Information, NCBI (http://www.ncbi.nlm.nih.gov) nucleotide database. For these crops, the pseudogenes were excluded, only genes with full-length sequences (with a start codon) were collected in FASTA format. As a result, an inconsistent number of genes per crop were considered in the study. Information about the chromosomal location, DNA length (bp), exon number, open reading frame (ORF) number and source organisms was obtained for each gene from NCBI, GeneBank (http://www.ncbi.nlm.nih.gov).
Determination of transcription start sites (TSSs) and promoter regions of the genes
Transcription start sites (TSSs) and promoter regions of the genes were determined using Neutral Network promoter prediction tool (NNPP version 2.2). The Neural Network Promoter Prediction tool (https://www.fruitfly.org/seq tools/promoter.html) set was used with the minimum promoter score (between 0 and 1) (Reese, 2001). About 1–2-kb sequences upstream of the start codon were excised from each sequence. The excised sequences were submitted to the neural Network Promoter prediction program and an appropriate adjustment was made on the type of the organism, type of DNA strand used and the minimum promoter score (cut-off) to run the program. For this study a default cut-off value (0.8) for eukaryotes was used. Then the program scans the sequences and shows the transcription start site in large font. For those sequences containing more than one transcription start site region, the transcription start site with the highest value of prediction score (0.8) was considered to have a trustable and accurate prediction. The remaining transcription start sites were used for simple comparative analysis among the sequences. Gene promoter regions, 1 kb region upstream of each transcription start site, were determined from the sequences and these regions were taken to predict conserved motifs on different gene sequences.
Determination of conserved motifs and transcription factors that bind to them in potassium transporter gene promoter regions
Analysis of conserved motifs for potassium transporter genes was performed by MEME (Multiple Em for Motif Elicitation) software version 5.0.5 (http://meme.sdsc.edu) using a 1 kb sequence region upstream of the transcription start site, which was determined by Neural Network Promoter Prediction [Citation23]. Using this technique, the presence of the common motifs that serve as binding sites for the transcription factors expected to regulate the expression of potassium transporter genes were determined across the promoter regions. Before searching the common motifs for uploaded sequences, basic search parameters such as, motif discovery mode, sequence alphabet, site distribution and number of motifs were adjusted. For the present study, the classic discovery mode, DNA sequence alphabet, default site distribution (zero or one occurrence per sequence (zoop)) and five (5) numbers of motifs were used. MEME HTML output format was used in this study though six different formats were displayed. The MEME search result motif having the least E-value with a minimum and maximum width of 6 and 50 residues, respectively, was selected as the best motif to be used in TOMTOM web-based searching motif comparison programs for transcription factor prediction. The selected MEME result was forwarded to TOMTOM to predict common protein motifs that bind to DNA motifs at the promoter region by comparing one or more motifs against the database of known motifs, the JASPAR database for this study. In this way, the TOMTOM program generated a list of transcription factors (proteins) ranked by p-value and E-value. Accordingly, the motif with the lowest P-value and E-value was taken as the high binding possibility transcription factor [Citation24].
Search for CpG islands
A 2-kb length query sequence upstream of the start codon was prepared for the 19 protein-coding sequences of potassium transporter genes. Two algorithms were used to search for CpG islands of the genes. The first algorithm was the stringent search criteria, Takai and Jones [Citation25] algorithm: GC content ≥55%, ObsCpG/ExpCpG ≥0.65, and length ≥ 500 bp, which uses CpG island searcher program (CpGi130) available at the web link http://dbcat.cgm.ntu.edu.tw/. The second tool was the offline tool CLC Genomics Workbench ver. 3.6.5 (http://clcbio.com), which was used for searching the restriction enzyme MspI cutting sites (fragment sizes between 40 and 220 bps).
Phylogenetic analysis
Phylogenetic analysis was performed using full-length protein-coding gene sequences to understand the evolutionary relationship among and within the genes. Firstly, the gene sequences retrieved from NCBI were aligned using ClustalW of MEGA ver 6.06 [Citation26] multiple sequence alignment (MSA) tool with the default settings. Then the unrooted phylogenetic tree was constructed using Molecular Evolution Genetic Analysis ver. 6.06 (MEGA6) (http://www.megasoftware.net) tool by the neighbor-joining method [Citation27]. In MEGA ver 6.06, some parameters were modified to obtain a stable estimate of a reliable phylogenetic tree. Accordingly, for transition and transversion nucleotide substitution, the p-distance model was used. Bootstrap values were computed with 2000 repetitions with a uniform rate among sites and complete deletions of gap sites to analyze the sequences.
Results
Sequence retrieval
Gene sequences of 19 potassium transporter family members of six different crop species, 3 coffee (Coffea arabica), 2 peanut (Arachis hypogaea), 3 soybean (Glycine max), 3 maize (Zea mays), 4 sorghum (Sorghum bicolor) and 4 potato (Solanum tuberosum) sequences were retrieved from the NCBI database. These crops were selected randomly from different species to see the genetic variation that may exist among potassium transporters of different crop species. The characteristics of each potassium transporter gene sequence are shown in including locus, chromosome number, number of cis-acting elements, number of ORFs, gene length, number of exons and source organism. The retrieved potassium transporter gene sequences have variable length of nucleotides ranging from 1287 to 7085. The coding sequences of all the potassium transporter genes were disrupted by introns and have exon numbers varying from three to eleven. Four out of 19 genes contain 10 exons and another similar number of genes contain 8 exons in their sequence. The selected genes have a variable number of ORFs ranging from 3 to 30. The maximum number (30) of ORFs was recorded for the LOC8086366 gene, while the minimum number (3) was obtained from five genes (LOC112747245, LOC112736009, LOC100799414, LOC102661038 and LOC102604030). Variation in the number of ORFs was also observed within genes that were isolated from the same crop. The Exon number, number of ORFs and sequence length were different even within genes identified from the same crops ().
Table 1. Characteristics of identified potassium transporter genes.
Determination of transcription start sites and promoter regions for potassium transporter genes
Determining the location of the transcription start sites and promoter region in a given gene is crucial for mapping the cis-regulatory elements and hence for further studying the mechanism of gene regulation [Citation28]. To identify their corresponding transcription start sites, 1–3 kb sequences upstream of the start codon were excised from each sequence. The Neural Network Promoter Prediction (NNPP version 2.2) tool set was employed with the minimum standard predictive score (between 0 and 1) cut-off value of 0.8 for eukaryotes [Citation29]. Accordingly, the result of transcription start site and promoter analysis showed a significant variation in the number of transcription start sites (). The in silico prediction revealed that seven, five, three, two and one potassium transporter genes contained one, two, three, four, five and six transcription start sites, respectively. To make the prediction more reliable for genes having more than one transcription start site, the transcription start site with the highest score was taken as the correct transcription start site. The result indicated that the highest transcription start site number (6) was recorded in the regulatory region of the gene (LOC8065633) isolated from the sorghum crop, whereas the least number (one) of transcription start site was obtained in LOC113687353 (Coffea arabica), LOC113718392 (Coffea arabica), LOC100784861 (Glycine max), LOC100799414 (Glycine max), LOC102661038 (Glycine max), LOC103647711 (Zea mays) and LOC102594138 (Solanum tuberosum) gene sequences. In other words, 36% of the genes contained more than one transcription start site, whereas 63.16% had only one transcription start site. Unlike other crops, all the three genes obtained from Glycine Max showed the least number (1) of transcription start sites ().
Table 2. Identified Transcription start sites (TSSs) for potassium transporters genes.
Similarly, the relative positions of all transcription start sites with respect to the start codon are given in . The nearest transcription start sites were recorded for LOC8075232 (−27) followed by LOC8077489 (−28), whereas the far-flanged transcription start site was observed for LOC8086366 (−2804) followed by another transcription start site of the same sequence (−2769) upstream of the start codons of the gene. It was also demonstrated that the locations for 80% of the transcription start sites were within −1000 bp relative to the start codon. The relatively highest frequency (20%) of occurrence above −1000bp followed by the upstream region of −1 to −200 bp and −201 to −400 bp (17.8%). The lowest occurrences were observed at −601 to −800 and −801 to −1000 bp (13.3%).
Common motifs and respective transcription factors in the promoter regions of potassium transcporters
MEME Suite web server was used to identify common elements (motifs) from a cluster of sequences. Accordingly, five motifs (motif 1, 2, 3, 4 and 5) were found in 5 out of 19 (26.32%) potassium transporter genes’ promoter regions. The relative position and spatial distribution of these motifs on the promoter regions were presented in . Among the five motifs selected for their distribution across the promoters, motif 1 was found as the common promoter motif residing in 78.95% of potassium transporter promoter sequences containing 15 binding sites and having a width of 15 nucleotides (). The common motif was used as a binding site for different transcription factors that regulate the expression of these genes. The conserved motif, motif 1, was found on the negative strand of 52.6% of the genes, whereas the rest resided on the positive strand of the genes. The least identified common motif was motif 5, which was found only in 26.32% of the input sequences with five binding sites ().
Figure 1. Putative motifs distribution in potassium transporter gene sequences relative to TSSs. The Motifs were investigated by the MEME web server. Colored boxes represent different putative motifs. The expected values calculated by MEME are shown after the gene names. See for the respective crop species.
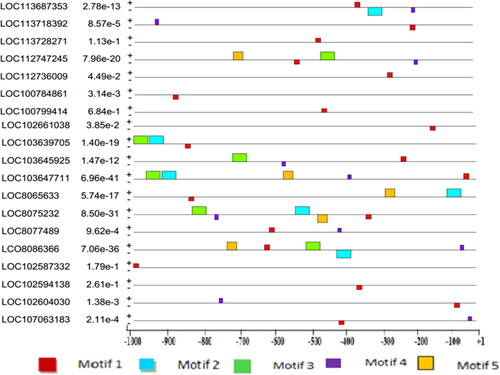
Table 3. Identified common motifs in crop potassium transporter promoter regions.
The total number of motifs discovered in the promoter regions of genes encoding potassium transporters in all the 6 crops were about 48, out of which relatively, higher distributions of motifs were found in positive (32) than in negative (16) strands. In the potassium transporter genes of all these crops, the distribution of motifs along the promoter regions was almost the same in positive and negative strands, except for genes isolated from Sorghum bicolor, for which 10 and 5 motifs were discovered on the positive and negative strands, respectively. The location and distribution of these motifs in the potassium transporter genes ranged from −1000 to −30, whereas a higher concentration of motifs was found between −850 and −30 bp of the transcription start sites (TSSs) ().
Further analyses of motif 1 of potassium transporter genes were carried out (). Motif 1 was compared to the registered motifs in publically available databases such as JASPAR to observe whether a newly discovered putative motif resembles any of the previously discovered regulatory motifs for transcription factors using the statistical measure of motif–motif similarity, TOMTOM web application [Citation24]. Accordingly, the result revealed that motif 1 matched with 18 out of 489 known motifs found in the JASPAR plant motif database. Based on their estimated statistical significance values, the top 10 matched motifs were selected (). The result showed that two C2H2 zinc finger, three Barley B recombinant/basic pentacysteine (BBR-BPC) and one basic helix-loop-helix (bHLH), one helix-turn-helix, and Dof type transcription factor families were motif 1 binding candidates. It was also detected that motif 1 had the highest resemblance with the motif binding to C2H2 zinc finger genes, which is also a known transcription factor family. The sequence logo of the C2H2 zinc finger transcription factor predicted by TOMTOM is presented in .
Figure 2. Sequence logos. (A) Logo for the identified common promoter motif, Motif 1 of potassium transporter genes. The analysis was carried out using the MEME Suite. The horizontal line of the logo represents the width of the motif while the vertical line shows the amount of information of the sequence. (B) Logo for the identified transcription factor motif that binds with high probability on the common motif. The analysis was carried out using TOMTOM 5.0.
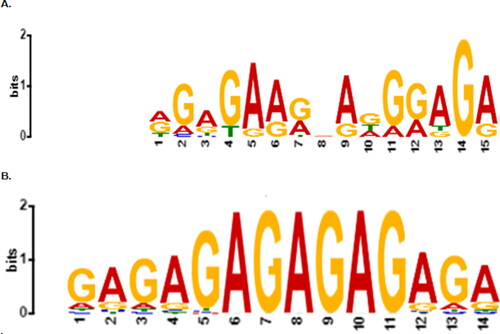
Table 4. Candidate transcription factors (TFs) that could bind to Motif 1 of potassium transporter promoter regions from the JASPAR database.
Determination of CpG islands in potassium transporter gene promoter regions
In this study, CpG islands were identified in the promoter and gene body region for 19 potassium transporter genes of six crop plants using two algorithms, CLC Genomics Workbench 3.6.1 (CLC bio, 2014) and CpG island Finder (Takai and Jones, 2002) algorisms. Accordingly, the former, using restriction enzyme MspI (C/CGG sequence) cutting sites with standard fragment sizes between 40 and 220 bp revealed that in the potassium transporter genes, seven (LOC112747245, LOC100784861, LOC103647711, LOC8065633, LOC8077489, LOC102604030 and LOC107063183) and four (LOC112736009, LOC103639705, LOC8065633, and LOC102604030) CpG islands were found in the gene body and promoter region, respectively ( and ). The result also revealed that the CpG islands were observed in the gene body of the genes from all crops except Coffea arabica. On the other hand, Arachis hypogaea, Zea mays and Solanum tuberosum contained one CpG island in one of their gene’s promoter regions, while Sorghum bicolor had two CpG islands ().
Table 5. The analysis results on the identification of MspI cutting sites and fragment sizes for Potassium transporter gene body regions.
Table 6. MspI cutting sites and fragment sizes identified in potassium transporter gene promoter regions.
The second algorithm, CpG island searcher program (CpGi130) [Citation25] was used to determine the presence of CpG Islands in the promoter and gene body of the potassium transporter genes. The analysis result revealed that only one gene sequence, LOC8086366 (S. bicolor), contained one CpG Island region in its gene body having 833 bp length and 63% GC content (). There were no CpG islands in the promoter region of all the other potassium transporter genes studied here.
Table 7. Possible CpG Islands found in the gene body region of one potassium transporter gene.
Phylogenetic analysis
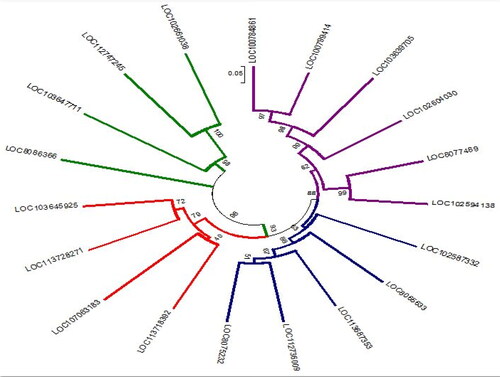
To illustrate the phylogenetic relationships within the potassium transporter gene family, we constructed a phylogenetic tree based on the alignment of full-length DNA sequences using MEGA 6.0 software by neighbor-joining (NJ) method [Citation26]. As indicated in , the transporter genes were grouped into four classes (I, II, III and iV), each with 4, 4, 5 and 6 members, respectively. An unrooted tree with a bootstrap value of 14 to 100 was constructed based on the alignment of the KT/HAK/KUP DNA sequences in coffee (C. arabica), peanut (A. hypogaea), soybean (G. max), maize (Z. mays), sorghum (S. bicolor) and potato (S. tuberosum). The phylogenetic tree indicated that the gene sequences clustered together regardless of their source organism, which implies a close relationship among the genes rather than the whole species.
Figure 3. Phylogenetic tree of genes encoding for potassium transporter sequence from different crop species. The four classes were correspondingly colored in blue, red, green and violet. See the respective crop species in .
Discussion
In the present study transcription start sites were predicted for 19 potassium transporter genes of crop plants and the obtained result revealed that some of the genes contained multiple transcription start sites at different locations on their promotor regions, whereas others comprised a single transcription start site. Accordingly, 36% of the genes contained more than one transcription start site, whereas 63.16% had only one transcription start site. This result is similar to a previous report that 37.9% of 29 transcriptional regulator ACP92 genes in Herbaspirillum seropedicae contained more than one transcription start site, whereas 62.1% had only one site [Citation30]. Aman Beshir and Kebede [Citation31] also reported that the number of transcription start sites varied from 1 to 3 with the majority of sequences (71.43%) having more than one transcription start site. Triska et al. [Citation32] also reported that in eukaryotic genes a promoter contains one or more transcription start sites, which initiate the transcription of a gene. For instance, the MAP kinase gene OsBWMK1 of rice (Oryza sativa) is differentially expressed producing two variants of OsBWMK1 transcripts with different transcriptional initiation sites [Citation33]. The Oryza sativa Lagging Growth and Development 1 (LGD1) gene generates multiple transcripts that have different transcription start sites [Citation34, Citation35]. In general, multiple transcription start sites could give the alternative transcription potential for the genes to produce a variant of the transcript in response to environmental condition change. On the other hand, high throughput TSS identification is helpful for accurate prediction of promoter region [Citation32], as the promoter region which comprises the transcription factor binding sites is mostly found within 1 kb upstream of the transcription start site.
The proximal promoter usually possesses dozens of short conserved motifs that serve as transcription factor binding sites, which are responsible for specific transcription regulation [Citation36]. In the present analysis, we have identified common motifs with different information content in the promoter region of the genes. Accordingly, five motifs that were at least shared by 26.32% of the potassium transporter promoter sequences were predicted. Among the five motifs selected for their distribution across the promoters, motif 1 was found as the common promoter motif residing in 78.95% of potassium transporter promoter sequences. A previous study reported that three putative conserved motifs, each 50 aa in length, were identified in the OsHAK family [Citation8]. Similar to the present finding, Wang et al. [Citation37] identified five motifs in pear KT/HAK/KUP genes based on MEME analysis. Moreover, Song et al. [Citation38] also identified three putative conserved motifs for 41 NtHAK genes. In a similar study, three putative conserved motifs were also identified in ZmHAKs genes and all these three putative conserved motifs were present in all the ZmHAKs members [Citation39].
In this study, C2H2 Zinc finger, BBR-BPC, bHLH, Helix-Turn-Helix and C2H2 Zinc Dof type transcription factors were found to bind to the identified motif (motif 1). These transcription factors bind to specific sequences (motif 1) in the promoters of their target genes, thereby regulating gene expression and affecting biological phenotypes [Citation40]. In agreement with the present findings, Yirgu and Kebede [Citation30] identified five different transcription factor families binding to common motifs in the promoter regions of Herbaspirillum seropedicae ACP92s genes.
CpG islands (CGIs) are also important regulatory elements in the promoter regions of the genome [Citation41]. In the present study, a CpG Island on the prompter region and gene body was predicted using two algorithms. It was suggested that potassium transporter genes are poor in CpG islands both in the promoter region and the gene body. A low number of CpG Islands implies less DNA methylation, meaning that there is a low probability of epigenetic effects in the regulation of these genes. Ashikawa [Citation42] predicted CpG Islands in the genome of plants and the result showed that 80%, 76%, 69% of rice, Arabidopsis and sorghum genes, respectively, had a CpG Island within their gene region. They also elucidated that plant genomes contain CpG islands more frequently than the human genome does. In another study, Yirgu and Kebede [Citation30] reported the occurrence of a myriad of CpG islands in the promoter region and gene body of Herbaspirillum seropedicae bacterium ACP92s genes.
The phylogenetic tree demonstrates the evolutionary relationships of the members under consideration. The phylogenetic tree constructed in the present study revealed that all K+ transporter genes in the crops studied were grouped into four major clusters. This implies that the gene sequences grouped in the same cluster have closer relationship than the genes falling in other clusters. Amrutha et al. [Citation43] reported that in a phylogenetic analysis of K+ transporters in rice, the genes fall into five major branches. Similar phylogenetic tree results of KT/HAK/KUP transporters have been reported in purple osier willow (Salix purpurea) [Citation44], rice (Oryza sativa) [Citation8], poplar (Populus nigra) [Citation9] and pear (Pyrus communis) [Citation37].
Conclusions
It is known that potassium transporter gene families, HAK/KUP/KT, enable various plants to withstand salt and drought stress. Our present in silico study identified the promoter regions and their regulatory elements with diverse biological functions for 19 potassium transporters including core promoter elements, transcription factor binding sites and CpG Islands of the promoter region. The identified genes from different crops have common motifs that serve as a binding site for certain proteins such as transcription factors. CpG islands were poorly observed in the genomes analyzed in this study. The regulatory motifs were distributed on the promoter region in a clustered manner, which enabled us to precisely identify DNA regulatory sequences that are responsible for spatial and/or temporal-specific gene expression. The accurate detection and demarcation of promoter regions are essential for several reasons, such as improving genome annotation and understanding the transcriptional regulation in plants. The results from in silico analysis expanded our knowledge of the promoters along with the regulatory motifs in the potassium transporter genes and could help to use this information for the improvement of the crops under study using genetic engineering or molecular marker-based techniques. The obtained results also provide valuable information for the functional characterization of the potassium transporter genes of the selected crop plants.
Acknowledgments
The authors acknowledge School of Applied Natural Science (SoANS), Adama Science and Technology University for financially supporting the project.
Data availability statement
The data that support the findings of this study are available from the corresponding author, [M.T. Oljira], upon reasonable request.
Disclosure statement
No potential conflict of interest was reported by the authors.
Funding
The study was funded by Adama Science and Technology University.
References
- Maathuis FJ. Physiological functions of mineral macronutrients. Curr Opin Plant Biol. 2009;12(3):250–258.
- Gierth M, Maser P, Schroeder JI . The potassium transporter AtHAK5 functions in K(+) deprivation-induced high-affinity K(+) uptake and AKT1 K(+) channel contribution to K(+) uptake kinetics in Arabidopsis roots. Plant Physiol. 2005;137(3):1105–1114.
- Ashley MK, Grant M, Grabov A. Plant responses to potassium deficiencies: a role for potassium transport proteins. J Exp Bot. 2006;57(2):425–436.
- Gajdanowicz P, Michard E, Sandmann M, et al. Potassium (K+) gradients serve as a mobile energy source in plant vascular tissues. Proc Natl Acad Sci USA. 2011;108(2):864–869.
- Britto DT, Kronzucker HJ. Cellular mechanisms of potassium transport in plants. Physiol Plant. 2008;133(4):637–650.
- Wang Y, Wu WH . Potassium transport and signaling in higher plants. Annu Rev Plant Biol. 2013;64:451–476.
- Very AA, Nieves-Cordones M, Daly M, et al. Molecular biology of K + transport across the plant cell membrane: What do we learn from comparison between plant species? J Plant Physiol. 2014;171(9):748–769.
- Gupta MX, Qiu L, Wang L, et al. KT/HAK/KUP potassium transporters gene family and their whole-life cycle expression profile in rice (Oryza sativa). Mol Genet Genom. 2008;280:437–452.
- He C, Cui K, Duan A, et al. Genome-wide and molecular evolution analysis of the poplar KT/HAK/KUP. Potassium transporter gene family. Ecol Evol. 2012;2(8):1996–2004.
- Uozumi N, Kim EJ, Rubio F, et al. The arabidopsis HKT1 gene homolog mediates inward Na(+) currents in xenopus laevis oocytes and Na(+) uptake in Saccharomyces cerevisiae. Plant Physiol. 2000;122(4):1249–1259.
- Horie T, Yoshida K, Nakayama H, et al. Two types of HKT transporters with different properties of Na+ and K+ transport in Oryza sativa. Plant J. 2001;27:115–128.
- Fairbairn DJ, Liu WH, Schachtman DP, et al. Characterization of two distinct HKT1-like potassium transporters from eucalyptus camaldulensis. Plant Mol Biol. 2000;43(4):515–525.
- Ahn SJ, Shin R, Schachtman DP. Expression of KT/KUP genes in arabidopsis and the role of root hairs in K+ uptake. Plant Physiol. 2004;134(3):1135–1145.
- Banuelos MA, Garciadeblas B, Cubero B, et al. Inventory and functional characterization of the HAK potassium transporters of rice. Plant Physiol. 2002;130(2):784–795.
- Rubio F, Santa-María GE, Rodríguez-Navarro A. Cloning of arabidopsis and barley cDNAs encoding HAK potassium transporters in root and shoot cells. Physiol. Plant. 2000;109(1):34–43.
- Cheng X, Liu X, Mao W, et al. Genome-Wide identification and analysis of HAK/KUP/KT potassium transporters gene family in wheat (Triticum aestivum L.). IJMS. 2018;19(12):3969.
- Berendzen KW, Stüber K, Harter K, et al. Cis-motifs upstream of the transcription and translation initiation sites are effectively revealed by their positional disequilibrium in eukaryote genomes using frequency distribution curves. BMC Bioinf. 2006;7(1):522.
- Wittkopp PJ, Kalay G. Cis-regulatory elements: molecular mechanisms and evolutionary processes underlying divergence. Nat Rev Genet. 2011;13(1):59–69. 10.1038/nrg3095
- Han L, Zhongming Z. CpG islands or CpG clusters: how to identify functional GC-rich regions in a genome. BMC Bioinform. 2009;10:65.
- Mariño-Ramírez L, Tharakaraman K, Spouge JL, et al. Promoter analysis: Gene regulatory motif identification with AGLAM. Methods Mol Biol. 2009;537:263–276.
- Kaur G, Pati PK. Analysis of cis-acting regulatory elements of respiratory burst oxidase homolog (rboh) gene families in arabidopsis and rice provides clues for their diverse functions. Comput Biol Chem. 2016;62:104–118.
- Kaur A, Pati PK, Pati AM, et al. In-silico analysis of cis-acting regulatory elements of pathogenesis-related proteins of Arabidopsis thaliana and Oryza sativa. PLoS One. 2017;12(9):e0184523.
- Bailey TL, Elkan C. Fitting a mixture model by expectation maximization to discover motifs in biopolymers. Proc Int Conf Intell Syst Mol Biol. 1994;2:28–36.
- Gupta S, Stamatoyannopoulos JA, Bailey TL, et al. Quantifying similarity between motifs. Genome Biol. 2007;8(2):R24.
- Takai D, Jones PA. Comprehensive analysis of CpG islands in human chromosomes 21 and 22. Proc Natl Acad Sci USA. 2002;99(6):3740–3745.
- Tamura K, Stecher G, Peterson D, et al. MEGA6: Molecular evolutionary genetics analysis version 6.0. Mol Biol Evol. 2013;30(12):2725–2729.
- Saitou N, Nei M. The neighbor-joining method: a new method for reconstructing phylogenetic trees. Mol Biol Evol. 1987;4(4):406–425.
- Wang X, Bandyopadhyay S, Xuan Z, et al. Prediction of transcription starts sites based on feature selection using AMOSA. Proc LSS Comput Syst Bioinform Conf. 2007;6:183–193.
- Reese MG. Application of a time-delay neural network to promoter annotation in the Drosophila melanogaster genome. Comput Chem. 2001;26(1):51–56.
- Yirgu M, Kebede M. Analysis of the promoter region, motif and CpG islands in AraC family transcriptional regulator ACP92 genes of Herbaspirillum seropedicae. ABB. 2019;10(06):150–164.
- Beshir JA, Kebede M. In silico analysis of promoter regions and regulatory elements (motifs and CpG islands) of the genes encoding for alcohol production in Saccharomyces cerevisiae S288C and Schizosaccharomyces pombe 972h. J Genet Engin Biotechnol. 2021;19:8.
- Triska M, Solovyev V, Baranova A, et al . Nucleotide patterns aiding in prediction of eukaryotic promoters. PLoS One. 2017;12(11):e0187243.
- Koo SC, Choi MS, Chun HJ, et al. Identification and characterization of alternative promoters of the rice MAP kinase gene OsBWMK1. Mol Cells. 2009;27(4):467–473.
- Hernandez-Garcia CM, Finer JJ. Identification and validation of promoters and cis-acting regulatory elements. Plant Sci. 2014;217–218:109–119.
- Thangasamy S, Chen PW, Lai MH, et al. Rice LGD1 containing RNA binding activity affects growth and development through alternative promoters. Plant J. 2012;71(2):288–320. 10.1111/j.1365-313X.2012.04989.x
- Shahmuradov IA, Solovyev VV, Gammerman AJ. Plant promoter prediction with confidence estimation. Nucleic Acids Res. 2005;33(3):1069–1076.
- Wang Y, Lü J, Chen D, et al. Genome-wide identification, evolution, and expression analysis of the KT/HAK/KUP family in pear. Genome. 2018;61(10):755–765.
- Song Z, Wu X, Gao Y, et al. Genome-wide analysis of the HAK potassium transporter gene family reveals asymmetrical evolution in tobacco (Nicotiana tabacum). Genome. 2019;62(4):267–278.
- Zhang Z, Zhang J, Chen Y, et al . Genome-wide analysis and identification of HAK potassium transporter gene family in maize (Zea mays L.). Mol Biol Rep. 2012;39(8):8465–8473.
- Han D, Huang M, Wang T, et al. Lysine methylation of transcription factors in cancer. Cell Death Dis. 2019;10(4):290.
- Deaton AM, Bird A. CpG islands and the regulation of transcription. Genes Dev. 2011;25(10):1010–1022.
- Ashikawa I. Gene-associated CpG islands in plants as revealed by analyses of genomic sequences. Plant J. 2001;26(6):617–625.
- Amrutha RN, Sekhar PN, Varshney RK, et al. Genome-wide analysis and identification of genes related to potassium transporter families in rice (Oryza sativa L.). Plant Sci. 2007;172(4):708–721.
- Liang M, Gao Y, Mao T, et al. Characterization and expression of KT/HAK/KUP transporter family genes in willow under potassium deficiency, drought, and salt stresses. BioMed Res Int. Volume 2020;2690760.