
Abstract
Bee pollen and propolis are considered as health-promoting foods with many therapeutic (antibacterial, antifungal and antioxidant) activities. This study analyzed the phenolic profile and the antioxidant properties of Turkish bee pollen and propolis ethanolic extracts and assayed their antiproliferative effect on myeloma cells and in vitro antibacterial activity against Staphylococcus aureus, Escherichia coli and Pseudomonas aeruginosa. The antibacterial activity assays included agar well diffusion and microdilution methods. The phenolic profile and several aromatic compounds of the extracts were determined by high-performance liquid chromatography with diode-array detection (HPLC-DAD). The antiproliferative activity on myeloma cells was determined by MTT test. The propolis extract had higher total phenolic content (TPC), free-radical scavenging activity (DPPH) and half-maximal inhibitory concentration (IC50) than the pollen ethanolic extract. Benzoic and cinnamic acid were the most abundant aromatic substances in the pollen and propolis extracts, respectively. The IC50 values of pollen and propolis extracts on myeloma cells were 1.49% and 2.88%, respectively. The propolis extract was active against S. aureus and E. coli, but not P. aeruginosa. The pollen extract presented no detectable inhibition zone against the three bacterial strains. The minimum inhibitory concentration (MIC) of both extracts for S. aureus and E. coli was 0.63% (w/v). The minimum bactericidal concentration (MBC) of the propolis extract was 1.25% for S. aureus and E. coli. MIC could not be determined for the pollen extract in the tested bacteria. The pollen and propolis extracts did not exert antimicrobial activity against P. aeruginosa up to 2.5% concentration.
Introduction
Bee pollen and propolis contain a wide range of phenolic compounds, proteins, amino acids, carbohydrates, lipids and fatty acids, enzymes, coenzymes, vitamins and bio-elements [Citation1, Citation2]. Propolis is a sticky, resinous mixture produced by honeybees from plant exudates, beeswax and bee secretions. Honeybees use it for various purposes, including nest construction and as a defense against pathogens, which results in sustainable colony health [Citation3]. Bee pollen, a honeybee derivative product, is the main essential nutrient source used in the feeding of immature (larval) bees [Citation4]. They are considered as health-promoting foods with many therapeutic activities like antibacterial, antifungal, antioxidant, hepatoprotective, anti-inflammatory benefits due to the presence of biologically active compounds: polyphenols, carotenoids, proteins, lipids, vitamins and minerals. The chemical composition of these compounds depends on the local flora where they were collected, the period of beekeeping season, and the genetics of the bees [Citation5–10].
Plant phenolics, including flavonoids and phenolic acids, can be found in varying concentrations in bee pollen and propolis and exhibit antioxidant activity [Citation1, Citation11]. Studies have reported that intake of these natural antioxidants reduces the risk of some diseases such as cancer, diabetes, cardiovascular and neurodegenerative diseases [Citation12–14]. Phenolics also show antimicrobial activity on pathogenic bacteria and fungi through disrupting their cytoplasmic membranes [Citation15–17]. In addition to antioxidant and antimicrobial activities, the phenolics significantly inhibit the cell growth and reduce the differentiation and proliferation of tumor cells [Citation1, Citation18]. Apart from phenolics, pollen and propolis contain many compounds such as coumarins and isocoumarins, xanthones, naphthoquinones, stilbenes, anthraquinones, flavonoids and lignin, which produce the mentioned effects. The content of bee products varies according to various factors such as climates and regions; therefore, they differ in their effects [Citation11, Citation19]. The chemical composition and biological properties of propolis and pollen have been examined extensively in many countries [Citation16, Citation19–21]. The aim of this study was to determine the phenolic profile and the antioxidant properties of Turkish bee pollen and propolis ethanolic extracts as well as to measure the antiproliferative effect on myeloma cells and in vitro antibacterial activity against Staphylococcus aureus, Escherichia coli and Pseudomonas aeruginosa.
Materials and methods
Sampling
Fresh bee pollen and propolis samples were collected from apiaries in Muğla province of Turkey. The samples were kept in a dry place and stored at 4 °C until tests. The ethanolic extracts were prepared by extracting 50 grams of each homogenized sample in 200 mL of ethanol (>96%, Merck, Germany) in the dark at room temperature for 7 days. Then the samples were filtered, and the collected filtrates were subjected to a rotary evaporator (RV10, IKA ®, Germany) at 40 °C to remove the entire solvent. After the evaporation, the concentrated extracts were lyophilized with a freeze dryer (Martin Christ, Alpha 1-2LD plus, Germany) and kept in tubes in the dark at 4 °C for further analysis.
Total phenolic content
The total phenolic content (TPC) of pollen and propolis ethanolic extracts was determined by using the Folin–Ciocalteu method described by [Citation22]. Gallic acid (Sigma, USA) was used as the standard. The results are expressed as microgram Gallic Acid Equivalents (GAE) per milligram of crude extract materials. Briefly, the solutions of gallic acid at a concentration ranging from 3.12 to 200 μg/mL (two-serial dilutions) were prepared in ethanol (Merck, Germany). Two hundred microliters of filtered extract (1 mg/mL in ethanol) or the standard solution (gallic acid) was mixed with 400 μL of distilled water in a tube and 200 μL of 10% Follin–Cicocalteu’s (F–C) phenol reagent (diluted in distilled water) was added to the tube. After 5 min, 200 μL of 1 mol/L sodium carbonate solution were added to the tube. The mixture was incubated for 30 min at room temperature and protected from light. After incubation, the mixture (300 μL) was added to a 96-well plate. Ethanol was used as blank. The absorbance was measured at 750 nm with a microplate spectrophotometer (Multiskan Go, Thermo Scientific).
Phenolic compounds
Analysis of phenolic acid compounds from ethanolic extracts of pollen and propolis was carried out by high performance liquid chromatography (HPLC) using a chromatograph equipped with an Agilent Eclipse XDB-C18 (250 × 4.60 mm) 5-micron column and a diode array detector (SPD-M10A, Shimadzu). The column was eluted using a linear gradient of 3% acetic acid (solvent A) and methanol (solvent B) with a solvent flow rate of 0.8 mL/min. Chromatograms were recorded at 278 nm with the photodiode array detector. The gradient program and HPLC conditions are given at and . The standard solutions were prepared using methanol to dissolve the chemicals to reach concentrations ranging from 0.7 to 500.0 μg/mL for gallic acid, protocatechuic acid, catechin, p-hydroxybenzoic acid, chlorogenic acid, caffeic acid, syringic acid, p-coumaric acid, ferulic acid, sinapinic acid, benzoic acid, o-coumaric acid, rutin, hesperidin, rosmarinic acid, eriodictyol, cinnamic acid, quercetin, luteolin, kaempferol, apigenin. These standards are phenolic compounds, except for benzoic and cinnamic acid which are aromatic acids. We added these aromatic compounds to the standard pool since there is little research analyzing these compounds in bee products. The dried extract of propolis and pollen, 20 mg of each sample, were dissolved into 1 mL of ethanol. The mixtures were filtered with a polytetrafluoroethylene (PTFE) (0.45 µm) filter, and 20 µL of the sample filtrate was injected into the HPLC system.
Table 1. Gradient program of HPLC.
Table 2. HPLC conditions and settings.
Antiradical activity
The measurement of DPPH (2,2-diphenyl-1-picrylhydrazyl) was conducted according to the method of [Citation23] with slight modifications. Briefly, 50 µL of ethanol crude extract dissolved in ethanol (10, 100 and 1000 µg/mL) was mixed with 150 µL of 200 µmol/L methanolic DPPH solution in a 96-well plate. The mixture was incubated for 30 min in a dark condition at 25 °C. Absolute methanol was used as blank. Absorbance was measured at 517 nm by using a microplate reader (Multiskan Go, Thermo Scientific). The DPPH radical scavenging activity (%) was calculated as follows: DPPH scavenging activity (%) = [(Ac – As)/Ac] × 100, where Ac is the absorbance of the control [DPPH + Methanol without sample] and As is the absorbance of the sample [DPPH + Sample (extract)].
Antiproliferative activity
MTT test was used to calculate the half-maximal inhibitory concentration (IC50), which is the drug concentration that causes a 50% decrease in the cell viability; IC50 is used to evaluate a drug in inhibiting a specific biological function in vitro [Citation24, Citation25]. F0 (ATCC CRL-1646) Mouse Myeloma cell line was used in the antiproliferative activity assay (MTT test) of bee pollen and propolis samples in this study. The cells were cultured in Dulbecco’s Modified Eagle’s Medium (DMEM) containing 10% FBS (Fetal bovine serum), 0.1% gentamicin, 1% sodium pyruvate and 2% L-glutamine and maintained at 37 °C, in 5% CO2 and 95% relative humidity in a humidified incubator (Steri-Cycle i160, Thermo Scientific). The cells were seeded in a 96-well flat-bottom microtiter plate at a density of 1 × 10⁴ cells/well and allowed to adhere overnight at 37 °C in the incubator. After overnight incubation, the culture medium was replaced with fresh medium. The cells were then treated with various concentrations (50, 25, 12.5, 6.25, 3.12, and 1.56 mg/mL) of the extracts for 24 h at 37 °C in the incubator. The medium only and 0.1% Triton X-100 served as negative and positive controls, respectively. After treatment, the MTT solution at a final concentration of 0.5 mg/mL was added to each well for about 3 h in the incubator at 37 °C. The medium containing MTT was removed from the wells and 250 µL of dimethylsulfoxide (DMSO) was added to each well to solubilize the formazan crystals. Absorbance was measured at 540 nm using a microplate spectrophotometer (Multiskan Go, Thermo Scientific). Cell viability was expressed as the percentage of MTT reduction, assigning the 100% value to the absorbance of the control cells. All experiments were performed in triplicate and expressed as mean values with standard deviation (±SD).
Antimicrobial activity
The antimicrobial activity of pollen and propolis extract was assessed by agar well diffusion [Citation26] and microdilution method [Citation27].
Bacterial strains
Staphylococcus aureus (ATCC 25923), Escherichia coli (ATCC 29998) and Pseudomonas aeruginosa (ATCC 27853) strains were obtained from the stock culture collection of the Department of Food Hygiene and Technology Laboratory, Burdur Mehmet Akif Ersoy University. The bacterial strains were transferred on Tryptic Soy Agar (TSA, BK047HA, BİOKAR) and incubated for 18-24 h at 37 °C. Each bacterial cell was transferred into 0.9% sterile saline buffer and adjusted to 0.5 McFarland scale (1–1.5 × 10⁸ CFU/mL).
Agar well diffusion
The serial dilutions of the samples (100, 50, 25, 12.50, and 6.25 mg/mL) were prepared in ethanol. Each microbial inoculum was streaked on Mueller Hinton Agar (BK048HA, BIOKAR) using sterile cotton swabs. Wells of 6 mm size and 4 mm depth were prepared on each plate with sterile borer and 100 μL volume of each dilution was dispensed into the wells. Enrofloxacin (64 µg/mL) and absolute ethanol were used as positive and negative controls, respectively. The plates were incubated at 37 °C for 24 h. The plates were observed for presence of inhibition zones around the wells and the diameter of inhibition zones was measured with a digital caliper.
Microdilution method
Minimum inhibitory concentration (MIC) and minimum bactericidal concentration (MBC) values of bee pollen and propolis extracts were determined by using microdilution method in 96-well microplates according to the CLSI guidelines [Citation27]. The bacterial strains were grown in TSA (BK047HA, BIOKAR) and incubated for 18 h at 37 °C. Bacterial inoculums were adjusted to 0.5 McFarland (approximately 1.5 × 10⁸ CFU/mL) in 0.9% sterile saline buffer. The serial dilutions of the samples (25, 12.50, 6.25, 3.12, 1.56, 0.78, and 0.39 mg/mL) were prepared in Mueller Hinton broth (BK048HA, BIOKAR) and transferred to the wells of microplates. Twenty microliters of each bacterial inoculum were inoculated into each well and plates were incubated at 37 °C for 24 h. Following the incubation, microbial growth was determined at 600 nm using a microplate reader (Epoch, BioTek, USA). The lowest concentration of each extract inhibiting the visible growth of the bacteria was recorded as the MIC. The MBC value was determined by removing 10 µL of the suspension from each well and inoculating on Mueller Hinton agar plates. The plates were incubated at 37 °C for 24 h. The MBC was identified by determining the lowest concentration of extracts that completely inhibited the growth of bacteria [Citation28].
Data analysis
All experiments were replicated three times. The results of the agar well diffusion and MTT were expressed as mean values with standard deviation (±SD).
Results and discussion
Phenolic compounds and total phenolic content
Nowadays, bee products, especially propolis and pollen, are considered to be multifunctional, an excellent natural source of a broad spectrum of vitamins, minerals and proteins and interesting alternatives to synthetic antioxidants and antimicrobials [Citation8, Citation11, Citation15]. Bee products exhibit antioxidant, antibacterial, anti-inflammatory and anticancer properties due to their active ingredients, especially, phenolic acids and flavonoids [Citation1, Citation15, Citation29]. In the present study, the phenolic compounds in pollen and propolis ethanolic extracts were investigated by using HPLC-DAD. show chromatograms corresponding to a mixture of phenolic standards, the phenolic profile of bee pollen and propolis ethanolic extracts, respectively. shows the phenolic compounds (µg/g) in pollen and propolis ethanolic extracts. The pollen extract did not contain catechin, epicatechin, syringic acid, vanillin, rutin, hesperidin, eriodyctiol, but had higher amounts of benzoic acid (8900.6 µg/g) and apigenin (6477.2 µg/g) and had lower amounts of protocatechuic acid (19.1 µg/g) and p-hydroxy benzoic acid (19.6 µg/g). The propolis extract did not contain catechin, sinapinic acid, o-coumaric acid, rutin, hesperidin, quercetin, but had higher amounts of cinnamic acid (8256.1 µg/g) and apigenin (3965.9 µg/g) and had lower amounts of chlorogenic acid (24.3 µg/g) and syringic acid (18.4 mg/g). Benzoic acid was the most abundant compound in bee pollen, whereas cinnamic acid was the most abundant compound in propolis. Apigenin was the second most abundant phenolic compound in both pollen and propolis extracts.
Figure 1. HPLC analysis. (A) Standard chromatogram. 1: Gallic Acid, 2: Protocatechic Acid, 3: Catechin, 4: P-Hydroxy Benzoic Acid, 5: Chlorogenic Acid, 6: Caffeic Acid, 7: Epicatechin, 8: Syringic Acid, 9: Vanilin, 10: P-Coumaric Acid, 11: Ferulic Acid, 12: Sinapinic Acid, 13: Benzoic Acid, 14: O-Coumaric Acid, 15: Rutin, 16: Hesperidin, 17: Rosmarinic Acid, 18: Eriodictiol, 19: Cinnamic Acid, 20: Quercetin, 21: Luteolin, 22: Kaempferol, 23: Apigenin. (B) Chromatogram of the bee pollen ethanolic extract. (C) Chromatogram of the propolis ethanolic extract.
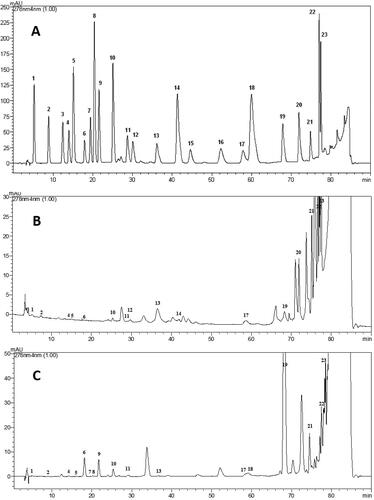
Table 3. Phenolic compounds of bee pollen and propolis ethanolic extracts.
In the literature, the phenolic profile in bee products has been generally examined. Therefore, in this study, we assessed the concentrations of cinnamic acid and benzoic acid, which have important antioxidant and antimicrobial activities [Citation30–32]. Aliyazıcıoğlu et al. [Citation33] reported that propolis methanolic extracts have benzoic acid in the range of 242.7–7262.7 µg/g. Ulusoy and Kolaylı [Citation34] reported that methanolic bee pollen extracts have benzoic acid in the range of 0–10.7 µg/g. Ozdal et al. [Citation35] reported that propolis ethanolic extracts have benzoic acid and t-cinnamic acid in the range of 0–95.6 and 0–1149.0 µg/g, respectively. Another study reported that ethanolic propolis extracts have cinnamic acid in the range of 50.0–4000.0 µg/g [Citation36]. In the present study, bee pollen ethanolic extracts had benzoic acid and cinnamic acid with mean concentrations of 8900.6 and 273.8 µg/g, respectively, while propolis ethanolic extracts had benzoic acid and cinnamic acid with a mean concentration of 349.7 and 8256.1 µg/g, respectively. The higher antibacterial activity of pollen and propolis extracts in this study compared to other studies may be related to these aromatic compounds found in high concentrations in the extracts.
Authors have used solvents containing ethanol, methanol, water, dichloromethane and ethyl acetate alone or together (such as ethanol/water) to prepare pollen and propolis extract. In the literature, differences were observed in the phenolic profile according to the solvent used in the preparation of the effect and the flora from which the bee product was obtained. Karkar et al. [Citation37] did not find gallic acid in the ethanolic extract of chestnut bee pollen, but found a small amount of syringic acid. In addition, they found lesser amount of kaempferol than our results. These results are not similar to our study results. Alimoglu et al. [Citation38] found that luteolin and kaempferol in dichloromethane extract of bee pollen were 310 and 260 µg/g, respectively. In addition, they reported that the ethyl acetate extract contains chlorogenic acid, caffeic acid and rutin at concentrations of 1370, 280 and 3390 µg/g, respectively. Compared to the study of [Citation39], the levels of chlorogenic acid, caffeic acid and rutin were higher in the ethanolic extract obtained in our study, while the levels of luteolin, quercetin and kaempferol were lower. These results demonstrate that the solvent used in the extraction changes the phenolic profile.
The compound that is present in the largest quantity in ethanolic extract of bee pollen from Poland was found to be p-coumaric acid, ranging from 3754 to 116950 µg/g [Citation39]. Coelho et al. [Citation40] reported that ethanolic extract of sixteen propolis samples from different areas of Brazil had p-coumaric acid at concentrations of 1000–27200 µg/g. Kumazawa et al. [Citation41] and Ahn et al. [Citation42] found p-coumaric acid at concentrations of 900–27400 and 2300–52200 µg/g in propolis extracts, respectively. In the present study, p-coumaric acid in propolis extract was quite low compared to the studies mentioned above. In addition to p-coumaric acid, these differences are also noticeable in other phenolic compounds. There are great differences in phenolic profiles among ethanolic extracts of propolis collected from different regions. However, bee pollen and propolis extracts exhibited different phenolics’ profiles agreeing with literature [Citation34, Citation43–45].
In the present study, the phenolic contents of the ethanolic pollen and propolis extracts were 45.24 ± 5.75 and 86.90 ± 11.15 µg of GAE/mg of dry extracts, respectively. However, different results were found in the literature. The TPC value of the pollen extract in this study was similar to those in the range of 9.15 to 462.02 mg GAE/g pollen [Citation38, Citation46–50]. Also, the TPC value of the propolis extract was similar to those reported in various propolis samples from different regions with TPCs ranging from 31.00 to 302.00 mg GAE/g propolis [Citation42, Citation51–54]. Numerous studies on TPC analyzes in bee products describe various ranges for total phenolics of pollen and propolis from different geographical origins, depending on the standard (gallic acid, pinocembrin, chlorogenic acid) and solvent (methanol, ethanol) used [Citation55–58].
Antiradical activity
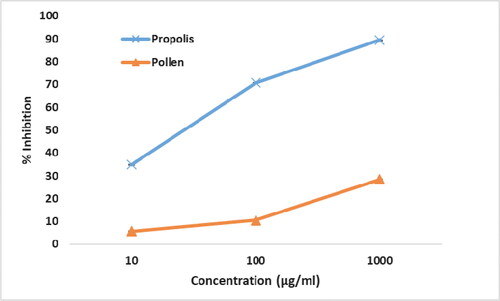
DPPH method has been widely used to determine the antiradical activity of various samples [Citation59]. In the present study, we used the DPPH method to predict the antioxidant activities of the pollen and propolis ethanolic extracts in vitro (). The DPPH scavenging activities of the pollen extract at the concentrations of 10, 100 and 1000 μg/mL were 5.75 ± 0.01, 10.51 ± 0.01 and 28.42 ± 0.02%, respectively. The DPPH scavenging activities of the propolis extract at the concentrations of 10, 100 and 1000 μg/mL were 34.92 ± 0.01, 70.80 ± 0.02 and 89.57 ± 0.01%, respectively. The scavenging activity was approximately 34.9% at a concentration of 10 μg/mL of propolis extract; it was about 5.8% at the same concentration of pollen extract. In the present study, the propolis extract with higher TPC value (86.90 ± 11.15 µg of GAE/mg) exhibited higher antiradical activity against DPPH compared to the pollen extract (45.24 ± 5.75 µg of GAE/mg). Mohdaly et al. [Citation16] observed that the scavenging activity of propolis extract was superior to that of pollen extract and the DPPH scavenging had a linear relation with TPC concentration. The results of the present study supported the suggestion that the antioxidant activity of the extracts mainly depends on the concentration of the phenolic compounds present.
Figure 2. Scavenging activity of propolis and pollen extracts against DPPH radicals at different concentrations.
Antiproliferative activity
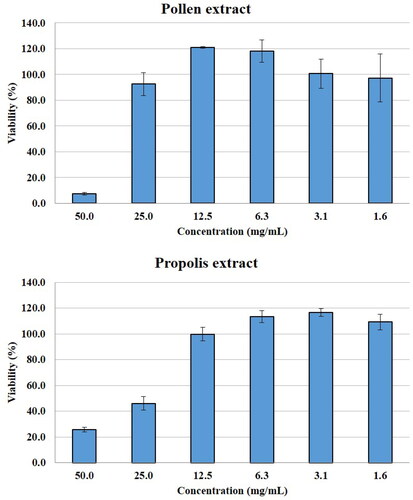
In the present study, the antiproliferative activities of pollen and propolis ethanolic extracts were tested on Myeloma cells (). It has been shown in the literature that pollen and propolis have antiproliferative activity against various cell lines. In a previous study, propolis ethanolic extract exhibited good antiproliferative activity against MCF7 (human breast cancer), HGC27 (human gastric carcinoma) and A549 (human lung adenocarcinoma) cancer cell lines with IC50 values in the range of 58.6 − 90.7 μg/mL in MTS test [Citation60]. In another study, water-soluble propolis and bee pollen showed antiproliferative activity in MCF‑7 cells, with IC50 values of 10.8 ± 0.06 and 18.6 ± 0.03 mg/mL, respectively [Citation61]. Choudhari et al. [Citation18] reported that ethanolic extract of propolis at a concentration of 250 μg/mL exhibited ≥50% lethality in MCF-7, HT-29 (human colon adenocarcinoma), Caco-2 (human epithelial colorectal adenocarcinoma) and B16F1 (murine melanoma) cells. In the present study, IC50 values of pollen and propolis extracts on myeloma cells were founded to be 1.49% and 2.88%, respectively. Compared with studies examining the antiproliferative activity of bee pollen and propolis on other cancer lines, the results of this study may indicate that myeloma cells are less sensitive to pollen and propolis ethanolic extract than other cell lines.
Figure 3. Effects of pollen and propolis extracts on viability of Myeloma cells. MTT assay.
Values are means from 3 independent experiments, with standard deviation (±S.D.)
Antibacterial activity
In the present study, the antibacterial activities of bee pollen and propolis ethanolic extracts were evaluated against S. aureus, E. coli and P. aeruginosa ( and ). According to the agar well diffusion test, the propolis ethanolic extract in the tested concentrations (from 6.25 mg/mL to 100 mg/mL) showed antibacterial activity against S. aureus and E. coli with an inhibition zone from 12.6 ± 1.0 to 19.9 ± 0.6 mm and from 11.8 ± 0.5 to 17.3 ± 1.1 mm, respectively. The bee pollen ethanolic extract presented no detectable antibacterial activity against S. aureus, E coli and P. aeruginosa in the concentrations used. There was no visible inhibition zone against P. aeruginosa for both pollen and propolis ethanolic extracts. Propolis extract was more potent in inhibiting S. aureus than E. coli. Similar to the present study, several studies reported that gram-positive bacteria are more sensitive to ethanolic extract of bee pollen and propolis than gram-negative bacteria [Citation62–66]. However, some papers reported that ethanolic extract of bee pollen has no antibacterial activity against E. coli O157:H7 and S. aureus [Citation62, Citation63]. Similarly, there are different results on the antibacterial activity of pollen and propolis on P. aeruginosa [Citation66, Citation67]. The differences in the antibacterial properties of bee pollen and propolis may be related to their chemical composition depending strongly on botanical and geographic origin, climate and soil type, extraction methods and solvents used in extractions [Citation68].
Table 4. Antimicrobial activity of pollen and propolis extracts against selected pathogens using agar well diffusion method (mm).
Table 5. Minimum inhibitory and bactericidal concentrations of bee pollen and propolis extracts against selected pathogens (mg/mL).
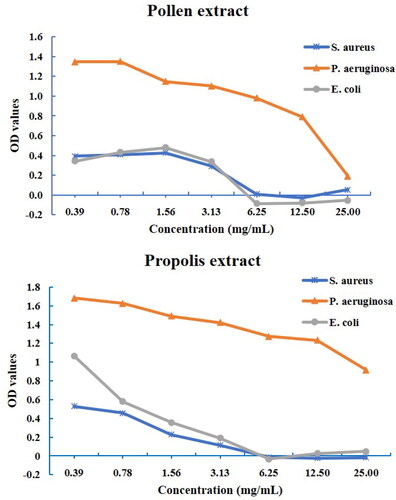
The microdilution method showed that all extracts did not exhibit antibacterial activity against P. aeruginosa ( and ) like the agar well diffusion test. Both extracts showed high antimicrobial activity against S. aureus and E. coli with a MIC value of 6.25 mg/mL. Although the MBC values of the propolis extract against S. aureus and E. coli were 12.5 mg/mL, the MBC value could not be determined for the propolis extract, which had no antibacterial effect against P. aeruginosa. The pollen extract had no antibacterial activity against all tested bacteria at the applied concentrations (0.39–25 mg/mL).
Figure 4. MIC values of the extracts for all tested bacteria.
Several studies have reported that bee pollen and propolis extracts exhibited higher antibacterial effect against gram-positive cocci (S. aureus) than gram-negative bacteria (E. coli and P. aeruginosa) [Citation16, Citation69–71]. The reported values of MICs are widely divergent for pollen and propolis ethanolic extracts. Previous studies have reported that the MICs of propolis ethanolic extracts ranged between 0.008–3.1 mg/mL, 0.016–5.0 mg/mL, 0.31–7.9 mg/mL, against S. aureus, E. coli and P. aeruginosa, respectively [Citation20, Citation72–75). Similarly, the MICs of bee pollen ethanolic extracts are widely divergent. Several studies have reported that pollen ethanolic extracts show antibacterial activity against S. aureus, E. coli and P. aeruginosa in the range of 0.78->20 mg/mL, 1.25->20 mg/mL, 10->20 mg/mL, respectively [Citation16, Citation21, Citation76, Citation78]. The lower activity of propolis and pollen on gram-negative bacteria can be attributed to the structure of the outer membrane of the bacteria and their ability to produce hydrolytic enzymes that degrade the active components of propolis [Citation78]. Gram-negative bacteria, which have a double cell wall of lipopolysaccharides and proteins, are resistant to the antibacterial effect of bee pollen [Citation71]. In the present study, propolis extracts demonstrated lower efficiency than previous studies, while pollen extracts showed their effect in a line with other studies [Citation16, Citation76]. Propolis ethanolic extract demonstrated higher antioxidant and antibacterial activities than pollen ethanolic extract, which can be attributed to the presence of higher phenolic and flavonoid contents of the former [Citation16, Citation21].
The antibacterial activities of bee pollen and propolis extracts obtained using different solvents were evaluated in several reports. The MIC values of the hydroethanolic extract of bee pollen for S. aureus, E. coli and P. aeruginosa ranged from 0.064 to 0.512 mg/mL [Citation38]. The MIC values of the methanolic extract of propolis against S. aureus, E. coli and P. aeruginosa were in the range of ≥1.25->5 mg/mL, >1.25->5 mg/mL, and ≤1.25 mg/mL, respectively [Citation33]. Variations between the antimicrobial effects of the extracts probably depend not only on the floral origin of pollen and propolis, but also on the extraction method and solvents used.
Conclusions
This study showed that ethanolic extracts of bee pollen and propolis had antimicrobial, free-radical scavenging and antiproliferative properties. Due to presence of bioactive compounds responsible for these activities, Turkish bee pollen and propolis could be a natural source of antiradical and antibacterial ingredients as a dietary supplement and could be used as an agent for preventing food for spoilage in the food industry.
Conflict of interest
The authors declare that there is no conflict of interest.
Data availability statement
The data that support the findings reported in this study are available from the corresponding author upon reasonable request.
Funding
This research received no grant from any funding agency/sector.
References
- Kocot J, Kiełczykowska M, Luchowska-Kocot D, et al. Antioxidant potential of propolis, bee pollen, and royal jelly: possible medical application. Oxid Med Cell Longev. 2018;2018(2018):7074209.
- Tutun H, Kaya MM, Usluer MS, et al. Bee pollen: Its antioxidant activity. U Bee J. 2021;21:119–131.
- Devequi-Nunes D, Machado BAS, Barreto GDA, et al. Chemical characterization and biological activity of six different extracts of propolis through conventional methods and supercritical extraction. PLoS One. 2018;13(12):e0207676.
- Tutun H, Aluç Y, Kahraman HA, et al. The content and health risk assessment of selected elements in bee pollen and propolis from Turkey. J Food Compos Anal. 2022;105:104234.
- Almeida-Muradian LB, Pamplona LC, Coimbra S, et al. Chemical composition and botanical evaluation of dried bee pollen pellets. J Food Comp Anal. 2005;18(1):105–111.
- Cornara L, Biagi M, Xiao J, et al. Therapeutic properties of bioactive compounds from different honeybee products. Front Pharmacol. 2017;8:412–432.
- Fatrcová-Šramková K, Nôžková J, Máriássyová M, et al. Biologically active antimicrobial and antioxidant substances in the helianthus annuus L. bee pollen. J Environ Sci Health B. 2016;51(3):176–181.
- Mosić M, Trifković J, Vovk I, et al. Phenolic composition influences the health-promoting potential of bee-pollen. Biomolecules. 2019; 9(12):783–797.
- Nogueira C, Iglesias A, Feas X, et al. Commercial bee pollen with different geographical origins: a comprehensive approach. Int J Mol Sci. 2012;13(9):11173–11187.
- Santos LM, Fonseca MS, Sokolonski AR, et al. Propolis: types, composition, biological activities, and veterinary product patent prospecting. J Sci Food Agric. 2020;100(4):1369–1382.
- Spulber R, Colta T, Babeanu N, et al. Chemical diversity of polyphenols from bee pollen and propolis. AgroLife Sci. J. 2017;6(2):183–194.
- Uttara B, Singh AV, Zamboni P, et al. Oxidative stress and neurodegenerative diseases: a review of upstream and downstream antioxidant therapeutic options. Curr Neuropharmacol. 2009;7(1):65–74.
- Woźniak M, Mrówczyńska L, Waśkiewicz A, et al. Phenolic profile and antioxidant activity of propolis extracts from Poland. Nat Prod Commun. 2019;14(5):1934578X1984977. 1934578X19849777.
- Yang CS, Landau JM, Huang MT, et al. Inhibition of carcinogenesis by dietary polyphenolic compounds. Annu Rev Nutr. 2001;21(1):381–406.
- Denisow B, Denisow‐Pietrzyk M. Biological and therapeutic properties of bee pollen: a review. J Sci Food Agric. 2016;96(13):4303–4309.
- Mohdaly AA, Mahmoud AA, Roby MH, et al. Phenolic extract from propolis and bee pollen: composition, antioxidant and antibacterial activities. J Food Biochem. 2015; 39(5):538–547.
- Sforcin JM, Bankova V. Propolis: is there a potential for the development of new drugs? J Ethnopharmacol. 2011;133(2):253–260.
- Choudhari MK, Haghniaz R, Rajwade JM, et al. Anticancer activity of indian stingless bee propolis: an in vitro study. Evid Based Complement Altern Med. 2013;2013:928280.
- Saral Ö, Kilicarslan M, Şahin H, et al. Evaluation of antioxidant activity of bee products of different bee races in Turkey. Turk J Vet Anim Sci. 2019;43(4):441–447.
- Dantas Silva RP, Machado BA, Barreto GA, et al. Antioxidant, antimicrobial, antiparasitic, and cytotoxic properties of various brazilian propolis extracts. PLoS One. 2017;12(3):e0172585.
- Mohamed WF, Shady HMA, Sayed-Ahmed ESF, et al. Antibacterial activity of egyptian propolis and pollen extracts and their synergistic/antagonistic effect with lactic acid bacteria (lab) against food borne pathogenic bacteria. Egypt J Exp Biol (Bot.). 2016; 12(1):31–43.
- Pawar SS, Dasgupta D. Quantification of phenolic content from stem-bark and root of hugonia mystax linn. using RP-HPLC. J King Saud Univ Sci. 2018;30(3):293–300.
- Ben Mansour R, Ksouri WM, Cluzet S, et al. Assessment of antioxidant activity and neuroprotective capacity on PC12 cell line of frankenia thymifolia and related phenolic LC-MS/MS identification. Evid Based Complement Alternat Med. 2016;2016:2843463.
- Aykul S, Martinez-Hackert E. Determination of half-maximal inhibitory concentration using biosensor-based protein interaction analysis. Anal Biochem. 2016;508:97–103.
- Bag A, Ghorai PK. Development of quantum chemical method to calculate half maximal inhibitory concentration (IC50). Mol Inform. 2016;35(5):199–206.
- Collins CH, Lynes PM, Grange JM. Microbiological methods. 7th ed. London, Britain: Butterwort-Heinemann Ltd; 1995. pp. 175–190.
- Clinical and Laboratory Standards Institute-CLSI. Performance standards for antimicrobial susceptibility testing. Approved standard (M100S). 26th ed. Pennsylvania, USA: Clin. Lab. Standard. Inst. Publ., Wayne; 2016.
- Kahraman HA, Tutun H, Keyvan E, et al. Investigation of chemical, antibacterial and antiradical properties of home-made apple and grape vinegars. Ankara Univ Vet Fak Derg. 2022;69. https://doi.org/10.33988/auvfd.865309.
- Marcucci MC. Propolis: chemical composition, biological properties and therapeutic activity. Apidologie. 1995; 26(2):83–99.
- Lima TC, Ferreira AR, Silva DF, et al. Antifungal activity of cinnamic acid and benzoic acid esters against Candida albicans strains. Nat Prod Res. 2018;32(5):572–575.
- Sova M. Antioxidant and antimicrobial activities of cinnamic acid derivatives. Mini Rev Med Chem. 2012;12(8):749–767.
- Velika B, Kron I. Antioxidant properties of benzoic acid derivatives against superoxide radical. Free radic. Antioxid. 2012;2(4):62–67.
- Aliyazıcıoglu R, Sahin H, Erturk O, et al. Properties of phenolic composition and biological activity of propolis from Turkey. Int. J. Food Prop. 2013;16(2):277–287.
- Ulusoy E, Kolayli S. Phenolic composition and antioxidant properties of anzer bee pollen. J Food Biochem. 2014;38(1):73–82.
- Ozdal T, Ceylan FD, Eroglu N, et al. Investigation of antioxidant capacity, bioaccessibility and LC-MS/MS phenolic profile of turkish propolis. Food Res Int. 2019;122:528–536.
- Kalogeropoulos N, Konteles SJ, Troullidou E, et al. Chemical composition, antioxidant activity and antimicrobial properties of propolis extracts from Greece and Cyprus. Food Chem. 2009;116(2):452–461.
- Karkar B, Şahin S, Güneş ME. Antioxidative effect of turkish chestnut bee pollen on DNA oxidation system and its phenolic compounds. GIDA. 2018;43(1):34–42.
- Alimoglu G, Guzelmeric E, Yuksel PI, et al. Monofloral and polyfloral bee pollens: comparative evaluation of their phenolics and bioactivity profiles. LWT. 2021;142:110973.
- Socha R, Gałkowska D, Bugaj M, et al. Phenolic composition and antioxidant activity of propolis from various regions of Poland. Nat Prod Res. 2015;29(5):416–422.
- Coelho J, Falcao SI, Vale N, et al. Phenolic composition and antioxidant activity assessment of southeastern and South brazilian propolis. J Apic Res. 2017;56(1):21–31.
- Kumazawa S, Hamasaka T, Nakayama T. Antioxidant activity of propolis of various geographical origins. Food Chem. 2004;84(3):329–339.
- Ahn MR, Kumazawa S, Usui Y, et al. Antioxidant activity and constituents of propolis collected in various areas of China. Food Chem. 2007;101:1400–1409.
- Bozkuş TN, Değer O, Yaşar A. Chemical characterization of water and ethanolic extracts of turkish propolis by HPLC-DAD and GC-MS. J Liq Chromatogr Relat Technol. 2021;44(1–2):77–86.
- Oruç HH, Sorucu A, Ünal HH, et al. Effects of season and altitude on biological active certain phenolic compounds levels and partial standardization of propolis. Ankara Univ. Vet. Fak. Derg. 2017; 64(1):13–20.
- Osés SM, Marcos P, Azofra P, et al. Phenolic profile, antioxidant capacities and enzymatic inhibitory activities of propolis from different geographical areas: Needs for analytical harmonization. Antioxidants. 2020;9(1):75–91.
- Dulger Altiner D, Sandikci Altunatmaz S, Sabuncu M, et al. In-vitro bioaccessibility of antioxidant properties of bee pollen in Turkey. Food Sci Technol. 2021;41(suppl 1):133–141.
- Duran A, Quicazan M, Zuluaga-Dominguez C. Effect of solar drying process on bioactive compounds and antioxidant activity in vitro of high andean region bee pollen. Chem Eng Trans. 2019;75:91–96.
- El Ghouizi A, El Menyiy N, Falcão SI, et al. Chemical composition, antioxidant activity, and diuretic effect of moroccan fresh bee pollen in rats. Vet World. 2020;13(7):1251–1261.
- Keskin M, Özkök A. Effects of drying techniques on chemical composition and volatile constituents of bee pollen. Czech J Food Sci. 2020;38(No. 4):203–208.
- Lawag IL, Yoo O, Lim LY, et al. Optimisation of bee pollen extraction to maximise extractable antioxidant constituents. Antioxidants. 2021; 10(7):1113–1154.
- Bayram NE, Gerçek YC, Öz GC. Screening for antioxidant capacity, pollen types and phytochemical profile by GC/MS and UHPLC from propolis. Progr Nutr. 2020;22:e2020011.
- Gülçin İ, Bursal E, Şehitoğlu MH, et al. Polyphenol contents and antioxidant activity of lyophilized aqueous extract of propolis from erzurum, Turkey. Food Chem Toxicol. 2010;48(8–9):2227–2238.
- Mohammadzadeh S, Shariatpanahi M, Hamedi M, et al. Chemical composition, oral toxicity and antimicrobial activity of iranian propolis. Food Chem. 2007;103(4):1097–1103.
- Zehra C, Yildiz O, Şahin H, et al. Phenolic profile and antioxidant potential of propolis from Azerbaijan. Mellifera. 2015;15(1):16–28.
- Čeksteryté V, Kurtinaitienė B, Venskutonis PR, et al. Evaluation of antioxidant activity and flavonoid composition in differently preserved bee products. Czech J Food Sci. 2016;34(No. 2):133–142.
- da Silva IAA, da Silva TMS, Camara CA, et al. Phenolic profile, antioxidant activity and palynological analysis of stingless bee honey from Amazonas, Northern Brazil. Food Chem. 2013;141(4):3552–3558.
- Can Z, Yildiz O, Sahin H, et al. An investigation of turkish honeys: their physico-chemical properties, antioxidant capacities and phenolic profiles. Food Chem. 2015;180:133–141.
- Almeida AMM, Oliveira MBS, da Costa JG, et al. Antioxidant capacity, physicochemical and floral characterization of honeys from the northeast of Brazil. Rev Virtual Quim. 2016;8:57–77.
- Mohdaly AA, Sarhan MA, Smetanska I, et al. Antioxidant properties of various solvent extracts of potato peel, sugar beet pulp and sesame cake. J Sci Food Agric. 2010;90(2):218–226.
- Aru B, Güzelmeric E, Akgül A, et al. Antiproliferative activity of chemically characterized propolis from Turkey and its mechanisms of action. Chem Biodivers. 2019;16(7):e1900189.
- Amalia E, Diantini A, Subarnas A. Water‑soluble propolis and bee pollen of trigona spp. from South sulawesi Indonesia induce apoptosis in the human breast cancer MCF‑7 cell line. Oncol Lett. 2020;20(5):274–284.
- Fatrcová-Šramková K, Nôžková J, Kačániová M, et al. Antioxidant and antimicrobial properties of monofloral bee pollen. J Environ Sci Health B. 2013;48(2):133–138.
- Karadal F, Onmaz NE, Abay S, et al. A study of antibacterial and antioxidant activities of bee products: propolis, pollen and honey samples. Ethiop J Heal Dev. 2018;32:116–122.
- Temiz A, Sener A, Ozkok TA, et al. Antibacterial activity of bee propolis samples from different geographical regions of Turkey against two foodborne pathogens, Salmonella enteritidis and Listeria monocytogenes. Turk J Biol. 2011;35:503–511.
- Yaghoubi SMJ, Ghorbani GR, Soleimanian ZS, et al. Antimicrobial activity of iranian propolis and its chemical composition. DARU. 2007;15:45–48.
- Abouda Z, Zerdani I, Kalalou I, et al. The antibacterial activity of moroccan bee bread and bee-pollen (fresh and dried) against pathogenic bacteria. Res. J. Microbiol. 2011;6:376–384.
- Carpes ST, Begnini R, De Alencar SM, et al. Study of preparations of bee pollen extracts, antioxidant and antibacterial activity. Ciênc Agrotec. 2007;31(6):1818–1825.
- Didaras NA, Karatasou K, Dimitriou TG, et al. Antimicrobial activity of bee-collected pollen and beebread: State of the art and future perspectives. Antibiotics. 2020;9(11):811–840.
- Nedji N, Loucif-Ayad W. Antimicrobial activity of algerian propolis in foodborne pathogens and its quantitative chemical composition. Asian pac. J Trop Dis. 2014; 4(6):433–437.
- Silici S, Kutluca S. Chemical composition and antibacterial activity of propolis collected by three different races of honeybees in the same region. J Ethnopharmacol. 2005;99(1):69–73.
- Velásquez P, Rodriguez K, Retamal M, et al. Relation between composition, antioxidant and antibacterial activities and botanical origin of multi-floral bee pollen. J Appl Bot Food Qual. 2017;90:306–314.
- Al-Ani I, Zimmermann S, Reichling J, et al. Antimicrobial activities of european propolis collected from various geographic origins alone and in combination with antibiotics. Medicine. 2018;5:2–17.
- Massaro CF, Simpson JB, Powell D, et al. Chemical composition and antimicrobial activity of honeybee (Apis mellifera ligustica) propolis from subtropical. Sci Nat. 2015; 102:68–79.
- Righi AA, Alves TR, Negri G, et al. Brazilian red propolis: Unreported substances, antioxidant and antimicrobial activities. J Sci Food Agric. 2011;91(13):2363–2370.
- Wang X, Sankarapandian K, Cheng Y, et al. Relationship between total phenolic contents and biological properties of propolis from 20 different regions in South Korea. BMC Complement Altern Med. 2016;16:65–77.
- Pełka K, Otłowska O, Worobo RW, et al. Bee bread exhibits higher antimicrobial potential compared to bee pollen. Antibiotics. 2021;10(2):125–139.
- Soares de Arruda VA, Vieria dos Santos A, Figueiredo Sampaio D, et al. Brazilian bee pollen: phenolic content, antioxidant properties and antimicrobial activity. J Apic Res. 2021;60(5):775–783.
- Kędzia B, Hołderna-Kędzia E. Aktywność antybiotyczna propolisu krajowego i europejskiego. The antibiotic activity of native and european propolis. Post Fitoter. 2013;2:97–107.