
Abstract
Optical coherence tomography angiography (OCT-A) is a noninvasive diagnostic method for three-dimensional visualization of the vascular structures of the retina and choroid. The aim of this study was to evaluate the diagnostic role of OCT-A preoperatively and postoperatively in vitreoretinal interface (VRI) pathologies, by determining the size of the foveal avascular zone (FAZ) in the superficial (SCP) and deep capillary plexus (DCP) and to compare these parameters with control (healthy) eyes. Medical records of 19 patients were prospectively analyzed: nine with a full-thickness macular hole (FTMH) and ten with an idiopathic epiretinal membrane (ERM). All participants underwent unilateral Pars Plana Vitrectomy, peeling of internal limiting membrane and fluid-gas exchange tamponade. The FAZ area of the SCP and DCP was statistically significantly different preoperatively and postoperatively at the 1st month in the FTMH group (0.5311 ± 0.276 mm2 vs. 0.4278 ± 0.257 mm2, p-value .000; 1.4822 ± 0.727 mm2 vs. 0.5856 ± 0.498 mm2 p-value .005). The mean preoperative FAZ in both plexuses was bigger compared to the control eyes. The FAZ area of the SCP and DCP was nonsignificantly different preoperatively and postoperatively in patients with ERM, despite a decrease in the mean FAZ area at the 1st month (0.3120 ± 0.1134 mm2 vs. 0.2300 ± 0.1158 mm2, p-value .150; 0.7100 ± 0.6607 vs. 0.5190 ± 0.5591 mm2, p-value .091). The results of this prospective study suggest that OCT-A is an effective and safe method in VRI pathologies, giving a valuable information for surgical outcome. Due to its high diagnostic value, the prognosis for the recovery of visual function after surgical treatment can be assessed.
Keywords:
Introduction
Optical coherence tomography (OCT) is a modern, noninvasive, clinical diagnostic method that allows retinal structures to be analyzed by three-dimensional imaging with high resolution [Citation1,Citation2]. In 1993, the introduction of OCT by Fujimoto J, Huang D, Izett J, Swanson E and Linn CP made it possible to assess the retinal and choroidal layers in details in real time [Citation3].
Optical coherence tomography angiography (OCT-A) is an additional module in which the advantages of structural OCT are combined with the ability to visualize the vascular structures of the retina and choroid. An advantage of the specific software is that the movement of blood cells can be detected [Citation4] and they can be differentiated from the surrounding tissues, without the need of fluorescent dyes and in three dimensions.
The interpretation of OCT-A analysis is based on parameters that determine the qualitative and quantitative perfusion status, in contrast to conventional methods such as fluorescein angiography (FA) and indocyanine green angiography (ICGA), which have less informative value. OCT-A is most commonly used in the assessment of neovascular retinal diseases, occlusive retinal pathology and diabetic retinopathy, but it also finds an important diagnostic role in nonprimary vascular retinal abnormalities of vitreomacular interface surgical disorders [Citation5].
In recent years, the OCT-A technology has emerged as a diagnostic tool of choice in a number of ophthalmic diseases such as diabetic macular edema and age related macular degeneration. Conversely, the method is increasingly used in idiopathic vitreoretinal pathologies – macular hole, epiretinal membrane (ERM) and vitreomacular traction syndrome (VMTS).
Visualization of the vascular retinal plexus through a layer-by-layer analysis, provides an opportunity to assess the superficial (SCP) and deep capillary plexus (DSP) preoperatively and postoperatively, revealing new important details that play a key role as a prognostic factor and the effect on retinal vascular network after macular surgery [Citation6].
The aim of this study was to evaluate the diagnostic role of OCT-A technology preoperatively and postoperatively in vitreoretinal interface (VRI) disorders, by determining the size of the foveal avascular zone (FAZ) in the superficial (SCP) and deep capillary plexus (DSP) and to compare these parameters with control (healthy) eyes.
Subjects and methods
Ethics statement
All patients gave informed consent for participation in this study.
Subjects
Two groups of consecutive patients were included in this prospective clinical study between March 2021 and August 2021. The first group − nine patients with a full-thickness macular hole (FTMH), and the second group − ten patients with an idiopathic epiretinal membrane (ERM).
The inclusion criteria were: presence of unilateral pathology; contralateral healthy eye with preserved visual function; absence of any previous intraocular or corneal surgery.
The exclusion criteria were: history of eye trauma; other retinal vascular disease; diabetic retinopathy; retinal venous occlusion; retinal detachment; inflammatory retinal; choroidal diseases.
Operative technique
All patients underwent unilateral 25-gauge 3-port Pars Plana Vitrectomy, trypan blue 0.15% staining, peeling of internal limiting membrane (ILM) and fluid-gas (SF6 20%) exchange tamponade. All cases were hospitalized at Eye Hospital ‘Zora’, Sofia, Bulgaria.
Methods
All patients underwent full ophthalmological examination preoperatively and one month after the procedure. Examinations included medical history, preoperative and postoperative assessment of best corrected visual acuity (BCVA), slit-lamp examination of the anterior and posterior segments, measurement of intraocular pressure, detailed fundus examination, FAZ area measurement of the superficial (SCP) and deep capillary plexus (DSP) of pathological and control (healthy eyes). High resolution OCTA images needed to visualize the smallest capillaries were obtained using Spectralis HRA + OCTA 10° × 10° (∼ 2.9 × 2.9 mm) scan pattern, 512 A-scans × 512 B-scans, Heidelberg Engineering, Heidelberg, Germany.
A comparative analysis of the preoperative and postoperative characteristics was performed in each of the two groups of patients, evaluating the diagnostic effectiveness of OCT-A.
Statistical analyses
All statistical analyses were performed using SPSS v.19.0 (SPSS Corporation, USA). The Fisher’s exact test and the Chi-squared test for comparing category variables and the Student’s t-test for comparing metric variables were applied. Differences were considered statistically significant at the level of p < .05.
Results
The first group included nine eyes of nine patients with FTMH. Demographically, the mean age of the observed patients was 66.11 ± 3.882 years, of which 33.3% male and 66.7% female. The right/left eye ratio was, respectively, 55.6%/44.4%. Preoperative OCT-A images demonstrated enlargement of the FAZ area in both superior (SCP) and deep capillary plexus (DCP) in pathological (study) eyes in comparison with the same parameters of the control (healthy eyes).
The preoperative mean values of superficial and deep FAZ area were 0.5311 ± 0.276 mm2 and 1.4822 ± 0.727 mm2, respectively. The mean value of the superficial and deep FAZ of the control eyes was 0.4477 ± 0.085 mm2 and 0.6077 ± 0.13745 mm2, respectively. The mean preoperative BCVA was 0.1367 ± 0.076 decimal. Only in one of the cases the macular hole defect persisted after the surgical treatment.
Comparing the FAZ area of the SCP and DCP a statistically significant difference was found preoperatively and postoperatively at the first month in the first group (0.5311 ± 0.276 mm2 vs. 0.4278 ± 0.257 mm2, p-value of .000; 1.4822 ± 0.727 mm2 vs. 0.5856 ± 0.498 mm2, p-value of .005; and ). There was also a statistically significant difference between preoperative and postoperative BVCA of the pathological eyes (0.1367 ± 0.076 decimal vs. 0.2789 ± 1.636 decimal, p-value of .006; ).
Figure 1. Preoperative (А) and postoperative (B) OCT + OCTA of SCP in а patient with FTMH. The structural OCT shows full thickness macular hole, and OCT-A images of SCP demonstrate enlargement of the FAZ area before surgery (А). The structural OCT shows the closure of macular hole after the surgery, and OCT-A images of SCP demonstrate reduction in the size of the FAZ area (B). Note: OCT: optical coherence tomography; OCTA: optical coherence tomography angiography; FTMH: full thickness macular hole; SCP: superficial capillary plexus; FAZ: foveal avascular zone.
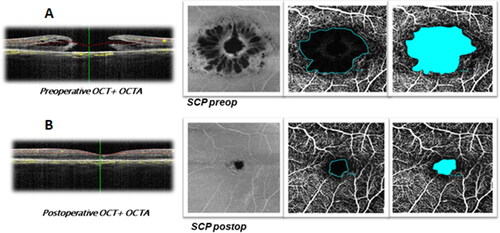
Figure 2. Preoperative (A) and postoperative (B) OCTA of DCP in a patient with FTMH. OCT-A images of DCP demonstrate enlargement of the FAZ area before surgery (A) and reduction in the FAZ area after surgery (B). Note: OCT: optical coherence tomography; OCTA: optical coherence tomography angiography; DCP: deep capillary plexus; FAZ: foveal avascular zone.
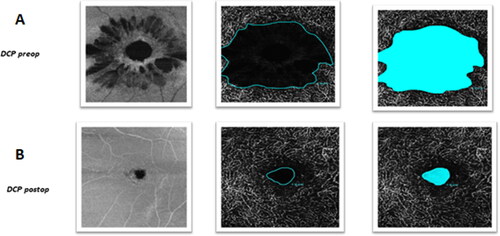
Table 1. Comparative characteristics before and after MH surgery.
At the first postoperative month, a reduction in the FAZ area of SCP and DCP was found in study eyes compared with control eyes, respectively (0.4278 ± 0.257 mm2 vs. 0.4477 ± 0.085 mm2, p-value of .833; 0.5856 ± 0.498 mm2 vs. 0.6077 ± 0.13745 mm2, p-value of .901; ).
Table 2. Comparative characteristics of operated and control eyes 1 month after MH surgery.
The second group included 10 eyes of 10 patients with an idiopathic ERM. The demographic mean age of the studied patients was 67.5 ± 6.50 years of which 30.0% male and 70.0% female. The right/left eye ratio was, respectively, 60%/40%.
The ERM was successfully removed in all patients. No complications were observed during the intra-operative and postoperative period.
Using preoperative OCT-A images both capillary plexuses (SCP and DCP) in pathological eyes were compared with the same parameters of control (healthy eyes). The preoperative mean values of the superficial and deep FAZ area were 0.3120 ± 0.1134 mm2 and 0.7100 ± 0.6607 mm2, respectively. The mean value of the superficial and deep FAZ area of the control eyes was 0.3480 ± 0.0892 mm2 and 0.4170 ± 0.1589 mm2, respectively. The mean preoperative BCVA was 0.205 ± 0.11168 decimal.
The postoperative OCT-A analysis of the above parameters was performed in the first postoperative month. The mean postoperative FAZ area value in SCP and DCP was measured to be 0.2300 ± 0.1158 mm2 and 0.5190 ± 0.55916 mm2, respectively. The mean postoperative BCVA was 0.4250 ± 1.4767 decimal. Comparing the FAZ area of the superficial and deep capillary plexus, no statistically significant difference was found preoperatively and postoperatively in the patients with epiretinal membrane, despite decreasing in the mean FAZ area at first month (0.3120 ± 0.1134 mm2 vs. 0.2300 ± 0.1158 mm2, p-value of .150; 0.7100 ± 0.6607 mm2 vs. 0.5190 ± 0.5591 mm2, p-value of .005; ). There was also a statistically significant difference between preoperative and postoperative BVCA of the pathological eyes (0.205 ± 0.111 decimal vs. 0.425 ± 1.476 decimal, p-value .001; ).
Figure 3. Preoperative (A) and postoperative (B) OCT + OCTA of SCP in a patient with ERM. The structural OCT shows ERM with cystoid intraretinal changes and absence of foveal pit, and preoperative OCTA of SCP demonstrate distotsion and reduction in the FAZ area before surgery (A). Structural OCT shows residual intraretinal changes after ERM removal (B). Note: OCT: optical coherence tomography; OCTA: optical coherence tomography angiography; SCP: superficial capillary plexus; FAZ: foveal avascular zone.
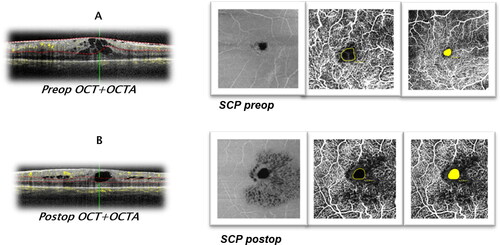
Table 3. Comparative characteristics before and after surgery for ERM removal.
At the first postoperative month, a reduction in the FAZ area of SCP was found in the study eyes compared with the control eyes, respectively (0.230 ± 0.115 mm2 vs. 0.3480 ± 0.0892 mm2, p-value .054; ).
Table 4. Comparative characteristics of operated and control eyes 1 month after surgery for ERM removal.
Discussion
The introduction of diagnostic methods in our clinical practice for preoperative assessment and postoperative control in patients undergoing vitreoretinal surgery is extremely important for the quality of the intervention and the visual outcome. The use of OCT-A increased the diagnostic value in vitreomacular disorders, leading to better judgment in treatment, classification of visualization, examination and monitoring of the vitreomacular interface with increased accuracy by ophthalmologists [Citation7,Citation8]. ERM and FTMH are common causes of impaired visual function, especially in patients above 60-year old. According to publication data in the United States, the incidence of this type of pathology is up to 34% for ERM and 4% for FTMH [Citation9]. In recent years, many studies searched for prognostic factors that give precise answers about the postoperative quality of vision, despite the successful surgical and anatomical results.
FTMH is a foveal defect, involving all neuroretinal layers and leading to loss of central vision with metamorphopsia and distortion. PPV with peeling of MLI provides anatomical closure in 90–95% of cases. The stage and size of a macular hole, duration of symptoms, preoperative visual acuity, retinal sensitivity and fixation status are considered as preoperative factors that are relevant to visual function after PPV [Citation10–13]. However, these factors are not highly predictable for visual results after surgical treatment. For this reason, several studies have identified OCT-A as an innovative technique for functional assessment of macular holes before and after surgery [Citation6].
In our study, the OCT-A images demonstrated enlargement of the FAZ area in both superior and deep capillary plexus before PPV surgery. At the first postoperative month, a smaller FAZ area was found in all study eyes. Baba et al. revealed that the FAZ area measured by OCT-A became significantly smaller after the closure of the macular hole and also significantly smaller than that of the control eye, especially the SCP [Citation14]. Our results are similar to those in previously published studies of Baba et al. [Citation14]. The cause and effect between good visual results and smaller FAZ area are not yet still defined. Kim et al. suggest that a smaller FAZ area contains more neural tissue which is the cause for better central visual function [Citation15]. Correlation between visual acuity and the FAZ area of SCP and DCP are significant 6 months after initial surgery [Citation16].
In a recent report by Tsuboi et al., early reduced FAZ area after MH surgery, returns to a normal value after a period of time [Citation17]. In addition, increasing of the FAZ area postoperatively correlates with photoreceptor recovery and changes in visual acuity.
Conversely, the introduction of OCT-A significantly improved our knowledge in patients with idiopathic ERM. This is a pathology of the retina characterized by the formation of abnormal tissue on the macular surface [Citation18]. The use of this type of imaging showed that the FAZ of SCP and DCP measured postoperatively by OCT-A was smaller in patients from ERM group. Despite the short follow-up period, we found a statistically significant difference in terms of preoperative and postoperative visual acuity. Through the use of OCT-A, Baba et al. demonstrated that the size of the FAZ area postoperatively was smaller in all examined eyes [Citation19]. The authors performed the study on 17 patients (eyes), who underwent PPV with MLI peeling. These results correspond to those reported in our study. It is essential that reduction in size persists even 12 months after surgery. In another study, Kim et al. reported 43 patients with idiopathic ERM in which pathological eyes had low vascular perfusion and lower FAZ after macular surgery [Citation15]. At the first postoperative month, there were no significant differences of FAZ in the two vascular plexuses compared to that of the control eye in follow-up patients, although we found a reduction in SCP zone. Possibly, the result is due to the earlier follow-up.
In our study, there are some limitations. First, the postoperative follow-up period of the patients in both groups was relatively short. Second, to assess postoperative vision improvement, we used only the BCVA index. Third, our study covered a short period of time in a small number of eyes. Therefore, further studies are needed to confirm our surgical and visual observations in regard to long-term prognosis.
Conclusions
OCT-A is a noninvasive and easily accessible diagnostic tool for simultaneous structural and vascular assessment of the retina and choroid. Due to its high safety and efficacy, it can also be used in pathological processes of the retina without vascular etiology like idiopathic vitreoretinal syndrome. Since vitreoretinal surgery is the ‘gold’ standard for treatment, OCT-A imaging is gaining clinical popularity for providing accurate preoperative prognostic biomarkers information. The role of OCT-A in VRI pathologies is not yet clearly defined. Further studies are needed in specialized ophthalmic centers to evaluate the usefulness of this technology. The results of this prospective study showed that OCT-A is an effective and safe method in patients with pathologies like FTMH and ERM giving a valuable information about the preoperative and postoperative surgical outcome. Due to its high diagnostic value in clinical practice, the method can assess the prognosis for the recovery of visual function after surgical treatment.
Disclosure statement
The authors have no conflicts of interest to declare.
Data availability statement
The data supporting the findings of this study are available from the authors upon reasonable request.
Funding
The author(s) reported there is no funding associated with the work featured in this article.
References
- Huang D, Swanson EA, Lin CP, et al. Optical coherence tomography. Science. 1991;254(5035):1178–1181.
- Wojtkowski M, Leitgeb R, Kowalczyk A, et al. In vivo human retinal imaging by Fourier domain optical coherence tomography. J Biomed Opt. 2002;7(3):457–463.
- Kim DY, Fingler J, Zawadzki RJ, et al. Optical imaging of the chorioretinal vasculature in the living human eye. Proc Natl Acad Sci USA. 2013;110(35):14354–14359.
- Fang PP, Harmening WM, Müller PL, et al. Technical principles of OCT angiography. Ophthalmologe. 2016;113(1):6–13.
- Bacherini D, Mastropasqua R, Borrelli E, et al. OCT-A in the management of vitreoretinal diseases and surgery. Asia Pac J Ophthalmol (Phila). 2021;10(1):12–19.
- Bacherini D, De Luca M, Rizzo S. Optical coherence tomography angiography in vitreoretinal interface disorders. Minerva Oftalmol. 2018;60(3):137–143.
- Stevenson W, Prospero Ponce CM, Agarwal DR, et al. Epiretinal membrane: optical coherence tomography–based diagnosis and classification. Clin Ophthalmol. 2016;10:527–534.
- Meuer SM, Myers CE, Klein BEK, et al. The epidemiology of vitreoretinal interface abnormalities as detected by spectral domain optical coherence tomography: the beaver dam eye study. Ophthalmology. 2015;122(4):787–795.
- Ullrich S, Haritoglou C, Gass C, et al. Macular hole size as a prognostic factor in macular hole surgery. Br J Ophthalmol. 2002;86(4):390–393.
- Stec LA, Ross RD, Williams GA, et al. Vitrectomy for chronic macular holes. Retina. 2004;24(3):341–347.
- Kusuhara S, Negi A. Predicting visual outcome following surgery for idiopathic macular holes. Ophthalmologica. 2013;109:654–659.
- Sun Z, Gan D, Jiang C, et al. Effect of preoperative retinal sensitivity and fixation on long-term prognosis for idiopathic macular holes. Graefes Arch Clin Exp Ophthalmol. 2012;250(11):1587–1596.
- Ruiz-Moreno JM, Staicu C, Piñero DP, et al. Optical coherence tomography predictive factors for macular hole surgery outcome. Br J Ophthalmol. 2008;92(5):640–644.
- Baba T, Kakisu M, Nizawa T, et al. Superficial foveal avascular zone determined by optical coherence tomography angiography before and after macular hole surgery. Retina. 2017;37(3):444–450.
- Kim YJ, Jo J, Lee JY, et al. Macular capillary plexuses after macular hole surgery: an optical coherence tomography angiography study. Br J Ophthalmol. 2018;102(7):966–970.
- Michalewska Z, Nawrocki J. Swept-source optical coherence tomography angiography reveals internal limiting membrane peeling alters deep retinal vasculature. Retina. 2018;38(1):S154–S160.
- Tsuboi K, Fukutomi A, Sasajima H, et al. Visual acuity recovery after macular hole closure associated with foveal avascular zone change. Transl Vis Sci Technol. 2020;9(8):20.
- Inoue M, Kadonosono K. Macular diseases: epiretinal membrane. Dev Ophthalmol. 2014;54:159–163.
- Baba T, Kakisu M, Nizawa T, et al. Study of foveal avascular zone by OCT-A before and after idiopathic epiretinal membrane removal. Spektrum Augenheilkd. 2018;32(1):31–38.