
Abstract
Transcriptional factors play an essential role in the regulation of developmental processes in plants. GRAS family transcription factors are plant specific, and GRAS members possess multiple functions involved in plant growth and in response to abiotic and biotic stress. The members are divided into several subgroups. This study is focused on one particular member, MtGRAS7, which belongs to the PAT subgroup. Based on constructed stable transgenic plants with a gain and loss of function of MtGRAS7, the phenotype of transgenic plants was described compared to control wild-type Medicago trucatula. The involvement of the gene in the response to abiotic stress – drought (350 mmol/L mannitol), salinity (150 mmol/L NaCl) and cold (temperature of 4 °C), was analyzed and its transcript level was detected in leaves and nodules at different time points during the exposure to stress and after the stress. The overexpression of the gene benefits plant during the stress and later on in the recovery period.
Introduction
In plants, transcription factors (TFs) are important in the regulation of various developmental and physiological processes. The GRAS family of plant-specific TFs plays many roles in plant growth and development, for example, in the response to different stress conditions as well as in the process of nitrogen fixation and arbuscular mycorrhizal symbiosis [Citation1–5]. The abbreviation GRAS stands for the first three members of this family: GAI (gibberellic acid insensitive) [Citation6], RGA (repressor of GAI) [Citation7] and SCR (scarecrow) [Citation8]. Most GRAS TFs contain 400–770 amino acid residues with a conserved C-terminus [Citation9], but variable N-terminus [Citation10]. There are several subfamilies of GRAS proteins based on sequence homology and functional similarity: DELLA, SCR, PAT1, HAM, LS, SHA and SCL9, LISCL. Each one has a different conservative domain and functions [Citation9,Citation11]. GRAS TFs play important role in root and stem development, phytohrome-A signal transduction (PAT), gibberellic acid signal transduction (GA) and disease resistance [Citation1,Citation10]. Their upregulation occurs in high-salt and drought conditions [Citation12] and in response to various plant diseases [Citation13]. Functional characterization of many GRAS genes emphasized their involvement during different signalling pathways including gibberellic acid (GA) signalling [Citation6], brassinosteroid (BR) signalling [Citation4,Citation14], shoot and axillary meristem maintenance [Citation15,Citation16], radial organization of the root and shoot [Citation17], phytochrome signal transduction [Citation18] and promote G2/M progression of the cell cycle [Citation19].
In silico analysis identified 68 MtGRAS genes, classified into 16 groups, localized in 8 chromosomes [Citation2]. The authors analyzed the expression profile of these genes in plants exposed to different abiotic stress factors. By using the Phytozome (htttp//phytozome.jgi.doe.gov) database and blast analyses, we found that the MtGRAS gene investigated by us (previously identified by Tnt1 insertion mutagenesis [Citation20] and later cloned) corresponds to one of the genes reported by Song et al. [Citation2], MtGRAS7 (Medtr2g026250), a member of the PAT subgroup. In the frame of FP6 of the European Union GRAIN LEGUMES integrated project, our team was a part of WP5.2, responsible for the development of Medicago truncatula Tnt1 insertion mutant collection [Citation21]. Screening of randomly selected mutant lines from the Tnt1 insertion mutant collection by transposon display (TD) confirmed the presence of new insertions of the Tnt1 retrotransposon. Sequencing identified the plant genomic region that borders the Tnt1 (Flanking Sequence Tag, FST). Some of the insertions were in the coding sequences of different genes, including MtGRAS TF, which partially correspond to insert 6 of line So5945 [Citation20] or Medtr2g026250 MtGRAS7 TF, (http//phytozome.jgi.doe.gov).
The gene was cloned and vectors for overexpression and downregulation of MtGRAS7 were constructed via Gateway technology (Invitrogen Life Technologies, Inc., [Citation22]). Transgenic M. truncatula plants with gain- and loss-of-function were obtained via Agrobacterium-mediated transformation as described [Citation23].
The main objective in the present research was to employ overexpression (OE) and RNA interference (RNAi) strategies to analyze the plant phenotypes caused by MtGRAS7 overexpression or downregulation and its role in the response of abiotic stress – salinity, drought and cold.
Materials and methods
Cloning and construction of expression clones for transformation
For construction of vectors for transformation, we used a previously described protocol [Citation24], with some modifications. To obtain lines with gain of function of MtGRAS7, the full-length open reading frame (ORF) of the gene was introduced into the pDONR221 donor vector. The constructed entry clone was transferred into the pK7WG2 binary destination vector for overexpression, under the control of the CaMV 35S promoter and nptII gene for plant selection [Citation25]. Loss-of-function transgenic lines were created through the RNAi method [Citation26]. The pK7GWIWG2D (II) hairpin RNA expression vector was used to create an RNAi construct using 266 bp from mRNA corresponding to nucleotide positions 92–358 bp of the ORF of MtGRAS. The expression clones were introduced into Agrobacterium tumefaciens strain C58C1, which was maintained on agar-solidified (1.5%) YEB nutrient medium supplemented with 100 mg/L rifampicin (Rif), 100 mg/L spectinomycin (Sp) and 50 mg/L gentamycin (Gm). Primer 3 software program was used to design primers for cloning the gene of interest and for further expression analyses (Supplemental Table S1).
Plant material and genetic transformation
Seeds from the highly regenerable genotype M. truncatula ‘Jemalong 2HA’ [Citation27] were surface sterilized as described by Revalska et al. [Citation23], and seedlings were germinated on Murashige and Skoog basal medium [Citation28]. In vitro plant materials were grown in a growth chamber at 24 °C, with a 16-h photoperiod and light intensity of 350 μmol/m2 s. Transgenic lines with modified expression were obtained via the Agrobacterium-mediated method of leaf disks, by using combined protocols published previously [Citation21,Citation29,Citation30].
Transgenic plants were obtained via indirect somatic embryogenesis that includes the formation of callus tissue, embryo induction, development and conversion [Citation23]. When putative transgenic plants started to form, the roots were screened by polymerase chain reaction (PCR) amplification for the presence of the nptII gene for Km resistance. The following gene-specific primers were used to amplify a 550 bp fragment: FW 5′-GAACAAGATGGATTGCACGC-3′ and REV 5′-GAAGAACTCGTCAAGAAGGC-3′. Positive plants were moved into a greenhouse for seed production. A pool of T1 seeds from independent overexpression MtGRAS7OE and downregulated MtGRAS7RNAi lines and seeds from wild-type (WT) plants of M. truncatula were surface sterilized according to the protocol by Revalska et al. [Citation23]. The seeds were placed in Petri dishes on Murashige and Skoog (MS) basal medium supplemented with 50 mg/mL Km in darkness at 4 °C for 48 h. The progeny was grown for 22 days under in vitro conditions: temperature 23–24 °C, relative humidity 70%–80%, photoperiod 16/8 h (day/night), light intensity 150–300 mol/m2 s.
Quantitative real-time PCR analysis
Total RNA was extracted from transgenic lines with modified expression MtGRAS7OE, MtGRAS7RNAi and WT plants, using the RNeasy Plant Mini Kit (EurEx). An equal amount of 1 μg of total RNA was reverse transcribed with the First Strand cDNA Synthesis Kit (BioRad). Relative expression levels were determined with the 7300 Real-Time PCR System (Applied Biosystems, http://www. appliedbiosystems. com). The quantitative real-time PCR (qRT-PCR) was carried out in a total volume of 20 μL containing 5 μL of cDNA, 0.5 μL gene-specific primers (10 μmol/L), 10 μL SYBR Green Mix (Bio-Rad) and 4 μL of RNase-free ddH2O. The PCR conditions were as follows: 95 °C for 5 min, followed by 40 cycles of 95 °C for 15 s and 60 °C for 30 s. Two different reference genes (ACTIN and UBIQUITIN10) were used for normalization. qRT-PCR analysis was performed in three biological replicates with three technical replicates each. The MtGRAS7 transcript level was analyzed in T1 lines.
Phenotypic analysis
Phenotypic and morphological analysis of the transgenic plants with modified expression was performed in vivo, in greenhouse and in hydroponic conditions and compared to the WT M. truncatula ‘Jemalong 2HA’. Assessment of plant architecture, root system morphology and number of nodules (N), flowers (F) and seeds (S) and seed weight were taken into account. Each set of plant genotypes MtGRAS7OE, MtGRAS7RNAi were presented by three independent lines and three WT plants.
Growing legume plants under hydroponic conditions
Three selected MtGRAS7OE and MtGRAS7RNAi lines and WT plants were transferred to the hydroponic containers containing commercial nutrient solution under constant light and aeration, pH 5.8, temperature 23–24 °C and relative humidity of 70%–80%. The composition of the nutrient solution was as follows: 2 mL/L Dutch formula – Advanced hydroponics of Holand − 2 Bloom; 200 mL/L MicroMix-Bio Nova (Premium Fertilizers); 10 mL/L CaCl2×2H2O. Ten days later, the plants were inoculated with Sinorhizobium meliloti 1021 (2 × 10⁸ cells mL) by adding the bacterial suspension to hydroponic containers. The nutrient solution was changed once a week. Samples from different plant parts were taken from 50- to 60-day-old plants. Analysis was performed in three biological repeats with three technical repeats each.
Applying abiotic stress under salinity, drought and cold conditions
Independent sets of plant genotypes MtGRAS7OE, MtGRAS7RNAi and WT were used for different treatment. Approximately 50–60 days (until symbiotic nodules developed), the plants were transferred to flasks containing commercial solution mentioned earlier, supplemented with 0, 50, 150 mmol/L NaCl. The flasks with commercial solution supplemented with 0, 180, 350 mmol/L mannitol were used for applying drought stress. Samples of nodules and leaves were taken for analyses in the following time points 0, 24, 48, 72 h after treatment. For the cold stress, a temperature of 4 °C was applied (on 50–60 days old plants) in flasks with commercial solution that were transferred to the refrigerator for 0, 72 h and 7 days. After 7 days of cold treatment, the flasks with plants were transferred to 23–24 °C for recovery for one week. Samples of leaves were taken for analyses in the following time points 0, 72 h, 7 days and after period for recovery.
Statistical analysis
All experiments were repeated three times and triplicate assays were performed for each experimental dataset. The data from qRT-PCR were analyzed by using qBase v1.3.5 software and the results were expressed as mean values with standard error of the mean (±SEM). Phenotypic data were expressed as mean values with standard deviation (±SD), n = 3. Differences were assessed by t test and were considered statistically significant at the level of p < 0.05.
Results
In the present research, we investigated the expression pattern of GRAS transcription factor from M. truncatula (Medtr2g026250, PLAZA 4.5 Dicots). According to the database PLAZA 4.5 Dicots, MtGRAS belongs to the gene family ORTHO04D000839, which consists of six genes in M. truncatula (PLAZA 4.5 the orthologous genes Medtr2g026250 and Medtr2g082090 in chromosome 2, Medtr3g056110 in chromosome 3, Medtr4g133660 in chromosome 4, Medtr5g094450 and Medtr5g097480 in chromosome 5). The Medtr2g026250 gene is annotated as a GRAS family transcription factor. All six orthologue genes contain GRAS domains and are involved in DNA-dependent regulation of transcription. The function of MtGRAS has not been studied in stable transgenic plants of M. truncatula previously. In this study, transgenic lines with modified expression MtGRAS7OEand MtGRAS7RNAi were compared to WT and later on were used to understand the involvement of this gene in the response to abiotic stress.
Expression profile of MtGRAS7 in M. truncatula T1 overexpression and knockdown lines
The transcript level of MtGRAS7 was determined in 14 independent T1 MtGRAS7OE and 13 T1 MtGRAS7RNAi lines () and the expression profile of three selected lines are presented in . The expression level in MtGRAS7OE lines (15, 17, 29) of M. truncatula was significantly higher than in the WT (p < 0.001) (). In the investigated RNAi lines (39, 43, 44), the expression level was lower than in the WT (p < 0.01), (). These selected transgenic lines were used for further functional analyses.
Figure 1. Relative transcript level in T1 transgenic lines with modified expression MtGRAS7OE (A) and MtGRAS7RNAi (B) compared to WT plants. Data represent the mean values ± SEM (n = 3). Asterisks indicate statistically significant differences compared to the control: **p < 0.01; ***p < 0.001.
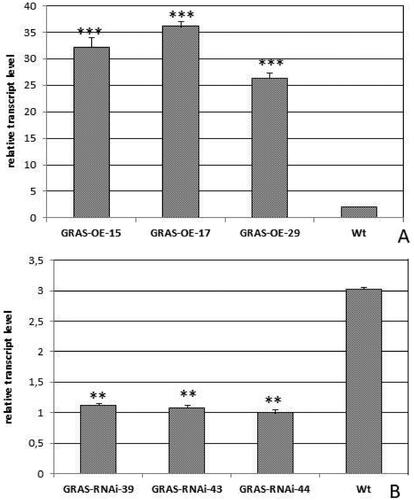
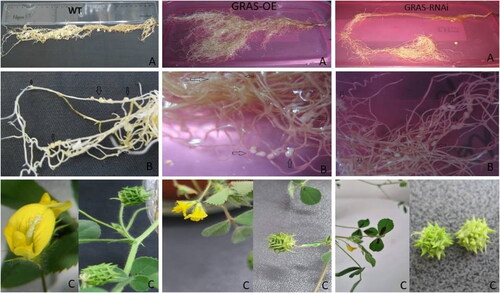
Figure 2. Phenotype comparison of T1 transgenic lines with modified expression MtGRAS7OE and MtGRAS7RNAi compared to WT plants. Shape of root in WT, GRAS-OE and GRAS-RNAi (A); distribution of nodules in WT, GRAS-OE and GRAS-RNAi (B); shape of flowers and pods in WT, GRAS-OE and GRAS-RNAi (C).
Phenotypic assessment of M. truncatula transgenic plants with modified expression compared to WT
To identify the function of the MtGRAS7 gene and its role in plant development, we grew T1 transgenic and control plants in vivo in a greenhouse and in hydroponic conditions. Phenotypic characterization was performed for three independent transgenic lines compared to the WT. MtGRAS7OE plants possessed a primary root with multiple secondary branches ((A), middle panel) compared to 2HA control plants ((A), right panel) and MtGRAS7RNAi ((A), left panel). In MtGRAS7RNAiplants, we observed long root systems with thinner secondary branches at the end of the root ((A), left panel).
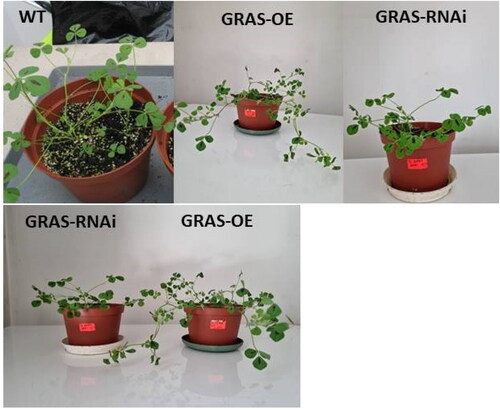
When grown in pots in greenhouse conditions, M. truncatula plants that overexpressed GRAS had a faster growth rate than the WT plants and had a well-developed aerial part with many branches compared to WT and knockdown plants, which were smaller than WT ().
Figure 3. Plant architecture of T1 transgenic lines with modified expression MtGRAS7OE and MtGRAS7RNAi compared to WT plants.
Hydroponically cultivated GRASOE plants possessed root systems with multiple scattered effective nodules/Nod++/(, middle panel). In GRASRNAi plants, the number of nodules/Nod++/was less and they were concentrated at the end of the root. The number of nodules/Nod++/observed in WT was less than in GRASOE plants and they were spread mostly at the end of the root or higher in the upper part of the root. Supplemental Table S2 summarizes the number of nodules, flowers, green pods, mature pods, seeds and weight of 50 seeds of T1 OE and RNAi lines of the model legume compared to the WT. The flowers of the investigated plant phenotypes were also distinguishable. Control plants (WT) formed flowers of a normal size and shape (, left panel). The flowers in GRASOE plants in most of the cases were double (, middle panel), and GRASRNAi plants formed flowers of a smaller size than GRASOEand WT and always single. The developed green pods in GRASOE were smaller than in WT and GRASRNAi with long thin hooks on their surface, whereas in GRASRNAithe pods possessed shorter and thicker hooks than GRASOE and WT. The number of obtained seeds was significantly higher in GRASRNAi compared to GRASOE and less than in WT. The weight of 50 seeds from GRASRNAi was higher than those of GRASOE and less than the weight of 50 seeds from WT. It should also be noted that almost half of the formed seeds of GRASOE resembled flakes, which means they are not able to germinate (Supplemental Table S2).
Expression profile of MtGRAS7 in T1 OE and RNAi plants of M. truncatula and 2HA WT after stress induction with mannitol
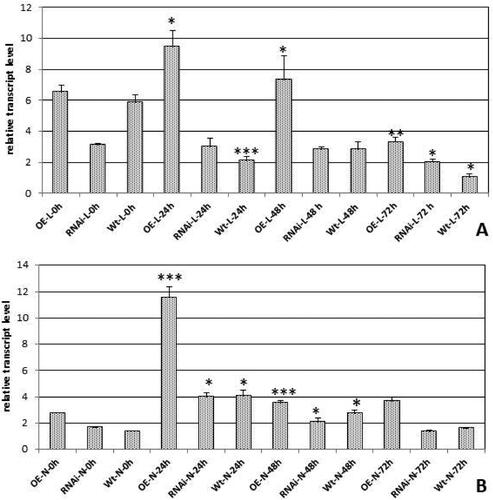
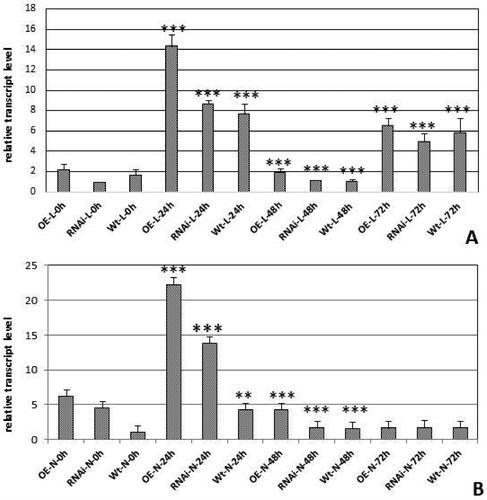
The abiotic stress that simulates drought was obtained with mannitol in two concentrations 180 mmol/L; 350 mmol/L and four durations of drought treatment 0; 24; 48 and 72 h. The treatment with the 180 mmol/L mannitol produced less pronounced results, so the experimental work was focused on higher concentration. The plant material from leaves and nodules was collected for all four durations of treatment and expression analyses were performed for the higher concentration (350 mmol/L) of the stress agent. shows the results of the detected expression in leaves and nodules. The obtained expression profiles for leaves indicated upregulation of expression for 24 h only in GRASOE plants (p < 0.05), whereas in WT the expression dropped down (p < 0.001), and in GRASRNAi plants it remained the same. At the time points of 48 h and 72 h, the expression dropped down for all of the tested plant backgrounds. In the nodules for the time point 24 h, the expression level was upregulated in GRASOE, GRASRNAi and WT plants and tended to go down for further 48 and 72 h.
Figure 4. Relative transcript level of MtGRAS7 in T1 transgenic lines with modified expression of MtGRAS7OE and MtGRAS7RNAi compared to WT plants after stress induced by 350 mmol/L mannitol treatment for 0, 24, 48 and 72 h. Leaves (A); Nodules (B). Data represent the mean level of expression of three independent transgenic lines and three control plants ± SEM. *p < 0.05; **p < 0.01; ***p < 0.001.
Expression profile of MtGRAS7 in T1 OE and RNAi plants of M. truncatula and 2HA WT after stress induction with NaCl
The salinity stress was obtained with treatment with NaCl in three concentrations 0; 50 mmol/L and 150 mmol/L and four durations of treatment 0; 24; 48 and 72 h. The concentration of 50 mmol/L NaCl solution was not effective enough to induce stress. The material from leaves and nodules was collected for all four durations of treatment and expression analyses were performed for the higher concentration (150 mmol/L) of the salinity agent. ) shows the expression level of the investigated GRAS gene in leaves and nodules. The obtained expression profiles in leaves indicated high upregulation of expression for 24 h. For GRASOE we detected a 7 times upregulation; 8 times for GRASRNAi and more than 4 times for WT leaves. The expression level in GRASRNAi leaves was almost equal to that in WT leaves. At the time point of 48 h, the expression level went down significantly in all the tested genotypes and again rose up at 72 h of treatment. The expression levels in the nodules were different: in the first 24 h of treatment the expression increased even in GRASRNAinodules, and was higher than in the WT. The expression significantly dropped down for further 48 and 72 h and remained almost equal in GRASOE, GRASRNAi and WT backgrounds ().
Figure 5. Relative transcript level of MtGRAS7 in T1 transgenic lines with modified expression MtGRAS7OE and MtGRAS7RNAi compared to WT plants after stress induced by 150 mmol/L NaCl treatment for 0, 24, 48 and 72 h. Leaves (A); Nodules (B). Data represent the mean level of expression of three independent transgenic lines and three control plants ± SEM. **p < 0.01; ***p < 0.001.
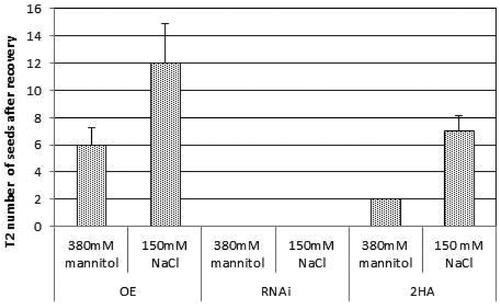
After the applied salinity and drought test (), the treated plants were transferred to the greenhouse to trace further the plant development and the potential of transgenic lines with modified expression and control for seeds production. The recovery and seed production were obtained only for MtGRAS7OE and WT plants. The treated MtGRAS7RNAi transgenic lines were not able to survive. The data collected for number of obtained seeds are presented in .
Figure 6. Seed production of MtGRAS7OE transgenic lines with modified expression and control 2HA-Wt after application of drought and salinity stress.
Expression profile of MtGRAS7 in T1 OE and RNAi plants of M. truncatula and 2HA WT after applied cold stress
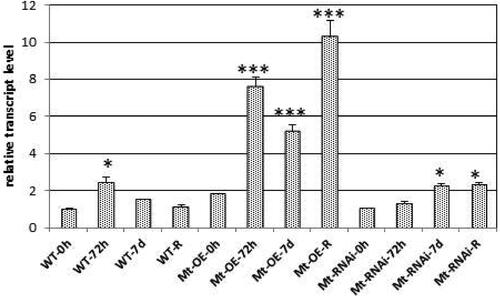
The cold stress was obtained via treatment with temperature of 4 °C for three time points 0, 72 h and 7 days and after the last time point the plants passed the recovery period of one week and again samples for analyses were taken. The results clearly indicated a rise in the expression in GRASOE and WT leaves and a very small increase in GRASRNAiplant tissue after 72 h of treatment compared to time point 0 h. The expression of the GRAS gene slowly dropped down in GRASOEand WT tissue for the next 7 days, while it slowly went up in GRASRNAiplant tissue and remained the same for the period of recovery compared to time point 0 h. Only in GRASOE lines there was very significant upregulation for the period of recovery (). After the period of recovery, the plants were transferred to the greenhouse to monitor their development. Out of three independent lines of GRASOE and GRASRNAi, two survived and only one plant from the set of WT. The data for the number of flowers, green pods, mature pods, number of seeds and weight of seeds collected from the survived plants are presented in Supplemental Table S3.
Figure 7. Relative transcript level of MtGRAS7 in T1 transgenic lines with modified expression MtGRAS7OE and MtGRAS7RNAi compared to WT plants after stress induced by cold (4 °C) for 0 h, 72 h and 7 days; R, recovery period of one week. Data represent the mean level of expression of three independent transgenic lines and three control plants ± SEM. *p < 0.05; ***p < 0.001.
Discussion
In plants, GRAS transcription factors play essential roles in the regulation of growth and development, and the members of the family possess high functional diversity in M. truncatula model legume species, soybean, sorghum, rose, rice [Citation2,Citation4,Citation31–33]. In the present study, we performed a functional characterization of one of a GRAS family member (MtGRAS7) by using the gain- and loss-of-function M. truncatula stable transgenic plants. The features of the MtGRAS7 gene, including phenotypic characterization, expression profiles and responses to various abiotic stresses were traced.
By Agrobacterium-mediated genetic transformation, stable transgenic plants with GRAS7 overexpression and RNAi-mediated downregulation were generated for the model legume M. truncatula. The transgenic plants were grown under in vivo conditions in a greenhouse and as hydroponic cultures. The experiments were performed with T1 stable transgenic plants of M. truncatula and control wild-type plants.
Transcript analyses of T1 independent transgenic lines of M. truncatula showed high levels of GRAS7 expression in the OE lines and very low levels in the lines with GRAS7 downregulation. The stable transgenic plants with GRAS overexpression and downregulation were phenotypically different from the control plants. The transgenic MtGRASOE lines developed a massive root system with multiple secondary branches () and scattered nodules, whereas the root in the control and MtGRASRNAiplants was long and thin with branches only at the end. The aerial part of the MtGRASOE plants was also distinguishable from the MtGRASRNAi and control plants. There were differences in the flowers, pods and number of seeds. RNA-seq data demonstrated that more than half (30/59) of the MtGRAS genes displayed the highest expression in the nodule and root, including the MtGRAS7 gene investigated by us, whereas the other members were preferentially expressed in blades, buds, flowers and roots [Citation11]. In our previous study [Citation34] by using transcriptional reporter plants we traced the expression of the GUS gene under the control of GRAS7 promoter and were able to detect the signal also in the leaves, petiole, stem, flowers, flower bed, calix, petals, stigma, anthers of stamens and pollen ().
The results from the phenotyping of transgenic lines with modified expression and control plants indicated that the number of produced seeds in MtGRASRNAi lines was higher than in MtGRASOE lines. The quality and weight of the seeds were also higher in the knockdown lines. In our study, the upregulation of MtGRAS7 transcription factor negatively affected the process of seed development. The inhibitory effects of some transcription factors were also described by other authors. In barley aleurone, two transcription factors belonging to the myb and NAC gene families, HSImyb and HSINAC were reported to be negative regulators of the gibberellin response in the HvSPY-signaling pathway [Citation35]. According to the study by Li et al. [Citation36], overexpression of two transcription factors, CFLAP1 or CFLAP2, led to expressional changes of genes involved in fatty acids, cutin and wax biosynthesis pathways and caused multiple cuticle defective phenotypes such as organ fusion, breakage of the cuticle layer and decreased the epicuticular wax crystal loading in Arabidopsis thaliana. Another two transcription factors, WRKY11 and WRKY17, act as negative regulators of basal resistance to Pseudomonas syringae pv tomato in A. thaliana [Citation37]. There are many open questions regarding how the overexpression of MtGRAS7 negatively influenced the seed formation and development, and more experimental work should be done to find the mechanism of negative correlation. Apparently, the phenotypic deviations from the control observed in lines with modified expression confirmed the participation of the GRAS gene in plant growth and development.
The results obtained in this study and published to date suggest that the functions of MtGRAS genes are highly divergent. Research has shown that GRAS genes take part in the response to abiotic stresses, such as cold, drought, salt and heat. The overexpression of a popular GRAS gene, PtSCL7, enhanced the tolerance to salt and drought stress in A. thaliana [Citation12]. Another gene, SCL14 participates in the activation of the detoxification network in A. thaliana, and its ortholog in rice, OsGRAS23, in the regulation of the drought stress response [Citation38]. Our results confirm the involvement of MtGRAS7 in the response to drought stress caused by mannitol and salinity stress simulated by NaCl. The response to mannitol was not well pronounced in leaves; only in the GRASOE background there was upregulation of expression at the 24-h time point. Conversely, in nodules the expression profile for GRASOE, GRASRNAi and WT showed upregulation at 24 h, and went down at 48 h and 72 h. The different responses in nodules are not a surprise, as we have already reported the higher expression of MtGRAS7 in nodules by tracing the GUS gene under the control of the MtGRAS7 promoter [Citation34]. The response to salinity stress was more pronounced, and significant upregulation of expression was detected in leaves and nodules for GRASOE, GRASRNAi and WT after 24 h of treatment, whereas in the leaves the expression again rose at 72 h of treatment.
The involvement of the investigated gene MtGRAS7 in the response to cold (4 °C) was also confirmed. The significant and clear upregulation of the expression of this gene for the period of treatment and especially during the recovery period supports the suggestion that MtGRAS7 takes part in the response to cold stress.
Conclusions
The generated stable M. truncatula transgenic lines with modified expression of MtGRAS7 had various morphological deviations in plant architecture, flowers and pods. These observations provide evidence that this gene plays a role in plant development. We demonstrated that MtGRAS7 participates in the response to abiotic stress such as drought, salinity and cold. The overexpression of the gene benefits plant during the exposure to stress and during the period of recovery after stress treatment.
Consent to participate
All the authors have approved their participation in the final manuscript.
Consent for publication
All the authors have read and approved the final manuscript and its submission for publication.
Supplemental Material
Download PDF (665.9 KB)Acknowledgment
This work was supported by the technician work of our colleague Kety Krastanova.
Disclosure statement
No potential conflict of interest was reported by the authors.
Data availability
All data that support the findings reported in this study are available from the corresponding author upon reasonable request.
Additional information
Funding
References
- Hirsch S, Oldroyd GE. GRAS-domain transcription factors that regulate plant development. Plant Signal Behav. 2009;4(8):698–700.
- Song L, Tao L, Cui H, et al. Genome-wide identification and expression analysis of the GRAS family proteins in Medicago truncatula. Acta Physiol Plant. 2017;39(4):93.
- Ho-Plagaro T, Molinero-Rosales N, Flores DF, et al. Identification and expression analysis of GRAS transcription factor genes involved in the control of arbuscular mycorrhizal development in tomato. Front Plant Sci. 2019;10(268):268.
- Wang T-T, Yu T-F, Fu J-D, et al. Genome-wide analysis of the GRAS gene family and functional identification of GmGRAS37 in drought and salt tolerance. Front Plant Sci. 2020;11:604690.
- Liu M, Sun W, Li C, et al. A multilayered cross-species analysis of GRAS transcription factors uncovered their functional networks in plant adaptation to the environment. J Adv Res. 2021;29:191–205.
- Peng JR, Carol P, Richards DE, et al. The arabidopsis GAI gene defines a signaling pathway that negatively regulates gibberellin responses. Genes Dev. 1997;11(23):3194–3205.
- Silverstone AL, Ciampaglio CN, Sun T. The arabidopsis RGA gene encodes a transcriptional regulator repressing the gibberellin signal transduction pathway. Plant Cell. 1998;10(2):155–169.
- Di Laurenzio L, Wysocka-Diller J, Malamy JE, et al. The SCARECROW gene regulates an asymmetric cell division that is essential for generating the radial organization of the arabidopsis root. Cell. 1996;86(3):423–433.
- Bolle C. The role of GRAS proteins in plant signal transduction and development. Planta. 2004;218(5):683–692.
- Lu J, Wang T, Xu Z, et al. Genome-wide analysis of the GRAS gene family in prunus mume. Mol Genet Genomics. 2015;290(1):303–317.
- Zhang H, Cao Y, Shang C, et al. Genome-wide characterization of GRAS family genes in Medicago truncatula reveals their evolutionary dynamics and functional diversification. PLoS One. 2017;12(9):e0185439.
- Ma H-S, Liang D, Shuai P, et al . The salt- and drought-inducible poplar GRAS protein SCL7 confers salt and drought tolerance in Arabidopsis thaliana. J Exp Bot. 2010;61(14):4011–4019.
- Mayrose M, Ekengren SK, Melech-Bonfil S, et al. A novel link between tomato GRAS genes, plant disease resistance and mechanical stress response. Mol Plant Pathol. 2006;7(6):593–604.
- Davière J-M, Achard P. Gibberellin signaling in plants. Development. 2013;140(6):1147–1151.
- Stuurman J, Jaggi F, Kuhlemeier C. Shoot meristem maintenance is controlled by a GRAS-gene mediated signal from differentiating cells. Genes Dev. 2002;16(17):2213–2218.
- Greb T, Clarenz O, Schafer E, et al. Molecular analysis of the LATERAL SUPPRESSOR gene in arabidopsis reveals a conserved control mechanism for axillary meristem formation. Genes Dev. 2003;17(9):1175–1187.
- Helariutta Y, Fukaki H, Wysocka-Diller J, et al. The SHORT-ROOT gene controls radial patterning of the arabidopsis root through radial signaling. Cell. 2000;101(5):555–567.
- Bolle C, Koncz C, Chua NH. PAT1, a new member of the GRAS family, is involved in phytochrome a signal transduction. Genes Dev. 2000;14(10):1269–1278.
- Goldya C, Pedroza-Garciab J-A, Breakfieldd N, et al. The arabidopsis GRAS-type SCL28 transcription factor controls the mitotic cell cycle and division plane orientation. Proc Natl Acad Sci USA. 2021;118(6):e2005256118.
- Iantcheva A, Vassileva V, Ugrinova M, et al. Development of functional genomic platform for model legume Medicago truncatula in Bulgaria. Biotechnol Biotechnol Equip. 2009;23(4):1440–1443.
- Iantcheva A, Chabaud M, Cosson V, et al. Osmotic shock improves Tnt1 transposition frequency in Medicago truncatula cv jemalong during in vitro regeneration. Plant Cell Rep. 2009;28(10):1563–1572.
- Karimi M, Inze D, Depicker A. GATEWAY vectors for agrobacterium-mediated plant transformation. Trends Plant Sci. 2002;7(5):193–195.
- Revalska M, Vassileva V, Zechirov G, et al. Is the auxin influx carrier LAX3 essential for plant growth and development in the model plants Medicago truncatula, lotus japonicus and Arabidopsis thaliana? Biotechnol Biotechnol Equip. 2015;29(4):786–797.
- Revalska M, Vassileva V, Zehirov G, et al. Assessment of the function and expression pattern of auxin response factor B3 in the model legume plant Medicago truncatula. Turk J Biol. 2017;41:66–76. http://journals.tubitak.gov.tr/biology/
- Karimi M, Bleys A, Vanderhaeghen R, et al. Building blocks for plant gene assembly. Plant Physiol. 2007;145(4):1183–1191.
- Limpens E, Ramos J, Franken C, et al. RNA interference in Agrobacterium rhizogenes-transformed roots of arabidopsis and Medicago truncatula. J Exp Bot. 2004;55(399):983–992.
- Nolan KE, Rose RJ, Gorst JR. Regeneration of Medicago truncatula from tissue culture: increased somatic embryogenesis using explants from regenerated plants. Plant Cell Rep. 1989;8(5):278–281.
- Murashige T, Skoog F. A revised medium for rapid growth and bio assays with tobacco tissue cultures. Physiol Plant. 1962;15(3):473–497.
- d’Erfurth I, Cosson V, Eschstruth A, et al. Efficient transposition of the Tnt1 tobacco retrotransposon in the model legume Medicago truncatula. Plant J. 2003;34(1):95–106.
- Chabaud M, Larsonneau C, Marmouget C, et al. Transformation of barrel medic (Medicago truncatula gaertn.) by Agrobacterium tumefaciens and regeneration via somatic embryogenesis of transgenic plants with the MtENOD12 nodulin promoter fused to the gus reporter gene. Plant Cell Rep. 1996;15(5):305–310.
- Fan Y, Yan J, Lai D, et al. Genome-wide identification, expression analysis, and functional study of the GRAS transcription factor family and its response to abiotic stress in sorghum [Sorghum bicolor (L.) moench]. BMC Genomics. 2021;22(1):509.
- Kumari P, Gahlaut V, Kaur E, et al. Genome-wide characterization of GRAS transcription factors and their potential roles in development and drought resilience in rose (rosa chinensis). Res Square. 2021.DOI: 10.21203/rs.3.rs-312426/v1.
- Dutta M, Saha A, Moin M, et al. Genome-wide identification, expression and bioinformatic analyses of GRAS 2 transcription factor genes in rice. bioRxiv. 2021.
- Revalska M, Radkova М, Zagorchev L, et al. Functional GUS assay of GRAS transcription factor from Medicago truncatula. Biotechnol Biotechnol Equip. 2019;33(1):1187–1194.
- Robertson M. Two transcription factors are negative regulators of gibberellin response in the HvSPY-signaling pathway in barley aleurone. Plant Physiol. 2004;136(1):2747–2761.
- Li S, Wang X, He S, et al. CFLAP1 and CFLAP2 are two bHLH transcription factors participating in synergistic regulation of AtCFL1-mediated cuticle development in arabidopsis. PLoS Genet. 2016;12(1):e1005744.
- Journot-Catalino N, Somssich IE, Roby D, et al. The transcription factors WRKY11 and WRKY17 act as negative regulators of basal resistance in Arabidopsis thaliana. Plant Cell. 2006;18(11):3289–3302.
- Xu K, Chen SJ, Li TF, et al. OsGRAS23, a rice GRAS transcription factor gene, is involved in drought stress response through regulating expression of stress-responsive genes. BMC Plant Biol. 2015;15(1):141.DOI: 10.1186/s12870-015-0532-3.