
 ?Mathematical formulae have been encoded as MathML and are displayed in this HTML version using MathJax in order to improve their display. Uncheck the box to turn MathJax off. This feature requires Javascript. Click on a formula to zoom.
Abstract
This study aimed to determine an appropriate unstructured kinetic model describing the growth of Debaryomyces hansenii with the hydrolysis of oil palm empty bunches as the substrate sources. We tested the well-known cell growth kinetic models for approximating the xylitol fermentation data. We modeled the extracellular process by considering the biomass as a variable, xylose as the substrate and xylitol as the product. The appropriate kinetic model was determined by fitting the models to the experimental data. The fitting process involved an optimization procedure that minimizes a least-squared error between the model solution and the experimental data using a gradient-based method. We found that the unstructured model with Monod specific kinetic growth model had the best approximating ability to describe the dynamics of the batch xylitol fermentation data. Some factors were highlighted as the key factors that influence the growth of yeast cells. One of them is the maximum growth rate of the yeast cell which had a high sensitivity to the maximum production of new cells and xylitol as the main product. As Monod was the best-approximated model, it implies that inhibitory effects by substrate and product played an important role in controlling the growth of yeast cells. There was a certain maximum growth rate for the yeast cell that generates maximum production of new cells and xylitol within a relatively short fermentation time. This result indicates that the growth rate parameter played an important role in adjusting the fermentation process for optimality purposes.
Introduction
Xylitol, as the main product of fermentation by Debaryomyces hansenii yeast cells, plays an important role as a sugar substitute in the food industry. It can be produced chemically through the xylose hydrogenation process at high temperatures and pressures (temperature ≥ 140 °C, pressure ≥50 atm) using metal catalysts [Citation1]. However, chemical xylitol production is a high-cost method and requires pure xylose as a raw material. Therefore, another production method is used such as bioprocess, which is more attractive and easier than chemical synthesis. It also does not use toxic catalysts for food and pharmaceutical products and is not harmful to the environment. It uses specific microorganisms to convert xylose to xylitol that produce higher product yields [Citation2]. In addition, it also uses lignocellulose as raw material, such as oil palm empty fruit bunch (OPEFB), which are used as raw materials for making xylitol. According to Parajó et al. [Citation3], a fermentation process is mainly influenced by the type of strain, culture conditions and the type of fermentation medium (synthetic solution or from lignocellulosic materials). Operating conditions, including pH, temperature, substrate concentration, addition of cosubstrate and aeration conditions also affect the xylitol recovery. Various microorganisms can be used in xylitol fermentation such as bacteria, fungi and yeast. Among them, yeast becomes the best strain xylitol producer such as Candida genus [Citation4]. Cruz et al. [Citation5] also studied another yeast species, namely Debaryomyces hansenii, that also produces high xylitol accumulation with xylitol yield per xylose substrate of 0.66 g/g with barley shell substrate.
In a previous study, Kresnowati et al. [Citation6] evaluated xylitol fermentation using Candida utilis, Debaryomyces hansenii and Pichia stipitis. The study showed that only C.utilis and D. hansenii were able to produce xylitol. They also evaluated xylitol fermentation in which xylose cosubstrate was considered to produce high xylitol yields. It was found that addition of glucose as the co-substrate increased the overall process, but at a certain concentration, it reduced the xylose consumption and caused a decrease in xylitol production. The critical point in which the addition of glucose as a cosubtrate affects the increase and the decrease on xylitol production depends on the yeast strain. The function of the xylose reductase enzyme and its resistance or tolerance to glucose affects the production ability of the yeast [Citation7,Citation8]. Furthermore, Yudiastuti [Citation9] showed that glucose has a potential as an inhibitor in xylitol fermentation. This was related to the disruption of the xylose reductase enzyme induction system by xylose. Xylose hydrolysate comes from the OPEFB enzymatic hydrolysis process, which contains xylose as the main component and also glucose [Citation10]. The xylose hydrolyzate is then used as a raw material for fermentation using yeast to produce xylitol.
Due to its complexity, the xylitol fermentation system becomes interesting to study both theoretically and experimentally. Some researchers combined both methods to study more about the optimality of the system. For instance, Aguiar et al. [Citation11] studied the growth of Candida guilliermondii for xylitol production from d-xylose and predicted its oxygen transfer rate; Aranda et al. [Citation12] presented a kinetic study of xylitol production using Candida parapsilosis in oxygen-limited culture conditions; and Tochampa et al. [Citation13] discussed the batch fermentations of xylitol production using Candida mogii and xylose as the substrate in the presence of glucose as the co-substrate. Furthermore, Mohamad et al. [Citation14] studied the mathematical modeling of xylitol fermentation using Candida tropicalis by considering the limitations and inhibition of the cell growth and xylitol. Eryasar and Yalcin [Citation15] studied the growth of C. tropicalis cultivated in chestnut shell hemicellulosic hydrolysate. Dasgupta et al. [Citation16] and Dorantes et al. [Citation17] formulated a kinetic model of yeast growth and xylitol fermentation from lignocellulosic pentosans using Kluyveromyces marxianus and from sugarcane bagasse by immobilized cells. The study presented by Manjarres-Pinzón et al. [Citation18] reported the modeling of xylitol production using C. tropicalis in synthetic medium and in non-detoxified OPEFB. As a complement to the previous studies, in this study we intended to formulate an appropriate unstructured kinetic model describing the batch fermentation growth of D. hansenii with the hydrolysis of OPEFB. As we have mentioned before that D. hansenii shows high xylitol accumulation, the study of its growth model gives and opportunity to explore its optimal conditions more. Here, we used experimental data of xylitol production through enzymatic hydrolysis and fermentation using OPEFB as the main substrate. We believe that this study will provide another point of view regarding the theoretical study of xylitol production, which can be used as a reference in the experimental process.
Materials and methods
Microorganism and inoculum design
This study used D. hansenii ITBCC R85. The growth of yeast cells consists of two stages, preparation on solid medium and starting new cultures (inoculation of stock culture). We used GYE (Glucose-Yeast Extract) as the agar for the growth of yeast cells. The next step was to make an inoculum, which aims to help the cell adaptation to the fermentation medium and increase the number of yeast cells. The volume of the inoculum solution is 10% v/v of the fermentation volume. The inoculum composition is a mixture of sugar and nutrient solution and yeast cells. The sugar composition consisting of xylose and/or glucose substrates was adjusted according to the variation of the experiment. The inoculum solution was stored in a shaker at 30 °C for two days with stirring at 150 rpm [Citation10]. The concentration of cells in the inoculum solution that is ready for use was calculated using a counting chamber.
Fermentation process
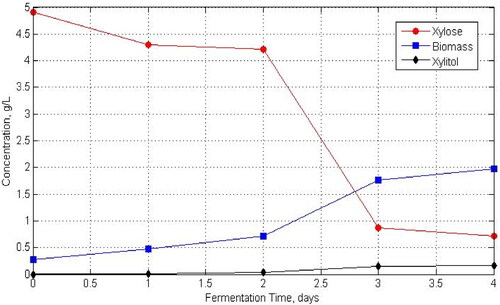
The inoculum was incubated for 2-3 days and the fermentation medium was then put into the New Brunswick BF115 bioreactor volume 1.3 L. The final fermentation working volume was 700 mL. The fermentation process was performed in batches at a temperature of 30 °C and pH 5. Research on the effect of substrate concentration and evaluation of growth kinetics models was carried out at variations in the initial substrate (xylose) concentration of 10 15 g/L and carried out at an air flow rate of 0.5 vvm. The kinetics model for the formation of xylitol products was estimated, where xylitol is only produced from the fermentation process using xylose as a substrate. Research on the effect of the air flow rate was carried out by varying the air flow rate by 0.5; 1 and 1.5 vvm at fixed synthetic xylose substrate concentrations of 7.5 g/L. Fermentation samples were taken at certain time intervals for analysis to determine the concentration of cells, products and the remaining substrate. Cell concentration was measured via the turbidity method using a spectrophotometer (UV Vis) at a wavelength of 560 nm. Before being analyzed by spectrophotometer, the sample was stirred using a vortex. The concentrations of the product and residual substrate were measured using high-performance liquid chromatography (HPLC). From the fermentation results, we obtained the data as presented in .
Figure 1. Batch fermentation data for xylitol production using D. hansenii ITBCC R85.
Unstructured kinetic model formulation
The kinetic model was formulated using an unstructured kinetic model to capture the transient behaviour of the growth of the yeast cell. We considered xylose as the substrate, D. hanseenii as the biomass, and xylitol as the main product. The current model follows the line of Kasbawati [Citation19], which considered an unstructured model for ethanol production by S. cerevisiae. The model of [Citation19] is given as follows:
(1)
(1)
where
represents the concentration of biomass,
represents the concentration of substrate, and
represents the concentration of product. There are two yield coefficients in model (1), i.e.
and
which respectively denote the yield coefficients for biomass and product on substrate consumption. Some inhibitory effects were modelled by considering a critical concentration for which the biomass will growth. Inhibitory effects were modelled by adopting the logistic growth for the yeast cells where the critical concentrations for cell, substrate and product are respectively denoted by
,
and
. Some model improvements were applied to the maintenance coefficients that measure the amount of substrate and product consumptions of the yeast cells for functions other than production of new cells. We assume that the cells’ consumption for maintenance follows a nonlinear function,
(2)
(2)
with maximum consumption rate
for substrate and
for product. Coefficients
and
, respectively, denote the concentration of substrate and product that produces a half of the maximum consumption by yeast cells for maintenance functions. Therefore, by using the maintenance function in (2) with the same maintenance consumption rate (
), model (1) becomes:
(3)
(3)
The initial conditions of the model are and
which are taken from the experimental data. For the specific growth rate of the yeast cell, some models are proposed as presented in . The chosen models are the well-known models that are frequently used by researchers for approximating the growth of cells. In this study we applied these well-known specific growth models for approximating the growth of D. hansenii on xylose.
Table 1. Specific growth rate models () for yeast cells [Citation20–22].
Parameter estimation method
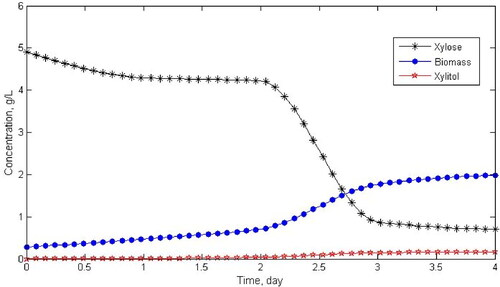
We estimated the parameters of the kinetic model (3) using the experimental data presented in . Model (3) has 9 kinetic parameters. Four of them are kinetic parameters for cell growth, three kinetic parameters are related to cell maintenance, and two kinetic parameters describe the substrate-to-biomass yield and substrate-to-product yield. Additional parameters are given for each specific growth rate according to the kinetic model in . Here, the experimental data in were extrapolated with 50 data points to present the data smoothly (see ). Parameter fitting was performed using an optimization procedure which can be solved numerically.
Figure 2. Extrapolated data using 50 data points.
The quality of the fit is assessed by minimizing the norm of the simulated data and the experimental data. It is defined as:
(4)
(4)
where xm presents a state vector of the solutions of model (3), xd presents the experimental data vector, and p is the kinetic parameter vector that will be estimated. The objective function
simply defines the least square error of the data and the model solution with an Euclid norm. The allowed parameter values p are those defined in the domain
(5)
(5)
with lower bound pl and upper bound pu. Therefore, solving the fitting problem is equal to minimizing the objective function (4) under (5).
Some numerical methods can be applied for solving this fitting problem. One of the simple methods is by using nonlinear least squares data-fitting by the Levenberg-Marquardt method [Citation23]. This method is an iterative algorithm that uses a series of calculations to find the optimal solution. The objective function J is reduced by moving toward the direction of the steepest descent. Since the updating solution is directed either using the gradient descent or the Gauss-Newton, this method is more robust and faster to converge [Citation24]. In this simulation, we applied this method for solving the fitting problem and found the best parameter for approximating the experimental data presented in .
Results
Fitting results and optimal parameters
In this section we present the estimation results for the kinetic model with different kinetic growth rate. The estimated values of the kinetic parameters are given in . The objective values are also presented in to describe the closeness of model solutions with the experimental data. Based on the value of the objective function that should be minimized, Monod kinetic growth gave the lowest objective value for the fermentation data. It had the smallest error compared with the other kinetic models. Furthermore, we compared the experimental data and the model solution for xylose concentration. We found that the three xylose models gave a good approximation and captured the experimental data correctly. Although all three kinetic models approached the xylose experimental data, the closest model was the unstructured xylose model by Monod (). The model successfully described the data and almost coincided at the last observation time. The second model that gave a close fit to the xylose data was the kinetic model by Aiba. Meanwhile, Tyagi’s xylose model was not very close to the data. For biomass concentration, the model by Monod still presented a good agreement with the experimental data (). The model and the data almost coincided at the beginning and up to the middle of the time observation. Meanwhile, even though the Aiba model was quite far from the data, the model could describe the dynamic behaviour of the data. In contrast the Tyagi model failed to fit the data behaviour ().
Figure 3. Comparison between experimental data and the model solution for: xylose concentration (a); biomass concentration (b); and xylitol concentration (c).
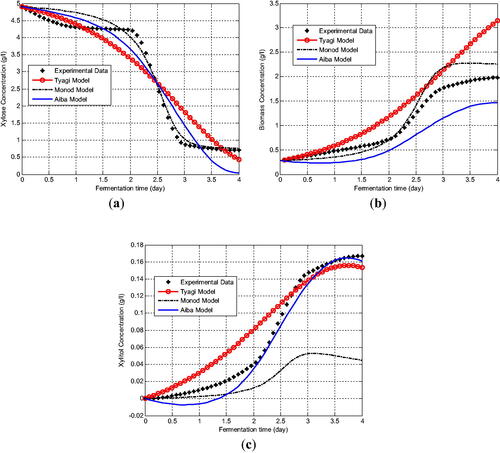
For xylitol concentration, the comparison of the xylitol data with its kinetic model solution revealed different simulation results (). The kinetic models approximated the trend of the data except for the Monod model. The Monod model could fit the behaviour of the experimental data at the beginning of the observation time but it tended to move away from the experimental data as the time advanced. It is quite different from the xylose and biomass model. In contrast to the Monod model, Aiba model could describe the behaviour of the data and then coincided with the data in the middle to the end of the observation time. So did the Tyagi model with a model solution that was quite close to the experimental xylose data.
Sensitivity of model parameters
Sensitivity analysis is presented to study the impact of changing model parameters on new biomass production and product yield. In model (1), there are several model parameters that affect the dynamics of the model solution. Studying its sensitivity will help us to measure the relative importance of model parameters that affect the model’s transient behavior. However, among these parameters, we focused on the sensitivity analysis of the key parameters on the yeast cell growth kinetics. Based on the estimation results, the unstructured model using Monod kinetic growth rate had the lowest objective function, meaning that it successfully described the dynamics of the experimental data. This result became the basis for selecting the Monod kinetic growth parameters for further analysis. As seen in , there are two important growth parameters that influence the Monod kinetics, i.e. the maximum growth rate of the yeast cells and the magnitude of substrate concentration for which the growth rate will achieve a half-velocity constant
. It was interesting to analyze how sensitive both growth parameters were with respect to the xylitol production at the steady state condition. We expected that the growth parameters could be adjusted so that the productivity of yeast cells could be increased. To this end, some sentivity analysis methods can be appplied such as the sensitivity method that was presented in Kasbawati et al. [Citation25]. Before moving on to sensitivity analysis, we first defined a function that represents the function rate of the xylitol production that depends on these two growth parameters, namely
(6)
(6)
By defining as the relative changes in the steady state production of xylitol with respect to the changes in the i-th parameter, we have
(7)
(7)
where
and
. Symbols
and
stand for the concentration of cells, substrate and product, respectively, at the final time of observation. Since the adjusted parameters are
and
, then we have the perturbed specific growth rate
, i.e.
(8)
(8)
Parameters and
can be respectively considered as the percentage of increasing of both adjusted parameters with
. By using the estimation results in for the Monod kinetics growth rate, we obtained the sensitivity results depicted in . The sensitivity results showed that the maximum growth rate of yeast cells
had a very high sensitivity level when compared to
. There is a certain optimal change in the maximum growth rate with respect to the cells and their products to achieve maximum production. Increasing the maximum growth rate will not give a better result, since the greater the cell growth rate is, the lower the production of fermentation product will be. There exists a certain region of regulation that can be adjusted such that both cell and xylitol productions achieve maximum production. The optimal regulation of
resided in the interval of
(). This result could also be observed in for biomass production and for xylitol production when
increased about 23%. On the other hand, changes in
did not significantly affect the cells and xylitol production. This regulation tended to decrease the production does not collocate well with concentration (see ). This behavior was also observed in where the increase in
had no effect on the changes in biomass production and xylitol production.
Figure 4. Relative changes in xylitol and biomass production with respect to the change in the maximal cell growth rate (a) and the magnitude of substrate concentration for half of the maximum growth rate (b) when the final time of observation was 2 days of fermentation.
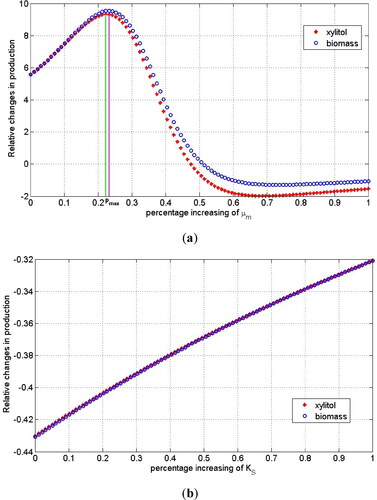
Figure 5. Dynamic observation of biomass production (a) and xylitol production (b) when is increased by about 23%
.
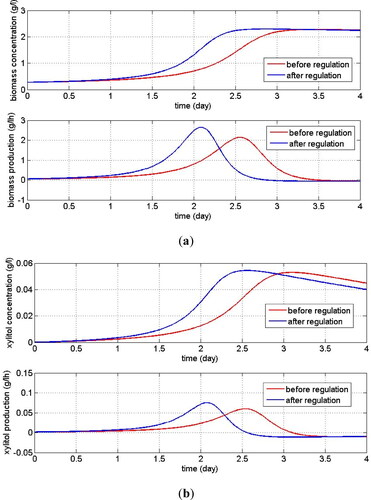
Figure 6. Dynamic observation of biomass production (a) and xylitol production (b) when
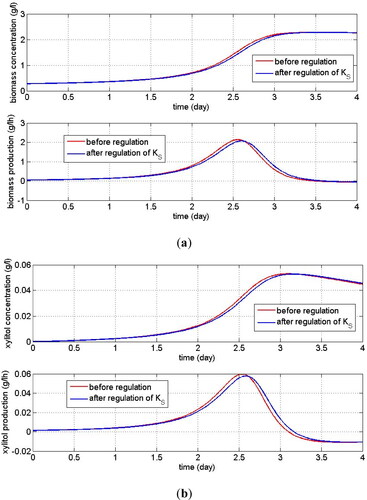
Table 2. Optimal model parameters and the objective function values.
Discussion
A kinetic model has been formulated that was able to explain the dynamics of xylitol fermentation. The model showed the relationship between the specific growth rate of the yeast cells and xylose as the substrate. As we can observe from , the growth of biomass showed a sigmoid growth with a lag phase at the beginning of its growth followed by an exponential growth in the middle and then reached its growth saturation level at the end of the fermentation time. The number of yeast cells increased slowly at the beginning which may be influenced by the limited substrate concentration and some adjustments made by the cells themselves to their new environment. It also indicated that the yeast cell was grown in its natural environment. This result was also observed in several previous reports such as [Citation14, Citation16, Citation18] where the dynamics of cell growth followed a sigmoid growth curve. Since the Monod kinetic gave the best approximation for the experimental data, it suggested two key parameters for the kinetics that should be taken into consideration, i.e. the maximum cell growth rate and the value of xylose that produced a half of the maximum growth rate. Furthermore, some factors in the kinetic model also had a significant effect on the xylose fermentation system such as the level of product and substrate inhibitions, and the cell maintenance rate. As for xylose as a substrate, its concentration decreased slowly during the initial fermentation. After 2 h, the concentration decreased rapidly as yeast cell growth increased exponentially. When the cells reached their maximum concentration, the amount of substrate consumption also started to saturate and converged to a constant concentration of about 0.7 g/l at the end of the fermentation. It indicated that the substrate concentration has not been completely exhausted. For the xylitol data, we found that the kinetic model by Monod could only mimic the experimental data behavior with the norm that was quite large. The model with the smallest error for approximating the xylose concentration was that of Aiba with a model solution that was quite close to the xylose concentration data. These results showed that some factors influence the growth of the yeast cell and the xylose production. Inhibition by substrate and product played an important role in controlling the growth of these cells.
Sensitivity studies on the two main parameters affecting Monod kinetics showed different results. The maximum production of biomass and xylitol could be achieved when the maximum specific growth rate of yeast cells was increased by no more than 23% which indicated that a small enough change in the maximum cell growth rate could trigger the production of new cells and the production of xylitol until it reached its maximum saturation value. This small change also accelerated the time to reach the maximum production of biomass and xylitol as shown in . While a small change in the ‘half-velocity constant’ parameter of Monod was not affected the steady-state production or concentration of biomass and the xylitol. When the magnitude of the substrate for which the cell growth rate achieved a half of the maximum growth was increased, the product concentration changed slightly (the changes almost were not observed). However, there was an interesting result regarding the maximum production of cells. There existed a certain time of observation in which both products achieved a maximum production, i.e. more than 2 h of fermentation. Therefore, increasing the maximum growth rate of yeast cells would result in maximum production of new cells and xylitol within a relatively short fermentation time. While without intervention for the system, the maximum production of both products could be achieved with fermentation time which was higher than the adjusted system.
Conclusions
An unstructured kinetic model was built to describe the xylitol production using D. hansenii yeast cells. The model took into consideration the inhibition effects by the substrate and product. It also considered the maximal maintenance consumption for the function of the yeast cells. Several well-known microbial growth kinetics models were considered to find the appropriate model for describing the batch xylitol fermentation data. The mechanistic model successfully predicted the experimental data of D. hansenii growth. By an optimization procedure, we found that the kinetic model with specific growth rate by Monod was the best kinetic growth rate for predicting the growth of the yeast cell. It was supported by the smallest norm of the model solution and the experimental data for the biomass concentration. The Monod kinetics was the best kinetic model that successfully approached the experimental data with a relatively small accumulated error. A similar behavior was found for the concentration of xylose as the substrate in the fermentation process. The formulated model successfully approximated the experimental data of xylose concentration. Since the Monod was the best kinetics to approach the experimental data, the parameters that influence it were important parameters to analyze the sensitivity level. The first parameter was the maximum growth rate of the yeast cells that had high sensitivity with respect to the biomass and xylitol productions. While for the second adjusted parameter, i.e. the value of xylose concentration that produced a half of the maximum growth rate, its changes did not significantly affect the changes in xylitol and biomass production or concentration. Therefore, the maximum growth rate parameter could be a candidate to be an adjusting parameter in the experiment level. The results obtained will provide a basis for a more comprehensive study to optimize the production of xylitol as the main product in the fermentation process.
Data availability
The data used to support the findings of this study are available from the corresponding author upon reasonable request.
Disclosure statement
No potential conflict of interest was reported by the authors.
Additional information
Funding
References
- Parajó JC, Domínguez H, Domínguez JM. Biotechnological production of xylitol. Part 1: interest of xylitol and fundamentals of its biosynthesis. Bioresour Technol. 1998;65(3):191–201.
- Pereira PHF, Voorwald HCJ, Cioffi MOH, et al. Sugarcane bagasse pulping and bleaching: thermal and chemical characterization. BioResources. 2011;6(3):2471–2482.
- Parajó JC, Domínguez H, Domínguez JM. Biotechnological production of xylitol. Part 2: operation in culture media made with commercial sugars. Bioresour Technol. 1998;65(3):203–212.
- Gong C -, Claypool TA, McCracken LD, et al. Conversion of pentoses by yeasts. Biotechnol Bioeng. 1983;25(1):85–102.
- Cruz HJ, Moreira JL, Carrondo MJT. Metabolically optimised BHK cell fed-batch cultures. J Biotechnol. 2000;80(2):109–118.
- Kresnowati M, Mardawati E, Setiadi T. Production of xylitol from oil palm empty friuts bunch: a case study on bioefinery concept. Mod Appl Sci. 2015;9(7):206–213.
- Mussatto SI, Silva CJSM, Roberto IC. Fermentation performance of Candida guilliermondii for xylitol production on single and mixed substrate media. Appl Microbiol Biotechnol. 2006;72(4):681–686.
- Oh DK, Kim SY. Increase of xylitol yield by feeding xylose and glucose in Candida tropicalis. Appl Microbiol Biotechnol. 1998;50(4):419–425.
- Yudiastuti SON. 2018. Perbandingan metode operasi hidrolisis enzimatis tandan kosong kelapa sawit (tkks) dan kinetika fermentasi xilitol menggunakan Debaryomyces Hansenii itb Ccr85 [unpublished master’s thesis]. Universitas Padjadjaran, Bandung, Indonesia.
- Mardawati E, Trirakhmadi A, Kresnowati M, et al. Kinetic study on fermentation of xylose for the xylitol production. J Ind Inf Technol Agric. 2017;1(1):1–8.
- Aguiar WB, Faria LFF, Couto MAPG, et al. Growth model and prediction of oxygen transfer rate for xylitol production from D-xylose by C. guilliermondii. Biochem Eng J. 2002;12(1):49–59.
- Aranda-Barradas JS, Delia ML, Riba JP. Kinetic study and modelling of the xylitol production using Candida parapsilosis in oxygen-limited culture conditions. Bioprocess Eng. 2000;22(3):219–225.
- Tochampa W, Sirisansaneeyakul S, Vanichsriratana W, et al. A model of xylitol production by the yeast candida mogii. Bioprocess Biosyst Eng. 2005;28(3):175–183.
- Mohamad NL, Mustapa Kamal SM, Mokhtar MN, et al. Dynamic mathematical modelling of reaction kinetics for xylitol fermentation using Candida tropicalis. Biochem Eng J. 2016;111:10–17.
- Eryasar K, Yalcin SK. Kinetic modelling of xylitol production by Candida tropicalis cultivated in chestnut shell hemicellulosic hydrolysate. J Biotechnol. 2017;256:S67.
- Dasgupta D, Kurmi AK, Adhikari DK, et al. Xylitol production from lignocellulosic pentosans using Kluyveromyces marxianus: kinetic modelling of yeast growth and fermentation. Biofuels. 2020;11(3):309–319.
- Dorantes-Landa DN, Cocotle-Ronzón Y, Morales-Cabrera MA, et al. Modeling of the xylitol production from sugarcane bagasse by immobilized cells. J Chem Technol Biotechnol. 2020;95(7):1936–1945.
- Manjarres-Pinzón K, Barrios-Ziolo L, Arias-Zabala M, et al. Kinetic study and modeling of xylitol production using Candida tropicalis in different culture media using unstructured models. Rev Facultad Nacional de Agronomia Medellin. 2021;74(2):9583–9592.
- Samsir R, Jaya AK, Kalondeng A. Determining an appropriate unstructured kinetic model for batch ethanol fermentation data using a direct search method. Biotechnol Biotechnol Equip. 2018;32(5):1167–1173.
- Kostov G, Popova S, Gochev V, et al. Modeling of batch alcohol fermentation with free and immobilized yeasts Saccharomyces cerevisiae 46 EVD. Biotechnol Biotechnol Equip. 2012;26(3):3021–3030.
- Ghose TK, Tyagi RD. Rapid ethanol fermentation of cellulose hydrolysate. II. Product and substrate inhibition and optimization of fermentor design. Biotechnol. Bioeng. 1979;21(8):1401–1420.
- Monod J. The growth of bacterial cultures. Annu. Rev. Microbiol. 1949;3(1):371–394.
- Marquardt DW. An algorithm for Least-Squares estimation of nonlinear parameters. Journal of the society for industrial and applied mathematics. Q Appl Math. 1963;11(2):431–441.
- Alexander. 2020. Levenberg-Marquardt toolbox. MATLAB Central File Exchange.
- Kasbawati K, Sulfahri A. A numerical study of the sensitivity of ethanol flux to the existence of co-factors in the Central metabolism of a yeast cell using multi-substrate enzymes kinetic modelling. Biotechnol Biotechnol Equip. 2020;34(1):375–383.