
Abstract
The intention of this study was to explore whether it is feasible to use a heterotrophic nitrifying-aerobic denitrifying strain to bio-enhance the biological contact oxidation process. In this experiment, Acinetobacter sp. RW, a highly efficient heterotrophic nitrifying-aerobic denitrifying strain isolated in the laboratory, was used as the functional strain. The results show that part of the NH4+-N (ammonia nitrogen), TN (total nitrogen) and CODCr (dichromate oxidizability) of the sewage could be effectively removed via the biological contact oxidation process performed in the laboratory. Average removal ratios of NH4+-N, TN and CODCr increased by 32.8%, 4.33% and 11.13%, respectively, after biological enhancement of RW. According to the biodiversity information, Acinetobacter exhibited the greatest change at the genus level in both the water and biofilm after adding the strain RW. In the 12 days without RW addition, the treatment efficiency of the device was only 1.01% different from that during daily dosing. The results demonstrate that the treatment efficiency of the process can be improved by adding RW. RW can effectively adhere to the biofilm and become one of the dominant strains. Therefore, we conclude that the biological contact oxidation process bio-enhanced by RW was successful and has practical potential.
Introduction
In the twentieth century, Killham [Citation1] found that heterotrophic nitrification occurs in soil. Robertson et al. [Citation2] found that denitrification exists under aerobic conditions and isolated the first aerobic denitrifying strain Thiosphaera pantophus (later renamed Paracoccus pantophus) in the laboratory. Both studies further broadened our understanding of the conditions and functional microorganisms that participate in nitrification and denitrification. In recent years, heterotrophic nitrifying-aerobic denitrifying bacteria, which can simultaneously carry out the two reactions, have been discovered and repeatedly reported. They circumvent the space-time problem in traditional nitrification and denitrification process. Additionally, they have the potential for sewage treatment [Citation3]. If realized, the engineering application could reduce the process complexity and operational cost of the water treatment process. Heterotrophic nitrifying-aerobic denitrifying bacteria are widely distributed in various living environments. At present, they have been found in bioreactors, activated sludge, aquaculture wastewater and seabed sediments [Citation4]. These microorganisms will hopefully overcome the shortcomings of traditional nitrifying bacteria or denitrifying bacteria, which cannot adapt well to extreme environments [Citation5]. Due to the special metabolic pathway, heterotrophic nitrifying-aerobic denitrifying bacteria not only have a faster growth rate, but also a stronger nitrogen metabolism ability [Citation6]. Based on characteristics of the above, heterotrophic nitrifying-aerobic denitrifying bacteria have attracted increasing attention and research interest.
At present, mature but traditional technologies such as the activated sludge process, biofilm process, anaerobic microbial treatment process and biological pond process, are still used as the main treatment technologies for urban sewage. The development of technological innovations and the application of new technologies are still very slow [Citation7]. Therefore, combining some auxiliary means with a traditional water treatment process would be beneficial for improving the water treatment efficiency. Adding new functional strains is one such auxiliary technique that could be especially useful for treating some refractory pollutants [Citation8]. It also provides a new way for the engineering application of new strains. Based on this idea, Acinetobacter sp. RW, a highly efficient heterotrophic nitrifying-aerobic denitrifying bacterium that was screened out in the laboratory, was used as a functional strain to explore its potential in the bio-enhanced contact oxidation process and to identify the optimal operation conditions.
The contact oxidation process involves the attachment of activated sludge to a fixed biological carrier. The carrier is submerged in sewage so that the microorganisms can make full contact with pollutants. An aeration system is used to supply oxygen to microorganisms. Such a system has the combined advantages of the activated sludge process and the biofilm process. Moreover, it can prevent the activated sludge from easily being lost. The contact oxidation process can maintain a high biomass and has good treatment efficiency for organic matter and chemical oxygen demand (COD). It is also widely used to treat a variety of waters, including domestic sewage, river water, medical wastewater and industrial wastewater [Citation9–12]. Based on its technical characteristics and wide application, this study chose the contact oxidation process as the experimental object. Along with the pollutant and technology characteristics, the operational conditions of the process will also have a great impact on the treatment effect. For example, during the treatment of printing and dyeing wastewater, poor operating conditions lead to a significant increase in the amount of excess sludge [Citation13]. Therefore, it is necessary to explore and optimize the operational conditions of the device while successfully bio-enhancing the process.
Materials and methods
Sample and medium
The microbial sample used in this experiment was an efficient heterotrophic nitrifying-aerobic denitrifying bacterium screened from the activated sludge of a sewage treatment plant. It was identified as Acinetobacter sp. and named as Acinetobacter sp. RW (abbreviated hereafter as RW). The water used in the experiment was collected from the GuHe River located in the East Campus of Sun Yat-sen University, China (113°23’18.46" E, 23°3’57.43" N). To make CODcr single pollution water, 50 mg·L −1 of CODcr equivalent glucose was added to the experimental water. The NH4+-N + CODCr mixed pollution water was prepared by adding 5 mg·L −1 of equivalent ammonium sulfate and 50 mg·L −1 of CODcr equivalent glucose to the experimental water. Nitrification medium (0.5 g·L −1 (NH4)2SO4, 0.5 g·L −1 C6H5Na3O7, 1 g·L −1 K2HPO4, 1 g·L −1 KH2PO4, 0.2 g·L −1 MgSO4·7H2O; pH 7.2–7.6) and LB liquid medium (10 g·L −1 tryptone, 1 g·L −1 glucose, 5 g·L −1 yeast extract, 5 g·L −1 NaCl; pH 6.8-7.2) were sterilized at 121 °C and 0.11 MPa for 30 min and then cooled before use.
Experimental device and determination method
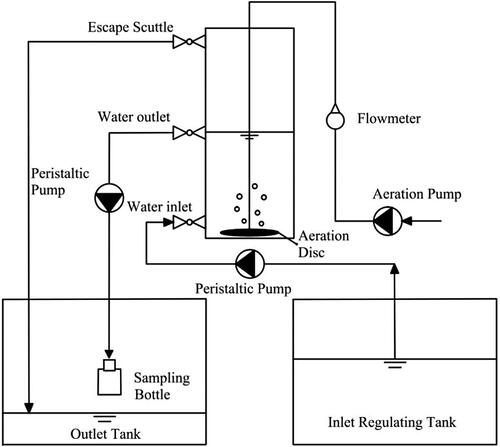
The experimental device for contact oxidation is shown in . Two sets of the same devices (named device A and B) were prepared for the experiment. The filler was made of polyurethane. NH4+-N, TN and COD concentrations were determined via Nessler’s reagent spectrophotometry, basic potassium persulfate ultraviolet spectrophotometry and the potassium dichromate rapid closed digestion method, respectively [Citation14]. And SPSS (Statistical Product and Service Solutions) was used for analysis.
Figure 1. The experimental device for contact oxidation.
Start-up process of the bio-enhanced experiment
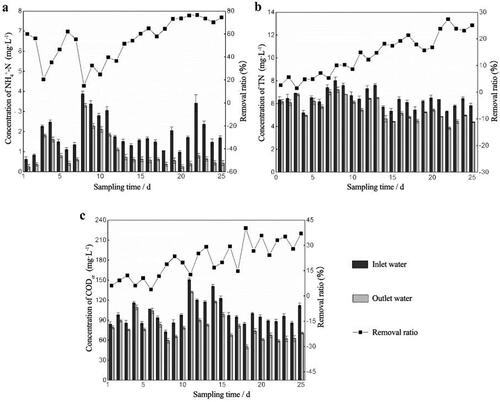
After setting up the contact oxidation experimental devices, the single polluted water was used as the influent. The aeration rate (abbreviated as Q) was set to 30 mL·min −1 and the hydraulic retention time (HRT) was set to 16 h. In order to measure the concentrations of NH4+-N, TN and CODcr, water samples were taken daily for 25 consecutive days. Successful start-up of the contact oxidation process was judged by the change in water quality index () and the growth of biofilm.
Figure 2. The bar graphs show the concentration of three kinds of pollutants in the inlet and outlet water. The line charts show the removal ratios of different pollutants during start-up period. (a) NH4+-N. (b) TN. (c) CODCr.
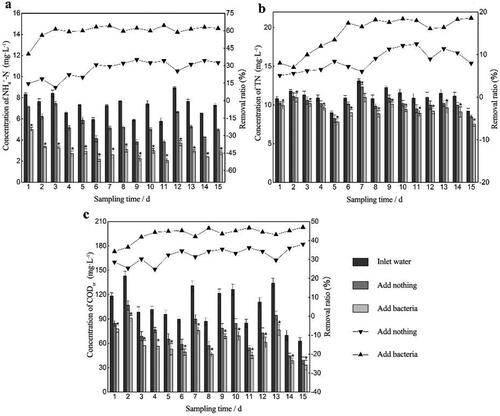
Preparation of RW was performed during the process start-up period. RW was inoculated into sterilized LB liquid medium and cultured in a constant temperature shaking table (150 rpm, 30 °C) for 10 h. To eliminate the influence of culture medium on water quality, 30 mL of 0.5% (v/v) bacterial solution was taken and centrifuged (4 °C, 3000 g) for 10 min. Then the supernatant was discarded, and the pellet was washed and then shaken with 30 mL of 0.9% normal saline. The mixture was centrifuged again under the same conditions to obtain the pellet. The above process was repeated twice, after which only the bacteria were kept after centrifugation. After the process started successfully, the influent of devices A and B was switched from single polluted water to mixed polluted water. Both aeration rate and HRT were unchanged. Biological enhancement was performed on device A, but no bacteria were added to device B, which represented the control. The concentrations of NH4+-N, TN and CODCr in the inlet and outlet water were detected daily.
Optimization of operational condition
To find the optimal operational conditions, the parameters were adjusted one by one. The mixed polluted water was used as the influent of device A (adding RW as the bio-enhancement group) and device B (adding nothing as the control group). First, the HRT was maintained for 16 h while Q was increased from 30 mL·min −1 to 60 mL·min −1. After 15 days of operation, Q was increased to 90 mL·min −1 and then operated for another 15 days. Next, the devices were kept in the best aeration condition, as determined above. HRT was then adjusted from 16 h to 8 h and operated for 15 days. The HRT was adjusted again to 24 h and then operated for another 15 days. Third, kept devices in the best aeration rate and HRT condition and continued to run for 15 days. After that, the daily dose of RW was stopped but the devices were run for further 12 days. The inlet and outlet water from the above processes were sampled and tested daily.
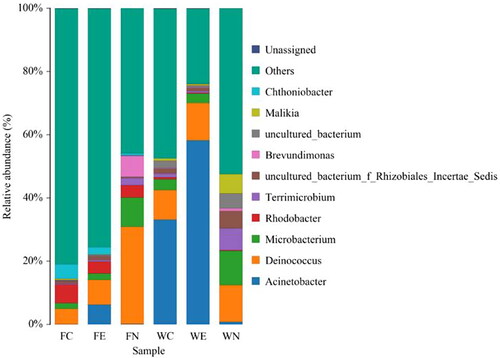
Along with detecting the basic water quality indicators, DNA from the water samples and biofilms was extracted using an improved CTAB method [Citation15]. Samples included the fillers of the control (FC) and bio-enhanced (FE) groups, the filler after successfully starting-up (FN), the water outlets of the control (WC) and bio-enhanced (WE) groups, the water outlet after successfully starting-up (WN). The Illumina HiSeq 2500 platform was used for sequencing. Reads with over 97% similarity were clustered into the same operational taxonomic units (OTUs). Finally, the structure and diversity of microbial community was analyzed according to the OTUs.
Results
Efficiency of bio-enhancement
During the process start-up period, the removal ratio of pollutants first fluctuated and then reached a relatively stable state. The pollutant removal ratio was affected by the influent concentration, especially during the early start-up period. For example, the influent NH4+-N concentration on day 7 was three times higher than that on day 8, so the corresponding removal rate changed by 40.52% (). This is due to the incomplete biofilm growth on the packing and the weak resistance to shock loading. During the later stage when the biofilm was completely grown, fluctuation of the removal rate decreased even though the influent was still changing. The ability to resist the impact load increased notably. After 25 days, a layer of tawny film grew on the packing, and the surface was wet and greasy. It would sink into the bottom without aeration. After adding RW, the average removal ratios of NH4+-N, TN and CODCr in the bio-enhancement group were 32.8%, 4.33% and 11.13% higher, respectively, than those in the control group (). It was found that there was a significant difference (p < 0.05) in the pollutant removal ratio between the bio-enhancement group and the control group throughout the experimental period. Also, the bio-enhancement group always performed better than the control group.
Figure 3. The difference of pollutants concentration in outlet water between the bio-enhanced group and the control group. (* means p < 0.05) Removal ratios of pollutants after adding nothing and adding bacteria when the mixed pollution water was used as the influent. Aeration rate was set to 30 mL·min −1 and the hydraulic retention time was set to 16 h. (a) NH4+-N. (b) TN. (c) CODCr.
Optimize condition for bio-enhancement
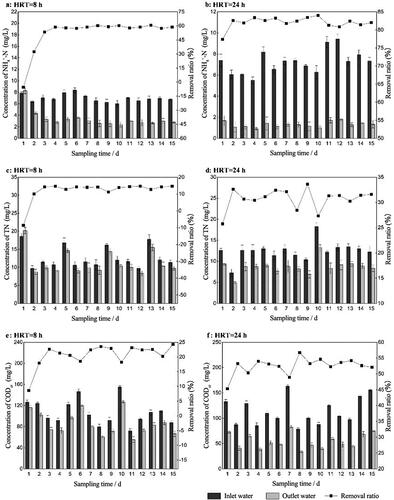
The following study was focused on finding the optimal conditions of biological enhancement. As shown in and , the removal ratio of NH4+-N during the experiment was about 40.3% ∼ 64.8%, 68.1% ∼ 80.6%, 65.3% ∼ 75.3%, respectively, when the Q was 30 mL·min−1, 60 mL·min−1 or 90 mL·min−1. The results show that 60 mL·min−1 was the best aeration rate. When the HRT was 8 h, 16 h or 24 h, the removal ratio was about 53.6% ∼ 60.8%, 68.1% ∼ 80.6%, 76.7% ∼ 84.56%, respectively ( and ). The results show that 24 h was the best HRT. According to the data, TN and CODcr shared the same rule with NH4+-N.
Figure 4. The concentration and removal ratios of different pollutants in the bio-enhancement group under different aeration rate (abbreviated as Q). (a) NH4+-N, Q was 60 mL·min −1. (b) NH4+-N, Q was 90 mL·min −1. (c) TN, Q was 60 mL·min −1. (d) TN, Q was 90 mL·min −1. (e) CODCr, Q was 60 mL·min −1. (f) CODCr, Q was 90 mL·min −1.
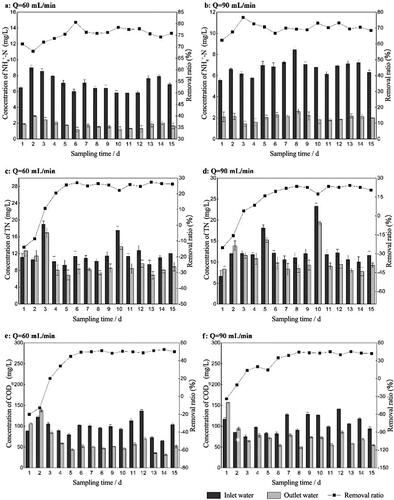
Figure 5. The concentration (bar graphs) and removal ratios (line charts) of different pollutants in the bio-enhancement group under different hydraulic retention time (abbreviated as HRT). (a) NH4+-N, HRT was 8 h. (b) NH4+-N, HRT was 24 h. (c) TN, HRT was 8 h. (d) TN, HRT was 24 h. (e) CODCr, HRT was 8 h. (f) CODCr, HRT was 24 h.
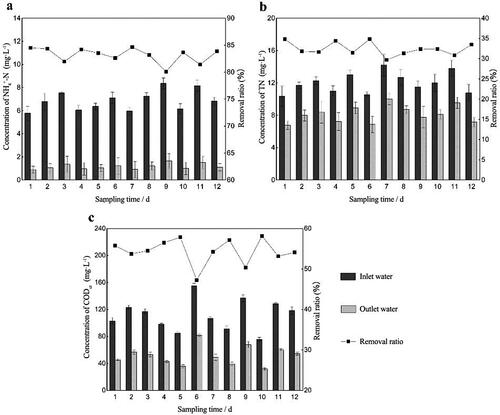
Based on the above data, the experimental devices were tested again under the optimal operation conditions. The results show that the average removal ratios of NH4+-N, TN and CODCr in the bio-enhancement group were 19.94%, 14.34% and 11.74% higher, respectively (), than those in the control group (). The bio-enhancement group was always higher than the control group throughout the whole experiment period. SPSS analysis showed that there was a significant difference between the ratios of the two groups (p < 0.05). This further demonstrates the effect of biological enhancement.
Figure 6. The concentration (bar graphs) and removal ratios (line charts) of different pollutants in the bio-enhancement group and control group under the optimal operation conditions. (a) NH4+-N. (b) TN. (c) CODCr.

In order to further demonstrate that the added strain became one of the dominant microorganisms, the experimental devices continued to operate after the addition of RW ceased. Compared with the bio-enhancement group under optimal conditions (), the average removal ratios of NH4+-N, TN and CODCr in the two systems were only 0.69%, 1.01% and 0.94% different, respectively, after RW addition ceased ().
Figure 7. The concentration (bar graphs) and removal ratios (line charts) of different pollutants in the bio-enhancement group after RW addition ceased. (a) NH4+-N. (b) TN. (c) CODCr.
Results of the sequencing
The sequencing results show that 928 OTUs were detected in the six samples. Among them, FC, FE, FN, WC, WE and WN had 772, 776, 659, 700, 552 and 609 OTUs, respectively. The proportion of common microorganisms in the effluent and biofilm was 83.5%. The common microorganisms in all of the biofilm and the effluent samples represented 63.6% and 46.8%, respectively, of the community.
In addition, the microbial community was analyzed at the genus level. The top ten most abundant genera in FC, FE, FN, WC, WE and WN were used to make a community structure diagram (). Acinetobacter existed in all the samples, which indicates that Acinetobacter was an indigenous genus in the natural water. However, its abundance in the six samples was notably different. This was especially obvious in the packing biofilm, where the Acinetobacter abundance in the bio-enhancement group (6.25%) was 6.15% higher than that of the control group. The abundance in the effluent of the bio-enhancement group (58.19%) was 25.02% higher than the control group.
Figure 8. Genus diversity of six samples based on the 16S rDNA gene sequencing technology. Samples included the fillers of the control (FC) and bio-enhanced (FE) groups, the filler after successfully starting-up (FN), the water outlets of the control (WC) and bio-enhanced (WE) groups, the water outlet after successfully starting-up (WN).
Discussion
Effect of bio-enhancement
Adding functional bacteria to enhance the treatment effect of a mature process is a common practice. For example, Wu Yan et al. [Citation16] used a mixed microbial agent BMc-1 to bio-enhance the traditional A/O process to treat high ammonia nitrogen wastewater, and the removal ratio of NH4+-N and TN was increased by 1.7% and 6.5%, respectively. In this experiment, RW was added to bio-enhance the contact oxidation process, and improvement in the treatment effect was notable. Our study showed that from the first day, the pollutant removal ratio in the bio-enhancement group was significantly better than that in the control group. This demonstrates that RW addition played a biological enhancement role from the beginning.
Exploring the best operational conditions mainly addressed the aeration rate and HRT. Because the aeration rate affects the mixing degree of influent and filler, and the treatment effect decreases when mixing is excessive [Citation17]. It could blow off ammonia nitrogen in water [Citation18] and also affect the dissolved oxygen in the system. Generally, the larger the aeration rate, the higher the dissolved oxygen in water. However, the marginal benefit of aeration decreases when the aeration rate exceeds a certain limit. As such, increasing the aeration rate has little effect on improving the dissolved oxygen [Citation19]. Dissolved oxygen is an important factor that affects nitrification and denitrification [Citation20]. When the aeration rate is too high, the anaerobic or anoxic areas around the biofilm will decrease or even disappear, which will weaken or even stop the denitrification process. This will ultimately affect the nitrogen removal efficiency. At present, it is generally believed that excessive aeration and high dissolved oxygen are not conducive to TN removal [Citation21]. This is consistent with the experimental conclusion stated above.
According to previous studies, the treatment efficiency of the system will improve if the HRT is extended within a certain limit because the contact time between pollutants and the biofilm is increased. However, if the HRT is too long, the volume load of the system will be too low, resulting in a lack of microbial metabolic substrates. In this case, bacteria on the packing will start endogenous respiration and slow down growth, causing the biofilm to age and fall off. Eventually, the processing capacity of the system will be reduced [Citation22,Citation23]. It is also reported that the packing will fail to form a complete biofilm when the HRT is too long, but the treatment efficiency of the system will be affected if the HRT is too short [Citation24,Citation25]. Therefore, the optimal HRT should be ascertained according to the specific conditions.
Microbial stability in the system
The total OTUs of the biofilm were more abundant than that of the water outlet. This is because the surface of the biofilm was coarser, making it easier for the microorganism to attach [Citation26]. Moreover, the dissolved oxygen content of the biofilm on the packing substantially changed from the inside to the outside, creating a more diverse microenvironment [Citation27]. It is found that most of the microbial structure did not change when the environmental conditions changed according to the results, and these microorganisms made up the ‘backbone’ of the microbial community. Other than that, Acinetobacter changed the most. Because RW belongs to Acinetobacter, this phenomenon demonstrates that the abundance of Acinetobacter was greatly improved after biological enhancement. Furthermore, it became one of the dominant bacteria in the water and biofilm, which provides improved stability for the treatment effect of the contact oxidation process [Citation4]. After the addition of RW ceased, the experimental device can still keep the high removal ratios. Therefore, we conclude that the removal ratio of the device can be maintained for a long time and remains relatively stable during the whole experimental cycle.
In summary, under the optimal operational conditions, the pollutant removal efficiency in the treatment system was greatly improved and remained stable. Two key questions related to practical engineering application required specific attention: (1) whether RW adapted and became the dominant bacteria in the system; (2) whether the biological enhancement was successful [Citation28]. In this paper, two aspects were used to verify this. First, we found that the system still maintained a good treatment effect after addition of the bacteria was stopped. Secondly, the abundance of Acinetobacter in the packing and effluent of the bio-enhancement group increased significantly. The stability of the removal efficiency and the biodiversity of the system after bacterial addition was stopped suggests that the RW-bio-enhanced contact oxidation process was successful. Taken together, this in-depth study demonstrates that it is feasible to treat mixed pollution influent containing NH4+-N and CODCr by adding RW to bio-enhance a contact oxidation device.
Conclusions
The efficient heterotrophic nitrifying aerobic/denitrifying bacterium Acinetobacter sp. RW was added to a contact oxidation process at a dosage of 0.5% (v/v) to facilitate a bio-enhancement process. The results show that the average removal ratios of NH4+-N, TN and CODCr in the bio-enhancement group were 32.8%, 4.33% and 11.13% higher, respectively, than those in the control group. Under optimal experimental conditions, the best aeration rate was 60 mL·min−1 and the best HRT was 24 h. According to molecular biological sequencing methods, the abundance of Acinetobacter in the packing and effluent of the bio-enhancement group was significantly increased. Moreover, after RW addition ceased, the process still maintained the treatment efficiency when the system was bio-enhanced. RW became one of the dominant and functional strains in the biofilm and water. The above results show that the bio-enhanced contact oxidation process with RW was successful. This scheme has practical application potential; however, considering the higher complexity of actual sewage, the relevant details need to be further studied in specific engineering application cases in the future.
Disclosure statement
No potential conflict of interest was reported by the authors.
Data availability statement
All data generated or analyzed during this study are included in this published article.
Additional information
Funding
References
- Killham K. Heterotrophic nitrification. In: Prosser JI, editor. Nitrification. Oxford: IRL; 1986. p. 117–126.
- Arts PA, Robertson LA, Gijs Kuenen J. Nitrification and denitrification by Thiosphaera pantotropha in aerobic chemostat cultures. FEMS Microbiol Ecol. 1995;18(4):305–315.
- Chen J, Peng Y, Liu F, et al. Research advances in denitrification property of the heterotrophic nitrification-aerobic denitrification bacteria. Environ Sci Technol. 2020;43(5):41–48.
- Li G, Lai Q, Shao Z, et al. Research progress of heterotrophic nitrification-aerobic denitrification bacteria. Biot Resour. 2018;40(5):419–429.
- Joo H-S, Hirai M, Shoda M. Nitrification and denitrification in high-strength ammonium by Alcaligenes faecalis. Biotechnol Lett. 2005;27(11):773–778.
- Ji B, Yang K, Zhu L, et al. Aerobic denitrification: a review of important advances of the last 30 years. Biotechnol Bioproc E. 2015;20(4):643–651.
- Dai F. Analysis on current situation and development trend of municipal domestic sewage treatment technology. ShanXi Chem Indus. 2021;2(41):215–217.
- Zhou J, Cheng J, Yuan Y. Advances in biodegradation of sulfonamides with mixed cultures. Chin J Appl Environ Biol. 2017;23(1):169–174.
- Ruan D. Discussion on using a/O biological contact oxidation to treat rural domestic sewage. Leather Mak Environ Protect Technol. 2020;1(22):51–55.
- Han X. Experimental study on the treatment of low-pollution water by biological contact oxidation process. AnHui: Hefei University of Technology; 2020.
- Sun K, Tian Y, Shi H, et al. Example of biological contact oxidation process for treating hospital wastewater. Indus Water Treatment. 2020;40(11):114–115.
- Dai Y. Treatment of pharmaceutical wastewater by microelectrolysis/fenton oxidation/hydrolysis acidification/biological contact oxidation. Biol Chem Eng. 2021;7(01):77–80.
- Feng J. Application and research progress of biological contact oxidation process for printing and dyeing wastewater treatment. China Resour Compreh Utiliz. 2019;37(6):84–86.
- Editorial board of State Environmental Protection Administration. Water and wastewater monitoring and analysis methods. 4th ed. Beijing: China Environmental Science Press; 2002.
- Li D, Kong F, Yu Y, et al. The abundance of microcystin-producing and non-microcystin-producing microcystis populations in the water column and sediment during a water bloom in lake taihu. Acta Scient Circumst. 2011;31(2):292–298.
- Wu Y, Ren X, Kou Y, et al. The strengthening effect of compound microbial agents on treatment of high concentration ammonia-nitrogen wastewater. Sci Technol Eng. 2020;20(25):10544–10549.
- Tang Y. Summarization of reclaimed water reuse. Mech Electr Equip. 2007;24(2):29–31.
- Gong C, Chen Y, Huang L. Pollutants removal characteristics by air stripping with aeration treating biogas slurry of cattle manure. Chin J Environ Eng. 2016;10(5):2291–2296.
- Sui L, Liang W, Wu L, et al. Treatment of domestic wastewater using mixed submersed carrier biological contact oxidation. Environ Sci Technol. 2011;34(12):101–104.
- Li C, Lu X, Inamori Y. Study on simultaneous nitrification and denitrification for nitrogen removal. Water Wastewater Eng. 2001;27(1):22–24.
- Zhu G, Peng Y, Li B, et al. Biological removal of nitrogen from wastewater. Rev Environ Contam Toxicol. 2008;192:159–195.
- Zhang M, Peng Y, Wang C, et al. Optimization denitrifying phosphorus removal at different hydraulic retention times in a novel anaerobic anoxic oxic-biological contact oxidation process. Biochem Eng J. 2016;106:26–36.
- Lu M, Wei X, Su Y. Aerobic treatment of oilfield wastewater with a bio-contact oxidation reactor. Desalin Water Treat. 2011;27(1-3):334–340.
- Tijhuis L, Van Loosdrecht M, Heijnen J. Formation and growth of heterotrophic aerobic biofilms on small suspended particles in airlift reactors. Biotechnol Bioeng. 1994;44(5):595–608.
- Heijnen J, Van Loosdrecht M, Mulder A, et al. Formation of biofilms in a biofilm air-lift suspension reactor. Water Sci Technol. 1992;26(3-4):647–654.
- Zou H, Wang Y, Li F, et al. Comparative analysis on two kinds of bio-film forming methods and its influential factors. Indus Water Treatment. 2015;30(10):62–65.
- Sun P, Wu J, Kang L. Effect of dissolved oxygen on nitrogen and phosphorus removal by multi-stage biological contact oxidation. Sci Technol Eng. 2019;19(23):341–346.
- Xiong G, Chen J, Ye W. Bio-enhancement technology and its application in water pollution treatment. Environ Sci Manag. 2013;38(4):82–86.