
 ?Mathematical formulae have been encoded as MathML and are displayed in this HTML version using MathJax in order to improve their display. Uncheck the box to turn MathJax off. This feature requires Javascript. Click on a formula to zoom.
Abstract
Bacteriophages and their potential contribution to antimicrobial resistance (AMR) have attracted growing attention in the context of medicine and pharmaceutics. A major objective of the CAMDA challenge is to acquire more knowledge about the relationship between viruses, their hosts and AMR genes in determining if AMR indeed can spread through phages. This study is focused on exploring the relationship and possible dependencies between bacteriophages and AMR based on the data collected from urban environments all over the world. The samples in the data are classified into two categories: high and low, according to the observed levels of AMR genes. The approach used in our analyses consists of several different methods which assess the differential abundance of phages, their diversity across samples, the impact on AMR categories and associations with AMR genes. The relationship between phages, their hosts and AMR is also explored by a Bayesian spatial model, using the AMR category (low vs high) as a factor. We found a higher relative risk for phages known to infect Staphylococcus aureus alone or both S. aureus and Acinetobacter baumannii in the high AMR group, which implies that these phages may have a role in the dissemination of antimicrobial genes.
Introduction
Antibacterial resistance poses a serious medical problem that will need new methods in tackling bacterial infections. One main reason for developing such resistance is the overuse of antibiotic agents in human medicine. Antibiotics are often prescribed incorrectly with no obvious benefit. In addition, lack of patient compliance during the antibiotic treatment facilitates the proliferation of drug-resistant bacterial strains. The extensive use of antibacterial agents in agriculture is another major driver of antimicrobial resistance (AMR). Selective pressure due to antibacterial agents leads to acquiring new genetic traits either by spontaneous mutations or by horizontal gene transfer. In both cases the survival rate of the bacteria will increase.
Bacteriophages (or phages) are viruses that infect and replicate within bacteria and, since their discovery in the early 1900s by Tword and d’Herelle, have become a focus of intensive research as potential treatments of pathogenic bacteria as well as possible causes for AMR. Their effect on the horizontal gene transfer via transduction and transformation can contribute to the development of AMR [Citation1–4]. The transfer involves DNA sequences such as prophages, transposons, plasmids and others. General, specialized and lateral transduction occur because of errors in the phage packaging, imprecise excision or delayed excision. However, their role in the dissemination of AMR genes (ARG) is not certain and some studies [Citation5] point out that phages may not necessarily encode such genes. Therefore, understanding of the extent to which phages contribute to the propagation of antibacterial resistance is an important task [Citation6]. The main mechanism behind introduction of new resistance factors is transduction, which is a process of transfer of bacterial DNA between a bacterium infected by bacteriophage and another susceptible bacterium.
The idea of metagenomic studies is based on generation of huge datasets of short read sequences from prokaryotic cells in microbial communities [Citation7]. Antimicrobial profiles exhibit regional differences in global urban sewage [Citation8, Citation9] and Subway and Urban environments [Citation10]. Some studies also explored the relationship between bacteriophage diversity and ARG profiles [Citation11]. Many of the existing tools for analyzing metagenomic sequences rely on the so-called k-mer approaches to extract microbial taxa from such data. Some recent methods have been developed based on deep learning approaches to find potential mutated or viral sequences [Citation12–14].
The main goal of the CAMDA [Citation15] metagenomics challenge is to explore systematically the co-evolution of the bacteria and their corresponding phages and to potentially be able to predict AMR events from samples collected in strategic monitoring areas. Understanding the relationship between viruses and their hosts will be important in elucidating whether phages can spread AMR. In more details, there are four specific tasks: (1) discovery of phages and prophages in metagenomic samples with relevance to AMR; (2) establishing species that may be infected by detected phages, horizontal AMR gene transfers etc.; (3) applications and assessments of relation mining for the occurrence of phages and bacteria in the context of AMR; (4) advancement of algorithms for the identification and discovery of phages and prophages from bacterial genomes; In this work we will focus on analyzing the data and performing the first three tasks.
Materials and methods
In this work, we combine several different methods to explore the relationship between phages and ARGs distributions. We first use compositional data (CoDa) analysis [Citation16] to find specific phages that separate samples based on their ARGs profiles. We then calculate different alpha diversity measures such as Chao1 [Citation17], Shannon [Citation18] and Simpson indices [Citation19] as well as beta diversity based on Bray–Curtis dissimilarity [Citation20]. We use penalized lasso regression [Citation21] to find best predictor models for AMR diversity based on the phage abundances. Finally, we use a Bayesian spatial model [Citation22] to estimate relative risk of phages taking into account their host abundances.
Data
The CAMDA [Citation15] challenge provides a set of 124 samples from Subway and Urban public transport environments across all continents divided into two groups based on their ARGs profiles (62 high and 62 low AMR samples). Operational Taxonomic Unit (OTU) counts of phages taxa normalized as reads per million (RPM) were extracted from the shotgun sequences of the samples using Kaiju - v1.8.2 [Citation23] metagenomics classifier the with virus database of the National Center for Biotechnology Information (NCBI). The classifier uses protein level classification and achieves high sensitivity. The total number of non-zero abundant viruses is 6618 while the total number of non-zero abundant phages is 2687. We also extracted bacteria taxa using the proGenomes2 database [Citation24] and summarized the counts on the level of species. For the AMR abundances we used the ARG profile data provided by CAMDA and Pangea which included normalized sets of both ARGs and taxa classes.
CoDa analysis
CoDa are vectors of non-negative components showing the relative weight or importance of a set of parts in a total [Citation25]. Parts cannot be interpreted isolated from the others. Standard methods such as correlation analysis, which assumes Euclidean geometry applied directly to CoDa, may lead to biased results since the sample space for CoDa is simplex. One of the common approaches of analysing CoDa is to apply standard methods to log-ratio transformed data and then use inverse log-ratio transformation to return to the original space [Citation16]. Data are considered compositional if they consist of vectors with positive components whose sum is constant (e.g. 1 for proportions or 100 for percentages). More specifically, this defines the sample space as a hyperplane called Aitchison Simplex [Citation26]
Metagenomics data (e.g. OTU count data) are CoDa since the sum of all component values depends on the sampling procedure and the data are proportional [Citation27]. Taking into account this structure, we perform differential abundance analysis using compositional methods. We compare the phages abundance for high and low AMR samples to find for which phages there is a difference between the two groups. We use the R-package ALDEx2 [Citation28], which was developed using Bayesian methods for detecting ANOVA type of differential expressions specifically for CoDa. We also perform Fisher exact test to find possible overrepresentation of families of phages taxa.
Alpha diversity with Chao1, Shannon, Simpson indices and beta diversity with Bray–Curtis dissimilarity index
Alpha diversity measures variation of microbes in a single sample, whereas beta diversity measures variation across samples. For more detailed information about the applications of diversity measures in metagenomic analysis and the methods for their calculation, see Xia et al. [Citation29]. In this work, we use both measures to characterize our data. In particular, we use three indices such as Chao1 diversity [Citation17] index, which is defined as
where
is the estimated number of species, Sobs is the total number of species observed in the sample, n1 is the number of species represented by only one individual and n2 is the number of species represented by two individuals.
Next, we use the diversity index [Citation18], which is defined as
where pi is the proportion of the community represented by the ith species and S is the total number of species. Both Chao1 and Shannon indices give more importance to less common species. Finally, we use Simpson index [Citation19], which presents the species heterogeneity and is defined as
where pi is the relative abundance of the ith species in the sample. Here Simpson’s index ranges from 0 (low diversity) to almost 1. Contrary to the indices described above, Simpson index gives more weight to the more dominant species [Citation29].
The Bray–Curtis dissimilarity index [Citation20] is a statistic measure used to quantify the compositional dissimilarity between two different samples, based on counts at each sample [Citation29] and is defined as follows
where Xij, Xik is the number of individuals in species i in each sample (j, k) and n is the total number of species in samples. We use the above methods for estimation of species richness, namely Chao 1, Shannon–Wiener and Simpson diversity indices as implemented in the R package vegan. We perform Kruskal–Wallis test to compare the diversity measures across AMR status and geographical location.
We apply Constrained Analysis of Principal Coordinates with Bray–Curtis dissimilarity (capscale from R package vegan). We also use PERMANOVA (function adonis [Citation30] in the vegan package), which partitions sums of squares using semi-metric and metric distance matrices. It performs ANOVA-like tests of the variance in beta diversity which is explained by categorical predictors like AMR status or geographical location. The method is usually applied to large genetic data such as metagenomics OTU data.
Penalized lasso regression
In this study, we apply several types of regression models provided in R package caret [Citation31] and we focused on Lasso (Least Absolute Shrinkage and Selection) penalized regression [Citation21, Citation32] for high-dimensional data. This model adds a L1 type penalty term (which is estimated from data by cross-validation technique) for some variables in the model which are highly correlated. As a result, the penalty term will be able to set up some of the model coefficients exactly as zero. Thus, the LASSO is a penalized type of the model selection approach. The estimated model is more parsimonious and interpretable than the models obtained with other regression models like the ridge regression [Citation33]. The LASSO model has many applications because it is an efficient method in regression problems that arise in many scientific areas [Citation34]. The LASSO model is applied to the phages data to predict the AMR variation within the samples and subsequently to account for the two major classes of AMR – High AMR and Low AMR. Let us denote the AMR classes by G taking the values 1 and 2. As described before [Citation32, Citation35], the logistic regression model represents the class-conditional probabilities through a linear function of the predictors
.
.
Alternatively, this implies that
Here, we fit this model by regularized maximum (binomial) likelihood. Let be the probability for observation i at a particular value for the parameters
, then we maximize the penalized log likelihood
We split the data into a training and a testing set and use cross-validation as provided in the Lasso implementation of package caret.
Bayesian spatial model to estimate relative risk of bacteriophages
As described before, spatial autocorrelation is very common when observations that are close in space have similar values [Citation35, Citation36]. A proportion of this spatial autocorrelation is usually modelled by known covariate risk factors in a regression model. However, it is common for spatial structure to remain in the residuals after accounting for these covariate effects. These models include a set of spatially autocorrelated random effects which have a conditional autoregressive (CAR) prior. Spatial models such as Bayesian hierarchical models are then used to augment the linear predictor with a set of spatially autocorrelated random effects depending on the neighborhood structure of geographic areas. These random effects are typically represented with a CAR prior, which induces spatial autocorrelation through the adjacent structure of the areal units.
Bayesian hierarchical models is commonly used in epidemiology to model the relative risk of a disease [Citation37]. Recently, they have also been applied to metagenomics data to build networks of taxonomic units [Citation38]. We adapt the model to investigate further the relationship between phages and AMR by taking into account the geographical location and host bacteria abundance. In disease mapping the host are humans or animals, while in our context the host are bacteria and the disease is defined as a consequence of the bacteriophages effects. There are two main biological hypotheses with respect to the role of the phages in the dissemination of ARG, namely: the bacteriophages transmit the ARGs through processes such as bacterial transduction or the ARG transmission is accomplished by another biological process such as bacterial conjugation without the involvement of bacteriophages. In the second case, the phages abundance is expected to be proportional to the host abundance. In the second case, the correlation between the abundance of certain phage taxa and ARG is expected to be merely a result of the abundance their hosts, bearing the ARGs. In order to test the two hypotheses, we estimate the relative risk of phages using a Bayesian spatial model which incorporates the spatial information of the samples and controls for the host bacteria abundances.
Since the samples in the CAMDA2021 challenge have spatial information such as latitude and longitude and previous studies [Citation10, Citation39] indicated that metagenomics taxa profiles exhibit spatial correlations we use a Bayesian hierarchical model, in particular Besag–York–Mollie [Citation22], which is a convolution model with a CAR prior. The model uses a spatial neighbourhood matrix W which measures the distance between the samples based on the available geographic information such as latitude and longitude. The model will estimate the phage’s risk which is a posterior estimate of the SIR ratio (Observed/Expected) of a phage across the samples where the expected abundances are proportional to the corresponding host bacteria taxa counts. The model includes the AMR category (low vs high) as a potential factor. If the phage’s relative risk is higher than 1 and the AMR category credible set does not include zero we can conclude that the phage’s abundance is higher than what we would expect based on the host bacteria counts and this higher risk can be partially explained by the antimicrobial category status. For example, one AMR group (e.g. high) has an increased risk while the other group (e.g. low) has a decreased risk relative to the expected numbers which are proportional to the phage’s host bacteria. The corresponding host bacteria for each phage were queried from https://www.genome.jp/virushostdb/. In case where phages infect more than one bacteria we include the additional host bacteria abundance in the model. For a description of the model in more strict mathematical terms, see Lawson [Citation37].
Here ν are spatially unstructured random effects that assume normal distribution while u are the random effects that capture the spatial autocorrelation between the samples. Then . We use
(Normalized Distance) which is the neighboring matrix between samples latitude and longitude positions. The response is assumed to follow Poisson distribution and it accounts for overdispersion
and this is an advantage over the pure Poisson model. We use the Bayesian setting implementation in R 3.6.3 package CARBayes [Citation40], where inference is based on Markov chain Monte Carlo simulation (MCMC) [Citation35, Citation41]. The model is fit with the function S.CARbym from the above package. Moran’s I test [Citation42] was used to measure the spatial autocorrelation. The model convergence is also checked by Geweke z-scores [Citation43]. We further calculate the correlations between phages and specific ARGs.
Results
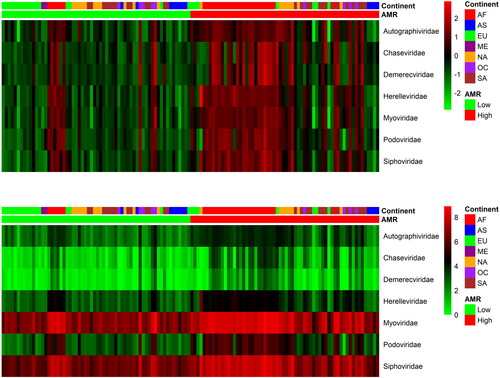
From the applied CoDa analysis, we obtained 136 phages which differentiate the two categories: High AMR and Low AMR levels as it was set up by the sum of relative ARGs counts (Pangea.org within the CAMDA challenge). One hundred and fourteen of them had significantly higher abundance (by FDR) in the High AMR group, while 22 had significantly lower abundance (by FDR) in the same High AMR group. The two heatmaps in show the distribution of those phages across the continents. The abundance levels were pooled by phages families and the Myoviridae family was over-represented in the group of differentially abundant phages.
Figure 1. Scaled and not scaled log transformed RPM (reads per million) top differentially abundant phages (FDR, Welchs t test with Benjamini–Hochberg < 0.05) pooled by the corresponding families. The phages in the family Myoviridae are overrepresented (p < 0.01) in the set that differentiated high and low AMR samples. AF Africa, AS Asia, EU Europe, NA North America, ME Middle East, OC Oceania, SA South America.
Further, we calculated the correlations between more detailed levels of phages (e.g. species) and ARGs. There were two major bi-clusters of strongly positive correlations (>0.8). Among the top correlated genes in the larger bi-cluster were arcB, parE, rpoB and tufAB, which were correlated mostly with the Myoviridae phage family. The other cluster involved genes such as blaZ, ermX, mphC, tetK, vga and the corresponding correlated phages, mostly from the Siphoviridae family. The phages in one of the clusters were negatively correlated with the ARGs from the other cluster.
Alpha diversity measures (Chao1, Shannon and Simpson) were compared between the groups of High and Low AMR samples and also across the continents. All indices showed different diversity distributions across the samples according to their AMR status with Kruskal–Wallis test p-values <0.001 for Chao1 and Shannon indices and p = 0.05 for Simpson index. Pairwise Kruskal–Wallis test was performed to compare differences in alpha diversity measures across continents. Significant differences adjusted for multiple comparisons were found between AF(943) and EU(1209), AF(943) and SA(1356), EU(1209) and OC(685), NA(1165) and OC(685) and between OC(685) and SA(1356) for Chao1 index; AF(5.24) and NA(5.6), AF(5.24) and SA(5.8) and between OC(5.19) and SA(5.8) for Shannon index; AF(0.987) and SA(0.99) and EU(0.988) and SA(0.99) for Simpson index. SA had the highest diversity measures while OC had the lowest Chao1 and Shannon indices.
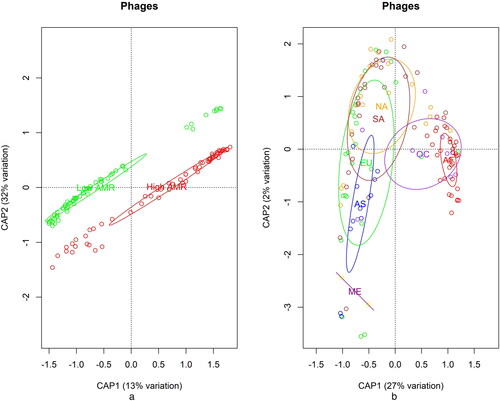
Constrained analysis of Principal Coordinates using Bray Dissimilarity index for phages () showed clear differentiation between the High and Low AMR samples () and also within the continents (). From these analyses, the profiles of phages from Africa and Oceania were more distinct than the others and their samples were separate from the other continents. We performed PERmutational MANOVA in R with the function adonis2 using Bray–Curtis dissimilarity and 1000 permutations. The results were significant (p < 0.001) for both the effect of the AMR group and the continent.
Figure 2. Distributions of phages. Distribution across Category (a), high AMR (red) and low AMR (green); and distribution across Continents (b), AF Africa, AS Asia, EU Europe, NA North America, ME Middle East, OC Oceania, SA South America.
Our next analysis step used Lasso regression in the context of machine learning (R package caret) to select phages that can differentiate the two AMR categories and can be used as predictors for the AMR status. The model achieved high sensitivity (0.9) and specificity (0.95). The top features with non-zero coefficients were mainly from the two most frequent family classes Myoviridae (Escherichia phage RCS47, Synechococcus phage ACG-2014d, Cyanophage Syn30, Synechococcus phage S-SM2, Psychrobacter phage pOW20-A, Acinetobacter phage Ac42) and Siphoviridae (Skunavirus, Bacillus virus SPbeta, Enterobacteria phage YYZ-2008, A. phage Bphi-B1251, Sitaravirus, Enterobacteria phage cdtI) as well as Autographiviridae (Pseudoalteromonas phage RIO-1) and Podoviridae (Escherichia phage TL-2011b).
Bayesian spatial analysis was used in the study mainly to estimate the relative risk of phage abundance compared to their host abundance. We used as examples two bacteria (Salmonella enterica and Staphylococcus aureus) which are recently studied as part of generalized transduction process [Citation44] and their corresponding phages are found in the virus–host database https://www.genome.jp/virushostdb/. shows the relative risk (i.e. adjusted for the host bacteria abundance). AMR category was used as a covariate to test the effect on the phage abundance. Staphylococcus aureus-related phages showed differences among AMR category with the credible set not containing zero and average relative risk higher in the High AMR group (). Salmonella enterica showed similar profiles across continents, where were also not different among the AMR groups with the credible set containing zero (). The higher observed relative risk can also be due to additional host bacteria abundance, which is not accounted for, since phages often affect similar bacteria.
Figure 3. Relative risk (log scale) plots based on Bayesian hierarchical model for the pulled abundance for all phages that are associated with Staphylococcus aureus (a), Staphylococcus aureus and Acinetobacter baumannii (b) and Salmonella enterica (c). Here, the SIR ratio is observed phage abundance while expected is proportional to their host abundance. AF Africa, AS Asia, EU Europe, NA North America, ME Middle East, OC Oceania, SA South America.
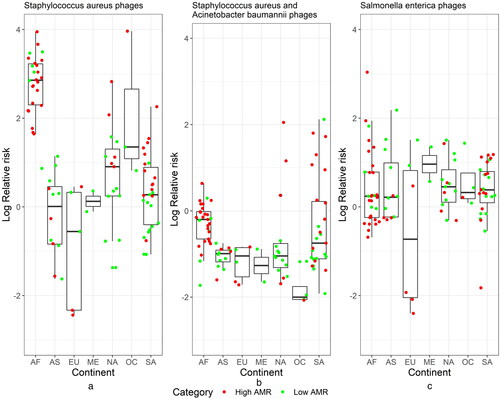
For example, some phages that infect S. aureus also infect A. baumannii. Adding this host will reduce the relative risk but still the average relative risk for the high AMR group will be about 4 times greater than the one for the low AMR group with the creditable set not containing zero (). Due to the relatively small sample size with available spatial information especially for Europe, Oceania and Middle East we need to reconfirm the findings with additional samples. This model will be very useful when we have closely related municipalities and cities so we can track how the phages evolve and if their relative risk changes across borders. This is very similar to the disease mapping model but in this setting the virus is a bacteriophage and the human host are bacteria. Here, to improve the accuracy, we can use several factors as potential covariates: AMR category, continents, cities, climate conditions and other relevant information.
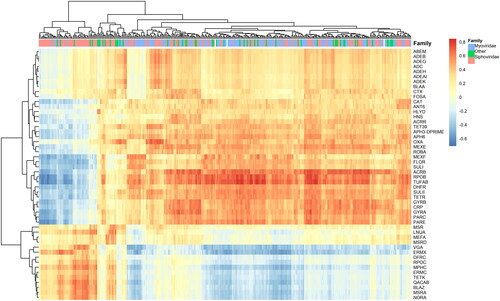
Here we calculated the correlations between phages (on the level of species and families) and ARGs. There were two major bi-clusters between phages and ARGs of strongly positive correlations (). Among the top correlated genes in the larger bi-cluster were arcB, parE, rpoB and tufAB correlated mostly with the Myoviridae phage family. The other bi-cluster involved genes such as blaZ, ermX, mphC, tetK, vga and the corresponding correlated phages, mostly from the Siphoviridae family. The phages in one of the bi-clusters were negatively correlated with the ARGs from the other bi-cluster. We also observed strong positive correlations between phages related to S. aureus and the ARGs tetK, blaZ, ermC, which confirms the transduction related events for this bacterial species listed in Hassan et al. [Citation45].
Figure 4. Correlations among phages and ARGs. The two clusters are between phages from Myoviridae family and genes such as acrB, parE, rpoB and tufAB and Siphoviridae and genes such as blaZ, ermX, mphC, tetK, vga.
Discussion
The role of bacteriophages in the horizontal spread of ARG has been investigated by many authors with controversial results. Enault et al. [Citation5] found that ARGs are rarely encoded in phages’ genomes. On the other hand, Rodr guez-Rubio et al. [Citation46] found that armA into phage capsids was up to 10000 times more frequent than in large plasmids. A significant correlation between phages and ARGs was observed [Citation8], indicating that phages may play a role in ARG dissemination. Due to a low abundance of the phages identified, further studies are needed to establish the relationship between phages and ARGs. Some of the findings indicate that phages in sewage environment are widely distributed as free-living phages not always associated with bacteria and persisting longer than their host. In our work, we confirm those findings by observing strong correlations between phages and ARGs as well as increased relative risk (higher than expected phage presence in some samples) which is correlated to the AMR category.
The goal of our study was to examine the relationship between bacteriophages and AMR. We developed a set of different and interlinked approaches to answer this question. Based on the compositional differential abundance analysis, we found that phages which differentiate the AMR category and are highly correlated with the ARGs are overrepresented by the Myoviridae family. Beta diversity measures differentiate between the AMR categories and the continents. Samples from South America have the highest alpha diversity indices and Oceania is among the continents with lowest alpha diversity indices. It is possible to make very good predictions of the AMR categories based on phages abundance using Lasso regression.
In our analysis, we used a Bayesian hierarchical model to take into account the geographical location of the samples and estimate the relative risk of the phages by incorporating information about their host bacteria. The bacteriophages can transmit the ARGs through bacterial transduction or the ARG transmission can occur through bacterial conjugation without the involvement of bacteriophages. In the second case, the phages abundance is expected to be proportional to the host abundance. Bayesian spatial analysis can help us to test the hypotheses about the role of the phages in the dissemination of ARG by examining how the phages evolved across spatially correlated samples using both phages and hosts abundances. This model will be very useful when we have closely related municipalities and cities so we can track how the phages evolve and if their relative risk changes across borders. To improve the accuracy of the model, we can further use several additional factors as potential covariates: climate conditions and antibiotic usage. Such analogous approaches are adapted in disease mapping model [Citation37] where the virus is a bacteriophage and the corresponding host are bacteria.
Conclusions
The CoDa analysis identified phages showing different abundances between high and low AMR groups. The majority of these phages belonged to the Myoviridae family.
Diversity measures showed significantly different diversity distribution across samples, with South America and Oceania having the highest and lowest diversity indices, respectively.
Using machine learning, we identified phages that could be used as predictors of AMR status: the identified taxa belonged mainly to the Myoviridae and Siphoviridae families.
The spatial Bayesian model showed a higher relative risk of phage abundances in the high AMR group when controlling for host abundance, which indicates that phages may play a role in ARG dissemination.
In future, we plan to continue our work by: using larger databases for viruses and phages within CAMDA and MetaSUB projects. This will allow to use more samples (e.g. equal number of low and high AMR samples within each continent) and to extend the model by including interactions between AMR category and geographical locations. Such new extension of the work will provide an opportunity to include more relevant covariates in the Bayesian model and to develop additional ways to define the expected (E) phage abundance.
Authors’ contributions
MZh, RY and DV wrote the paper. RY and MZh analyzed the data. ST collect the data. IM integrated and preprocess the data.
Disclosure statement
No potential conflict of interest was reported by the authors. The opinions expressed in this work are personal and do not represent in any way Bristol Myers-Squibb. No Bristol Myers-Squibb resources were used to generate results or prepare this paper.
Data availability statement
The datasets analyzed in this study can be found at http://camda2022.bioinf.jku.at/agreement.
Sofia University St. Kl. Ohridski
Additional information
Funding
References
- Calero-Cáceres W, Ye M, Balcázar JL. Bacteriophages as environmental reservoirs of antibiotic resistance. Trends Microbiol. 2019;27(7):570–577.
- Colavecchio A, Cadieux B, Lo A, et al. Bacteriophages contribute to the spread of antibiotic resistance genes among foodborne pathogens of the enterobacteriaceae family–a review. Front Microbiol. 2017;8:1108.
- Balcázar JL. Implications of bacteriophages on the acquisition and spread of antibiotic resistance in the environment. Int Microbiol. 2020;23(4):475–479.
- Subirats J, Sànchez-Melsió A, Borrego CM, et al. Metagenomic analysis reveals that bacteriophages are reservoirs of antibiotic resistance genes. Int J Antimicrob Agents. 2016;48(2):163–167.
- Enault F, Briet A, Bouteille L, et al. Phages rarely encode antibiotic resistance genes: a cautionary tale for virome analyses. ISME J. 2017;11(1):237–247.
- Chevallereau A, Pons BJ, van Houte S, et al. Interactions between bacterial and phage communities in natural environments. Nat Rev Microbiol. 2022;20(1):49–62.
- Auslander N, Gussow AB, Benler S, et al. Seeker: alignment-free identification of bacteriophage genomes by deep learning. Nucleic Acids Res. 2020;48(21):e121.
- Strange JE, Leekitcharoenphon P, Møller FD, et al. Metagenomics analysis of bacteriophages and antimicrobial resistance from global urban sewage. Sci Rep. 2021;11(1):1–11.
- Hendriksen RS, Munk P, Njage P, et al.; The Global Sewage Surveillance Project Consortium. Global monitoring of antimicrobial resistance based on metagenomics analyses of urban sewage. Nat Commun. 2019;10(1):1–12.
- Danko D, Bezdan D, Afshinnekoo E, et al. Global genetic cartography of urban metagenomes and anti-microbial resistance. BioRxiv 724526; 2019. doi:10.1101/724526
- Torres-Barceló C. The disparate effects of bacteriophages on antibiotic-resistant bacteria. Emerg Microbes Infect. 2018;7(1):1–12.
- Do DT, Le TQT, Le NQK. Using deep neural networks and biological subwords to detect protein s-sulfenylation sites. Briefings Bioinf. 2021;22(3):bbaa128.
- Le NQK. Fertility-gru: identifying fertility-related proteins by incorporating deep-gated recurrent units and original position-specific scoring matrix profiles. J Proteome Res. 2019;18(9):3503–3511.
- Le NQK, Huynh T-T. Identifying snares by incorporating deep learning architecture and amino acid embedding representation. Front Physiol. 2019;10:1501.
- http://camda2021.bioinf.jku.at/start; 2021.
- Pawlowsky-Glahn V, Egozcue JJ, Tolosana-Delgado R. Modeling and analysis of compositional data. Chichester: John Wiley & Sons; 2015.
- Chao A. Nonparametric estimation of the number of classes in a population. Scand J Stat. 1984;11(4):265–270.
- Shannon CE, Weaver W. The mathematical theory of communication. Urbana (IL): University of Illinois Press; 1949.
- Simpson EH. Measurement of diversity. Nature. 1949;163(4148):688.
- Bray JR, Curtis JT. An ordination of the upland Forest communities of Southern Wisconsin. Ecol Monogr. 1957;27(4):325–349.
- Tibshirani R. Regression shrinkage and selection via the lasso. J Roy Stat Soc: Ser B (Methodological). 1996;58(1):267–288.
- Besag J, York J, Mollié A. Bayesian image restoration, with two applications in spatial statistics. Ann Inst Stat Math. 1991;43(1):1–20.
- Menzel P, Ng KL, Krogh A. Fast and sensitive taxonomic classification for metagenomics with Kaiju. Nat Commun. 2016;7(1):11257–11259.
- Mende DR, Letunic I, Huerta-Cepas J, et al. Progenomes: a resource for consistent functional and taxonomic annotations of prokaryotic genomes. Nucleic Acids Res. 2017;45(D1):D529–D534.
- Malone B, Searle R, Malone B, et al. Updating the Australian digital soil texture mapping (part 1*): re-calibration of field soil texture class centroids and description of a field soil texture conversion algorithm. Soil Res. 2021;59(5):419–434.
- Aitchison JA. Compositional data analysis. London (UK): Chapman and Hall; 1986.
- Hinton AL, Mucha PJ. Differential compositional variation feature selection: a machine learning framework with log ratios for compositional metagenomic data. bioRxiv 2021.12.08.471758; 2021. doi:10.1101/2021.12.08.471758
- Fernandes AD, Macklaim JM, Linn TG, et al. Anova-like differential expression (aldex) analysis for mixed population RNA-seq. PLoS One. 2013;8(7):e67019.
- Xia Y, Sun J, Chen D-G. Community diversity measures and calculations. In: Xia Y, Sun J, Chen D-G, editors. Statistical analysis of microbiome data with R, ICSA book series in statistics. Singapore: Springer, 2018. p. 167–190.
- Oksanen J, Blanchet FG, Kindt R, et al. Vegan: community ecology package. R Package Version 2.4-1; 2016.
- Kuhn M, Wing J, Weston S, et al. caret: classification and regression training. r package version 6.0-86; 2020. Available at: https://cran.r-project.org/web/packages/caret/caret.pdf(accessed March 20, 2020).
- Friedman JH, Hastie T, Tibshirani R. Regularization paths for generalized linear models via coordinate descent. J Stat Softw. 2010;33(1):1–22.
- Hoerl AE, Kennard RW. Ridge regression: biased estimation for nonorthogonal problems. Technometrics. 1970;12(1):55–67.
- Emmert-Streib F, Dehmer M. High-dimensional lasso-based computational regression models: regularization, shrinkage, and selection. MAKE. 2019;1(1):359–383.
- Zhelyazkova M, Yordanova R, Mihaylov I, et al. Origin sample prediction and spatial modeling of antimicrobial resistance in metagenomic sequencing data. Front Genet. 2021;12:642991.
- Zhelyazkova M, Yordanova R, Mihaylov I, et al. Bayesian hierarchical modelling for antimicrobial resistance. In: Sotirov SS, Pencheva T, Kacprzyk J, Atanassov KT, Sotirova E, Staneva G, editors. Contemporary methods in bioinformatics and biomedicine and their applications, lecture notes in networks and systems. Cham: Springer International Publishing; 2022. p. 79–87.
- Lawson AB. Bayesian disease mapping: hierarchical modeling in spatial epidemiology. New York: Chapman and Hall/CRC; 2018.
- Yang Y, Chen N, Chen T. Inference of environmental factor-microbe and microbe-microbe associations from metagenomic data using a hierarchical bayesian statistical model. Cell Syst. 2017;4(1):129–137.e5.
- Ryan FJ. Application of machine learning techniques for creating urban microbial fingerprints. Biol Direct. 2019;14(1):13.
- Lee D. Carbayes: an R package for Bayesian spatial modeling with conditional autoregressive priors. J Stat Softw. 2013;55(13):1–24.
- Carlin BP, Chib S. Bayesian model choice via Markov chain Monte Carlo methods. J Roy Stat Soc: Ser B (Methodological). 1995;57(3):473–484.
- Gittleman JL, Kot M. Adaptation: statistics and a null model for estimating phylogenetic effects. Syst Zool. 1990;39(3):227–241.
- Geweke J. Evaluating the accuracy of sampling-based approaches to the calculations of posterior moments. Bayesian Stat. 1992;4:641–649.
- Fillol-Salom A, Alsaadi A, de Sousa JAM, et al. Bacteriophages benefit from generalized transduction. PLoS Pathog. 2019;15(7):e1007888.
- Hassan AY, Lin JT, Ricker N, et al. The age of phage: friend or foe in the new dawn of therapeutic and biocontrol applications? Pharmaceuticals. 2021;14(3):199.
- Rodríguez-Rubio L, Serna C, Ares-Arroyo M, et al. Extensive antimicrobial resistance mobilization via multicopy plasmid encapsidation mediated by temperate phages. J Antimicrob Chemother. 2020;75(11):3173–3180.