
Abstract
The refractive result is a criterion for the quality of surgical correction of cataract. The aim of this study was to analyze the refractive results obtained in calculating the optical power of intraocular lens (IOL), by applying the formulas Holladay II and Barrett Universal II, in the treatment of patients. The study was conducted over a period of 2 years and analyzed the results obtained in 235 eyes of 160 patients (80 women and 80 men) who underwent surgery at the MMA Eye Clinic (Sofia) between May 2018 and December 2020. A complete ophthalmological examination was performed. Surgical methods included performing uncomplicated phacoemulsification with intracapsular implantation of intraocular lens (IOL) in all patients. The effectiveness of the applied surgical procedure was determined by the implementation of the intended postoperative result (Target) and achieved postoperative uncorrected visual acuity (UCVA). A month after operation in 49 eyes (85.1%) the UCVA was over 0.8, which is a very good postoperative result. In both applied formulas, the postoperative, refractive results were best in eyes of normal axial length, followed by cases of hyperopic refraction. There was greater inaccuracy in eyes with longer axial length, and lastly there were eyes with hyperopic refraction. The obtained results support the understanding that there is currently no ideal formula to give the desired, postoperative refraction for all eye types. The analysis of postoperative results is essential for modern medical practice.
Introduction
Cataract surgery is a common surgical procedure worldwide. The great frequency of this condition determines the great importance of cataract surgery. The exact refractive result is a mandatory criterion for the quality of surgical correction [Citation1]. In recent years, the demands of cataract patients regarding postoperative visual acuity have greatly increased. This has led cataract surgery to become refractive surgery as well. The study of the dioptric power of the intraocular lens has become a target point of cataract surgery [Citation2]. The exact refractive result depends on many factors, one of the most important of which is the choice of refractive formula to calculate the intraocular lens (IOL) power. With the introduction of modern formulas for calculating the dioptric power of generation III and IV, IOLs have significantly improved postoperative refractive outcomes. Today more and more efforts of physicists, mathematicians and surgeons are directed towards discovering a universal formula giving the desired visual acuity for all types of eyes. After half a century of clinical trials, the search for a universal formula still continues [Citation3].
In recent years, IV generation formulas, Holladay II and Barrett Universal II, have entered clinical practice. These formulas determine not the anatomical but the virtual position of the IOL. In 1993, Jack T. Holladay [Citation4, Citation5]continued the research and proposed a formula for calculating the dioptric power of an IOL called Holladay II (H-II). This formula determines effective lense position (ELP) using the following seven parameters: axial length (AL), keratometry (K), horizontal diameter of the cornea known as horizontal white-to-white (Hwtw), refraction, anterior chamber depth (ACD) preoperatively, thickness of the lens (LTD), the patient’s age [Citation6]. By dividing the eyes into 3 main groups, according to the value of Hwtw (normal, small and wide), it is found that there are 9 possible eye patterns according to the axial length (AL). By creating these differentiations in eye type, the Holladay II formula allows for a more accurate calculation of effective lens position (ELP) in eyes with a shorter axis than their predecessors.
In 1993, Dr. Graham D. Barrett created the Barrett I formula, which in 2010 was modified as the Barrett Universal II (BU-II). This formula calculates the power of the IOL, taking into account the keratometric parameters, the depth of the anterior chamber of the phakic eye, and the axial length of the eye. This is the first formula that takes into account the optical configuration of the IOL, through the term ‘Lens Factor’ [Citation7].
In 2020, a prospective study was conducted to evaluate the accuracy of the BU-II formula in the Asian-Indian population [Citation7]. It covers 244 eyes divided into 3 groups according to AL. The results indicate that the BU-II formula is one of the most accurate formulas for calculating IOL optical power in short, intermediate, and long axial length eyes compared to all other existing formulas. According to this and many other studies, this formula gives the lowest percentage of refractive surprise (<1.0D), which is why it can be called ‘universal’.
The aim of the present study was to analyze the refractive results obtained when calculating the optical power of the IOL by applying the Holladay II and Barrett Universal II formulas, in the treatment of cataract patients. To review and analyze the refractive outcomes obtained after cataract surgery in patients on the basis of these two formulas, we made a distribution of cases according to keratometric, biometric and optical indicators; analyzed the sources of refractive errors related to keratometric, biometric indicators and the choice of refractive formula; and determined the effectiveness of the applied surgical procedure. The analysis of postoperative results is essential for modern medical practice. It makes it possible to measure the effectiveness of the surgical procedure and to improve the individual ophthalmic practice.
Subjects and methods
Ethics statement
The study was conducted in accordance with the principles of the Declaration of Helsinki and the patients gave informed consent, the purpose of the study being explained to them in detail.
Patients and study design
A retrospective case-control analysis of 235 eyes of 160 patients (80 women and 80 men) was performed. The study was carried out over a period of 2 years and all patients underwent surgery at the Eye Clinic of the Military Medical Academy (MMA), Sofia, Bulgaria, between May 2018 and December 2020.
The inclusion criteria were: patients with cataract, at the age of 80 years or younger; implanted intraocular lense (IOL) with intracapsular localization.
The exclusion criteria were: glaucoma, corneal diseases, previous corneal refractive surgery or other intraocular intervention, history of ocular inflammation, diseases of the macula and posterior pole.
Patients were selected into two groups based on whether they had a refractive error greater than ±0.50D (cases) or less than ±0.50D (controls). The selection of cases and controls was hospital-based, using the registers of the MMA-Sofia.
Ophthalmological methods
All patients underwent a complete ophthalmological examination, which included: visual acuity test: pre- and post-operative; tonometry; biomicroscopy, ophthalmoscopy, measurement of biometric data (K1, K2, hWtw, AC, L, Cyl) using the preoperative module of the Verion device; immersion ultrasound biometry (Ocuscan RXP) - to measure the AL of the eyeball; application of the IV generation formulas to determine the dioptric power of the IOL, the Holladay II and Barrett Universal II formulas.
Surgical methods
Patients were operated on by the phacoemulsification method, with implantation of IOL. The orientation of the toric implants intraoperatively was carried out using the intraoperative module of the Verion device.
Data analysis
SPSS (Statistical Package for the Social Sciences) version 20.0 was used to process the data. Quantitative variables were represented by summarizing statistical characteristics like mean, median, mode, standard deviation (SD), maximum and minimum value. One-Sample Kolmogorov-Smirnov test was used to check the shape of the frequency distribution. Most often the check was against the shape of the normal distribution. Chi-square test or Fisher’s exact test was used when examining dependencies between descriptive data with two or more categories. The non-parametric Mann-Whitney test was applied when comparing two independent groups (used for rank data or when the shape of the frequency distribution was different from the shape of the normal distribution). Binary logistic regression was applied to quantify the factorial dependence of one binary variable and different factor variables. The obtained statistics show the degree and direction of influence of the studied factor on the binary dependent variable. The threshold level of significance adopted was α = 0.05. The corresponding null hypothesis was rejected when the p-value was less than α.
Results
This study included 235 eyes of 160 patients who underwent phacoemulsification surgery with IOL implantation. Eighty-three patients were operated monocularly (52.5%) and 76 patients binocularly (47.5%). The arithmetic mean value of the patients’ age was 71.42 years (mean). The minimum age was 47 years and the maximum age 93 years. The number of female patients was 80 (50.0%), and the male patients were also 80 (50.0%). A distribution of the cases by gender and age is presented in , and by the time of the control examinations, in .
Table 1. Distribution of cases by age and gender.
Table 2. Distribution of cases by checkup.
The patients in whom the Holladay II formula was applied were 122 (51.9%), while the patients in whom the Barrett Universal II formula was used were 113 (48.1%).
About 40% of refractive errors were due to inaccurately measured parameters from antherior segment [Citation8, Citation9]. Accurate measurement of corneal optical power is extremely important in IOL calculation. The devices for keratometry (keratometers, corneal topographers) measure the radius of curvature of the anterior corneal surface using different refractive indices. In our study, an autokeratometer with an index of 1.3375 was used. The procedure of measuring the keratometric indicators was performed relatively equally and correctly and was not a source of refractive error. The average values of the keratometric indicators are presented in . The allocation by biometric indicators is shown in .
Table 3. Average values of keratometric indicators.
Table 4. Average values of biometric indicators.
By means of Chi-Square analysis, the relative risk (OR) for the occurrence of AEs was determined in three subgroups according to the befCyl value: below and above 0.75D; 1.0D; and 2.0D. The largest relative share with AE > 0.50D was in the subgroup befCyl > 2.0D (84.30%); followed by the subgroup with befCyl:1.0D-2.0D (46.40%); and the subgroup with befCyl < 1.0D had the smallest share (32.2%). The differences in the relative shares are statistically significant ().
Figure 1. Relative proportion of eyes with AE < 0.50D, AE > 0.50D and befCylD value.
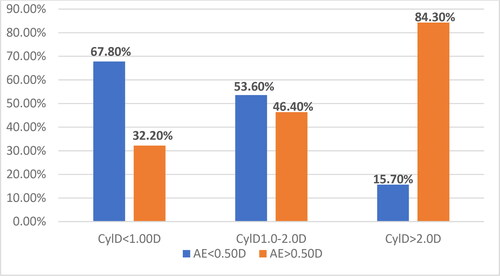
In the present study, the results showed that the relative risk (OR) for the occurrence of refractive error AE > 0.50D increased with increasing value of the preoperative cylinder ().
Table 5. Relative risk of refractive error according to befCyl D value.
The biometric indicators that were measured preoperatively by immersion ultrasound biometrics were assessed with the Kolmogorov-Smirnov test for normal distribution. In this test, there was a statistically significant difference between the two studied groups in the average value (Mean) of the parameters AL, ACD, LT, V, ASD/AL. In the group of AE >0.50D, cases had a longer axial length (AL), a shallower anterior chamber (ACD), a thinner lens thickness depth (LTD), a larger vitreous depth (VD), and a smaller anterior segment depth (ASD/AL) ratio. The non-parametric Mann-Whitney U test for the difference between the average values in the two studied groups, showed that there was a statistically significant difference only for the ratio of ACD/AL, and in the group with AE > 0.5D this indicator was smaller ().
Table 6. Inspection of the distributions in the two groups.
Axial length is a significant risk factor in calculating the optical power of IOL. It has been proven that an error in AL measurement of 0.11 mm corresponds to a refractive error of 0.38D [Citation10]. The most accurate and longest AL is measured via optical biometry (OPT-BM); whereas a shorter AL is measured via immersion ultrasound biometry (US-BM) [Citation11, Citation12]. The highest percentage of relative share of cases with AE > ±0.50D was in high and ultrahigh degree of myopia (>3.0D). The smallest relative share of cases with AE > ±0.50D was found in emmetropic eyes; in hyperopic eyes it was larger, and in myopic eyes it was the largest [Citation10].
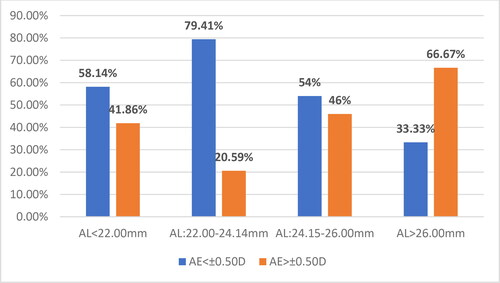
OPT-BM has a number of advantages over US-BM, but many studies indicate that there is a high percentage of cases in which it cannot be used due to dense, mature or posterior subcapsular cataracts [Citation13]. The present study found that, among all 235 cases, the largest relative share with AE> ±0.50D was in the subgroup with AL > 26.00 mm (4 cases, 66.67%), followed by the subgroup with AL of 24.15–26.00 mm (23 cases, 46.0%), the subgroup with AL < 22.00 mm (18 cases, 41.86%), and finally the group with AL of 22.00–24.14 mm (28 cases, 20.59%). The differences were statistically significant ().
Figure 2. Relative proportion of eyes with AE < 0.50D and AE > 0.50D in AL subgroups.
The relative shares of the eyes (N = 235 eyes) with refractive error AE < ±0.50D and AE > ±0.50D for each of the applied formulas in the different subgroups according to AL are presented in .
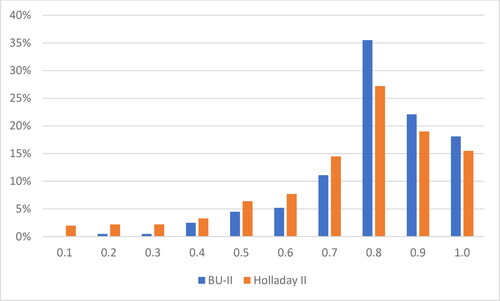
Figure 3. Distribution according to AL and refractive formula in eyes with AE< ±0.50D.
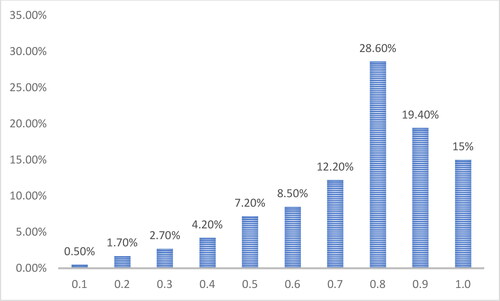
The relative share of cases with AE< ±0.50D for the cases calculated with the Barrett Universal II (BU-II) formula was 76.10%, while for the eyes calculated with the Holladay II formula (H-II), this share was 63.93%. These results are close to the highest relative share obtained using US-BM (69.5%) reported by Karabela et al. in 2017 [Citation14], and the cases calculated with the BU-II formula even exceed this result. Four weeks after operation, the largest proportion was that of the cases with registered visual acuity without correction (UCVA) = 0.8 (28.60%), followed by the cases with UCVA = 0.9 (19.40%). The cases with UCVA =1.0 (15.0%) ranked third. The rest of the cases had UCVA< 0.7 (24.80%). The arithmetic average value (mean) of UCVA was 0.7, the most frequently established mode (mode) was 0.8, the minimum registered mode (min) was 0.1, and the maximum (max) was 1.0 ().
Figure 4. Relative share of eyes with UCVA.
Note: All the 235 eyes were taken as 100%.
According to the applied formula for calculating the dioptric power of the IOL, the distribution registered UCVA of all 235 eyes, four weeks after surgery is presented in .
Figure 5. Relative share of eyes under UCVA, according to the applied formula.
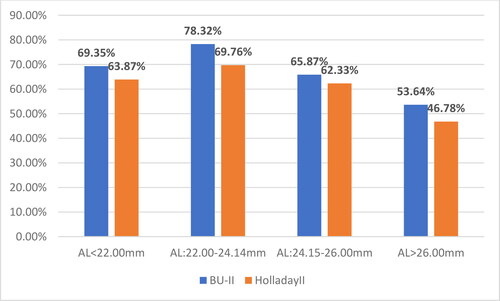
The relative share of cases with UCVA > 0.8 relative to the axial length and the applied formula for calculating the optical power of the IOL is shown in .
Figure 6. Relative share of eyes with UCVA > 0.8 according to AL and the refractive formula.
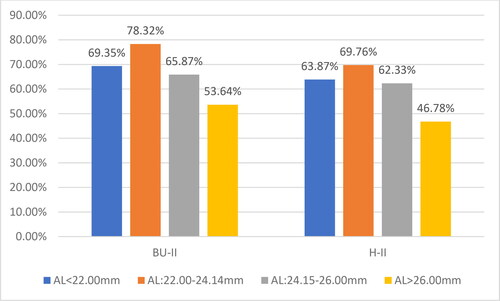
The results of the present study indicate that the largest relative share of cases with UCVA > 0.8 was in emmetropic eyes:78.32% for BU-II and 69.76% for H-II. The cases with smaller AL (hyperopic eyes) followed, with 69.35% for BU-II and 63.87% for H-II, which have close values to the group of myopic eyes. Last was ranked the group of myopic eyes with 53.64% for BU-II and 46.78% for H-II.
Discussion
In the present study, of all the measured keratometric parameters, only the cylinder value preoperatively (befCyl D) was a risk factor for the occurrence of refractive error AE > 0.50D, because in the group AE > 0.50D, the weighted average value of the cylinder was higher. In addition, the relative risk (OR) of occurrence of refractive error AE > 0.50D increased with increasing value of the preoperative cylinder. This conclusion is in agreement with other studies. For example, Behndig et al. [Citation15], found that more than half of the patients in their study were befCyl > 1.0.
The procedure of measuring the keratometric parameters before and after operation was performed relatively equally and correctly and was not a source of refractive error, since there was no significant difference in the measured values before and after surgery.
Surgically induced astigmatism in 67.9% of cases was up to ±0.50D and was not a source of refractive error.
It has been established that about 40% of refractive errors are due to inaccurately measured parameters from ASD [Citation8, Citation9]. Accurate measurement of corneal optical power is extremely important in IOL calculation. A 1.0-mm error in corneal radius measurement corresponds to a 5.70D refractive error, and a 0.50D error in keratometry results in a 0.50D error in postoperative refraction [Citation2, Citation16].
There is no relationship between the value of the parameters WTW, ACD, LT and the value of the refractive error. The refractive error is most often associated with a smaller horizontal iris diameter (WTW < 11.5 mm), shallower anterior chamber (ACD < 3.00 mm) and smaller lens thickness [Citation17, Citation18]. According to literature, there is a relationship between the proportionality of WTW and the refractive error. The higher the degree of disparity is, the greater error is found. No relationship between the diameter of the pupil and the thickness of the cornea with the appearance of a refractive error was established [Citation19, Citation20].
The formulas of the third generation (Holladay 1, SRK-T, Hoffer Q) and fourth generation (Holladay 2, Haigis, Olsen, Barret Universal II) are formulas with non-linear regression and standardized biometric and keratometric parameters. They determine the postoperative effective lens position (ELP). At this stage, the choice of refractive formula is determined by AL in millimeters () [Citation21].
Table 7. Relationship between AL and choice of refractive formula.
According to literature data and conducted studies, the best result of relative fraction of AE< ±0.50D for emmetropic eyes, using OPT-BM and optimized constants, is for the Barrett Universal II formula (80.6%) [Citation21]. From the studies conducted in 2017 with US-BM the best result is for the SRK-T formula (69.57%) [Citation14].
The best result of relative fraction of AE< ±0.50D for hyperopic eyes, using OPT-BM and optimized constants, is for the IV generation formula, Haigis (86.6%) [Citation22]. From the studies with US-BM conducted in 2016, the relative share of refractive error AE< ±0.50D is for the SRK-T formula (57.89%) [Citation22].
The best reported result for myopic eyes of relative fraction of AE< ±0.50D is obtained by using OPT-BM and optimized constants for the Barrett Universal II formula (94.2%) [Citation21]. According to the results with US-BM, the best score is for the SRK-T formula (75.00%) [Citation23].
Reports have shown that the best result of relative fraction of AE< ±0.50D for high myopic eyes is by using OPT-BM and optimized constants for the Haigis formula (81.5%) [Citation21]. From the studies with US-BM conducted in 2016, the best result was for the SRK-T formulation (50.00%) [Citation22].
It can be concluded that using the formulas for each eye type, Barrett Universal II has an advantage over Holladay II. In emmetropic and high myopic eyes the differences were greater and statistically significant, while in hyperopic and myopic eyes the differences were smaller and did not have statistical significance. From the summarized results when using the optimal formula for each eye type, the relative share of refractive error AE up to ± 0.50D is equal to 78.00%.
The effectiveness of the surgical procedure was highest in emmetropic eyes and lowest in hyperopic eyes − 53.64%. These results are similar to those published before. According to the analysis of EUREQUO from 2014 [Citation24], 72.00% have AE< ±0.50D and 90.00% have AE< ±1.00D. A study of the national Swedish Cataract Registry in 2012 showed that 55.1% of 17000 eyes achieved AE< ±0.50D, and in 2016, already 71.5% of the eyes have AE< ±0.50D, in which the desired target refraction has been achieved [Citation15]. The cases where the BU-II formula was applied showed better postoperative refractive results (75.70%) compared to the eyes calculated using the H-II formula (61.70%).
Conclusions
In this study, when using the optimal formula for each type of eye, the percentage of the relative share of the refractive error to ± 0.50D% is minimized. An ideal formula for all eye types that provides the desired postoperative refraction has not yet been found.
Authors’ contributions
TK designed the study; TK and LV examined patients and performed surgery; TK and IK analyzed the data; TK wrote the draft and revised the paper. All authors reviewed and approved the final version of the paper.
Data availability
The data that support the findings reported in this study are available from the corresponding author [T.K.] upon reasonable request. The data are not publicly available due to their containing information that could compromise the privacy of research participants.
Disclosure statement
The authors declare no conflict of interest.
Additional information
Funding
References
- Bellan L. The evolution of cataract surgery: the most common eye procedure in older adults. Geriatrics Aging. 2008;11(6):1–9.
- Popova GD. [Sources of refractive errors when calculating the optical power of intraocular lenses in the treatment of patients with cataracts], [dissertation] Sofia (Bulgaria): Militatry Medical Academy; 2018. p. 1–2. 5–6; 10–28. Bulgarian.
- Kalaidzhiev A. [Correction of refractive errors with high-tech lenses in cataract surgery] [Dissertation]. Sofia (Bulgaria): Militatry Medical Academy; 2013. p. 5–6. 11–35.
- Holladay J. International intraocular lens & implant registry. J Cataract Refract Surg. 2002;28(1):152–174.
- Holladay J. Refractive power calculations for intraocular lenses in the phakic eye. Am J Ophthalmol. 1993;116(1):63–66.
- Cordelette C, Arndt C, Vidal J, et al. Is holladay II formula acurate enough for calculating intraocular lens power in non standart eyes? J Fr Ophtalmol. 2018;41(4):308–314.
- Kuthirummal N, Vanathi M, Mukhija R, et al. Evaluation of barrett universal II formula for intraocular lens power calculation in asian indian population. Indian J Ophthalmol. 2020;68(1):59–64. 7
- Eleftheriadis H. IOL master biometry: refractive results ot 100 consecutive cases. Br J Ophthalmol. 2003;87(8):960–963.
- Norrby S. Sourses of errors in intraocular lens power calculation. J Cataract Refract Surg. 2008;34(3):368–376.
- Tachchidi HP, Pantaleev EH, Bessarabov AN. [The formula for calculating the optical power IOL «MIKOF / ALF» on the basis of parameterized schematic standard pseudophakic eyes]. Oftalmokhirurgia. 2010; 4:article8317. Russian. https://eyepress.ru/repository/record.aspx?oai:eyepress.ru:article8317
- Haigis W, Lege B, Miller N, et al. Comparisson of immersion ultrasound biometry and partial coherence interferometry for intraocular lens calculation according to haigis. Graefes Arch Clin Exp Ophthalmol. 2000;238(9):765–773.
- Rajan MS, Keilhorn I, Bell JA. Partial coherence laser interferometry vs conventional ultrasound biometry in intraocular lens power calculation. Eye (Lond). 2002;16(5):552–556.
- Cvetkovic A, Sreckovic S, Petrovic M. Comparison of biometric values and intraocular lens power calculations obtained by ultrasound and optical biometry. Ser J Exp Clin Res. 2016;17(4):321–326.
- Karabela Y, Eliacik M, Kocabora MS, et al. Predicting the refractive outcomes and accuracy of IOL power calculation after phacoemulsification using the SRK/T formula with ultrasound biometry in medium axial lengths. Clin Ophthalmol. 2017;11:1143–1149.
- Behndig A, Montan P, Stenevi U, et al. Aiming for emetropia after cataract surgery: swedish national cataract registry study. J Cataract Refract Surg. 2012;38(7):1181–1186.
- Hoffer KJ, Savini G. IOL power calculation in short and long eyes. Asia-Pac J Ophthalmol. 2017;6:330–331.
- Hashemi H, Khabazkhoob M, Emamian MH, et al. White-to-white corneal diameter distribution in an adult population. J Curr Ophthalmol. 2015;27(1-2):21–24.
- Kalogeropoulos C, Aspiotis M, Stefaniotou M, et al. Factors influencing the accuracy of the SRK formula in the intraocular lens power calculation. Doc Ophthalmol. 1994;85(3):223–242.
- Votorshilova NA. [Influence of a complex of biometric indicators on the accuracy of the calculation of optical power IOL], [dissertation abstract]., Moscow (Russia): NIIGB; 2008. Russian.
- Sabong S, Chareenun C, et al. Accuracy of holladay II formula using IOL master parameters in the absence of lens thickness value. Graefes Arch Clin Exp Ophthalmol. 2013;251:2563–2567.
- Cooke DL, Cooke TL. Comparison of 9 intraocular lens power calculation formulas. J Cataract Refract Surg. 2016;42(8):1157–1164.
- Karabela Y, Eliacik M, Kaya F, et al. Performance of the SRK-T formula using A-scan ultrasound biometry after phacoemulsification in eyes with short and long axial lengths. BMC Ophthalmol. 2016;16:96.
- Doshil D. A comparative study to assess the predictability of different IOL power calculation formulas in eyes of short and long axial lenghts. J Clin Diagnostic Res. 2017;11(1):NC01–NC04.
- European Registry of Quality Outcomes for Cataract and Refract Surgery; www.eurequo.org.