
Abstract
Phytate, as the main phosphorus store in plant foods, is largely unavailable to monogastric animals, including humans, and has both adverse anti-nutritive and beneficial therapeutic effects for its consumers. The contradictory nature of phytate requires more caution when applying it. Administered phytate directly interacts with and affects gut microbiota, which has essential roles in host health. In this study, we investigated the effects of sodium phytate on the gut microbiome of mice by high-throughput sequencing. Mice were orally gavaged with 8 mg or 40 mg of sodium phytate per day for 4 weeks. The results indicate that phytate administration reduced the growth performance of mice in a dose-dependent manner. The diversity and composition of the gut microbiota in mice were significantly altered by phytate intake. Phytate promoted the growth of certain probiotics and inhibited that of some pathogens. Phytate did not cause obvious functional changes in the gut microbiota but reduced the abundance of inositol-phosphate-synthase–producing bacteria. Our results provide additional insights into the health-promoting effects of phytate on consumers.
Introduction
The daily diet consumed by hosts provides nutrients for the gut microbiota. Many studies have demonstrated that diet significantly affects the diversity, composition and metabolic function of gut microbial communities [Citation1]. Dietary components with biological activities can directly interact with bacteria in the gut and have both potential beneficial and adverse effects on the health of intestinal microecology. Considering that the gut microbiome plays important roles in food digestion and host immune system development and responses, investigation of the effects of common active compounds in the diet on gut microbiota is of great significance to human health and the animal breeding industry [Citation2].
Phytate, which is the main form of phosphorus in plant foods such as seeds, grains and cereals, has long been considered an anti-nutrient [Citation3]. Phytate contains six phosphate groups esterified with hydroxyl groups of myo-inositol. Monogastric animals, including humans, pigs, chicken and fish, cannot use the phosphorus in phytate because of insufficient phytase activity in their digestive systems [Citation4]. Considering that phosphorus plays essential roles in cell membrane synthesis, skeletal development, cellular signalling, and mineral and energy metabolism, it usually needs to be added to feedstuffs to improve the performance of animals with commercial value in farms [Citation5]. However, superfluous phosphorus in animal faeces can cause eutrophication and pollution of soil and water. The undigested phytate in the diet as a polyanionic molecule can chelate with many mineral cations (e.g. Ca2+, Zn2+, Mn2+, Mg2+, Fe2+/3+ and Cu2+) to form insoluble salts, making them unavailable in the gastrointestinal tract (GI) [Citation6]. In addition, phytate can adversely affect the utilization of other food/feed nutrients, including proteins and carbohydrates, by forming strong complexes with them and reducing their solubility and digestibility. The activities of important hydrolytic enzymes (trypsin, lipase and amylase) in GI are also remarkably inhibited by phytate [Citation6].
Despite the anti-nutrient effects, some beneficial effects of phytate on human health have also been clearly documented. A striking anticancer action of phytate has been demonstrated in different experimental models [Citation7]. Phytate also has the potential ability to normalize glucose and cholesterol levels, reduce the glycemic index, reduce the risk of fatty liver and coronary heart disease, protect against dental caries and tooth decay and prevent pathological calcification and renal lithiasis [Citation8]. Recently, it was found that phytate can reduce mammary inflammatory responses by maintaining the integrity of the blood-milk barrier [Citation9]. The underlying mechanisms of the beneficial effects of phytate on human health include antioxidant activity, pH reduction, mineral binding, regulation of cellular signal transduction, inhibition of the cell cycle, and augmentation of natural killer cell activity [Citation6].
Accumulating evidence shows that phytate is a very important compound that frequently exists in food/feed and has considerable effects in humans and other animals. Phytate shows contradictory anti-nutrient and health-promoting effects on consumers. Given the substantial interactions between diet and microbiota, elucidation of the effects of phytate on the gut microbiome would improve our understanding in the biological function of phytate.
In this study, we investigated alterations in the gut microbial community caused by phytate administration in mice. We fed mice three diets with no, low and high levels of sodium phytate, and determined the gut microbiota by high-throughput DNA sequencing. The diversity, richness and composition of the gut microbial communities among the three groups were extensively compared.
Materials and methods
Ethics statement
Animal experiments followed the Guidelines for the Care and Use of Laboratory Animals of the Southwest Medical University, and were approved and supervised by the Ethics Committee of Southwest Medical University under permit number 20220228-015 (Date: February 28th, 2022).
Animal experiments
Thirty 4-week-old male Kunming mice were obtained from Chongqing Tengxin Biotechnology Co. Ltd. (Chongqing, China). All mice were housed at the experimental animal centre of Southwest Medical University under the following conditions: 12 h light-dark cycle, 24 ± 1 °C temperature, 55 ± 10% relative humidity and free access to feed and water. After acclimatization for 1 week, the mice were randomly allocated into three groups (5 mice per cage, 10 mice per group): Ctrl, phyA-L and phyA-H (described below). During experiments, all mice were fed a diet lacking phytate: (g/kg); casein, 200; corn starch, 503; sucrose, 150; corn oil, 50; cellulose, 50; mineral mixture, 35; vitamin mixture, 10; choline bitartrate, 2. The mice in the Ctrl (Control) group were orally gavaged with 100 μL saline per day for 4 weeks, whereas the mice in the phyA-L (low phyate) and phyA-H (high phyate) groups were orally gavaged with 100 μL saline containing 8 mg and 40 mg of sodium phytate (Sigma-Aldrich, St. Louis, MO), respectively. The body weight of each mouse was measured at the beginning of the feeding experiment and at the end, and weight gain was determined by subtracting the starting weight from the final weight. At the end of the experiment, faecal samples were collected from each mouse for microbial DNA extraction and 16S rRNA gene sequencing. The mice were sacrificed via intraperitoneal injection of 1% pentobarbital sodium, and the intestinal samples were cut into proximal sections and fixed in formalin for hematoxylin and eosin (H&E) staining.
H&E staining of colonic samples
The fixed colonic sections were subjected to H&E staining and analyzed using a BA210 digital microscope (Motic China Group Co., Ltd., Chengdu, China) at 100× magnification.
DNA extraction and 16S rRNA gene sequencing
Nine mice were randomly selected from each group to conduct gut microbiota analysis. Bacterial genomic DNA was extracted from faecal samples of each mouse with the E.Z.N.A. stool DNA kit (OMEGA, Norcross, GA), and used as a template for amplification of the hypervariable regions (V3/V4) of 16S rRNA genes. The primer pair (Sangon, Shanghai, China) used in the polymerase chain reaction (PCR) amplification was 338 F (5′-ACTCCTACGGGAGGCAGCAG-3′) and 806 R (5′-GGACTACHVGGGTWTCTAAT-3′) [Citation10]. The PCR mixture contained 12.5 μL of 2× Taq PCR MasterMix (Solarbio, Beijing, China), 1 μL of 10 µmol/L of each primer (338 F and 806 R), 2 µL of extracted DNA template (∼15 ng), 8.5 μL of deionized water. The PCR conditions were as follows: 95 °C for 5 min (initial denaturation), 30 cycles of 95 °C for 30 s (denaturation), 55 °C for 30 s (annealing) and 72 °C for 30 s (extension), with final extension at 72 °C for 10 min. The resulting PCR products were purified by gel extraction with the DNA gel extraction kit (OMEGA), and quantified using a NanoDropTM instrument (Thermo Fisher Scientific, Wilmington, NC). The sequencing libraries were paired-end sequenced on an Illumina MiSeq platform at Majorbio Technology Co. Ltd. (Shanghai, China).
Bioinformatic analysis
The obtained raw reads were first filtered using Trimmomatic software with previously reported criteria to generate valid sequences [Citation11]. Operational taxonomic unit (OTU) analysis was conducted to reveal the taxon composition of the gut microbiota in each sample. One OTU was clustered with sequences exhibiting > 97% similarity. Annotation of each OTU with taxonomic information was performed using the SILVA ribosomal RNA gene database [Citation12]. Bioinformatics analysis was performed using an online cloud platform supported by Majorbio (https://cloud.majorbio.com/).
Rarefaction curves were used to examine whether the sequences obtained for each sample were sufficient to identify the majority of the bacterial phylotypes. Venn diagrams were used to identify the shared and unique OTUs among the four groups. The α- and β-diversity of the gut microbiome among the three groups were analyzed and compared using Mothur (v.1.30.1) and QIIME 2 software. The R software package was used for principal coordinate analysis (PCoA) and hierarchical clustering tree analysis. The diagrams for relative abundance of the most dominant genera were generated using R software with stats package. A ternary plot reflected the dominant genera in the three groups was generated using GGTERN server (http://www.ggtern.com/). LDA coupled with the effect size (LEfSe) was conducted using the LEfSe program. The PICRUSt software package was used to predict functional changes in the gut microbiota by mapping the sequencing data against the Kyoto Encyclopedia of Genes and Genomes (KEGG) database [Citation13]. The abundance of microorganisms that produce specific enzymes in the gut microbiota was first predicted using the PICRUSt software package with the sequencing data, and the resulting diagrams were generated using R software with stats package.
Statistical analysis
Data are presented as mean values with standard deviation (±SD). Unless otherwise indicated, statistical analyses were performed using GraphPad Prism software (v.8.0; Boston, MA). Unpaired Student’s t test and one-way analysis of variance with a post-hoc Tukey test were performed for comparison between two groups and among three groups, respectively. Differences were considered statistically significant at the p < .05 level.
Results
Effects of phytate on growth performance and intestinal morphological features of mice
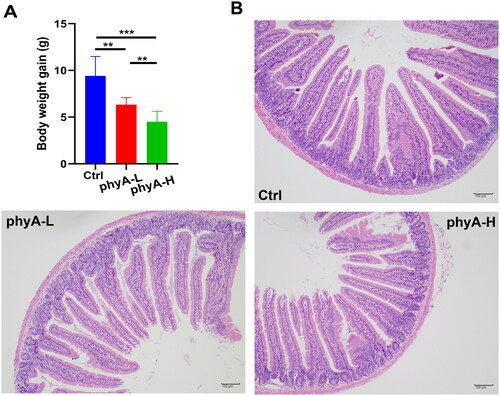
Compared to mice in the Ctrl group, the body weight gain of the mice in the phyA-L (p = .0003) and phyA-H (p < .001) groups was significantly lower (). The body weight gain of the mice decreased with an increase in the amount of phytate consumed (p = .0005). The result indicated that administration of phytate negatively affected the growth performance of mice. The H&E staining results showed that there were no significant differences in the intestinal morphological features of mice among the three groups ().
Figure 1. Body weight gain and intestinal morphological features of mice with and without sodium phytate intake. (A) Body weight gain of mice in the Ctrl, the phyA-L and the phyA-H group. Data are presented as means with SD (n = 10 for each group). (**p < .01, ***p < .001). (B) Representative colonic sections stained by hematoxylin and eosin (HE). Scale bar, 100 μm. Note: 4-week-old male Kunming mice were orally gavaged with 100 μL saline (Ctrl, Control) or 100 μL saline containing 8 mg (phyA-L, low phyate) or 40 mg of sodium phytate (phyA-H, high phyate) per day for 4 weeks.
Effects of phytate on diversity of gut microbiota in mice
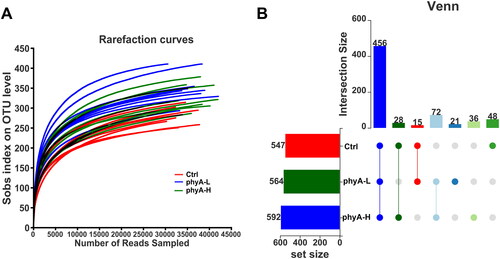
According to the rarefaction curves (), each sample in the three groups tended to reach a saturation plateau, indicating that the sequences obtained in the samples were adequate to identify the majority of bacterial phylotypes. There were 547, 564 and 592 OTUs in the Ctrl, phyA-L and phyA-H groups, respectively (). The number of shared OTUs among the three groups was 456, and the number of unique OTUs was 48, 21 and 36 in the Ctrl, phyA-L and phyA-H groups, respectively. These results indicated that phytate had little effect on OTU numbers of the gut microbiota in mice.
Figure 2. Rarefaction analysis and OTU numbers in the gut microbial community of mice with and without sodium phytate intake. (A) Rarefaction curves of OTUs in different samples from the Ctrl, the phyA-L and the phyA-H group. Sample richness in each sample is expressed by Sobs index, which is calculated with the Mothur software (v.1.30.1). The curves were generated by plotting the valid sequence numbers obtained in each sample against the richness estimator Sobs index. (B) Venn diagrams of OTU numbers in the Ctrl, the phyA-L and the phyA-H group. The diagram was generated with R software package. The unique and shared OTUs numbers among the three groups are shown. 4-week-old male Kunming mice were orally gavaged with 100 μL saline (Ctrl, Control) or 100 μL saline containing 8 mg (phyA-L, low phyate) or 40 mg of sodium phytate (phyA-H, high phyate) per day for 4 weeks.
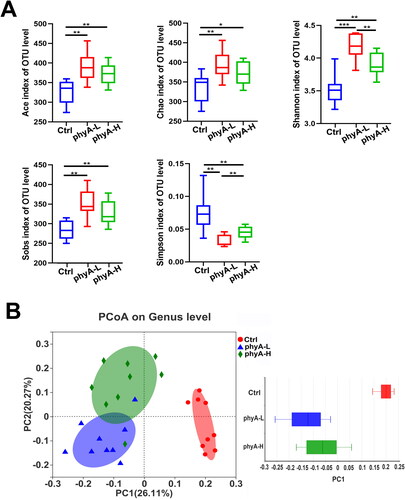
The community diversity and richness indices of the three groups were calculated and compared to determine the effects of phytate on α-diversity of the gut microbial community. Compared to those in the Ctrl group, the Ace (p = .0011 for the phyA-L group, p = .0043 for the phyA-H group), Chao (p = .0035 for the phyA-L group, p = .0237 for the phyA-H group), Shannon (p < .0001 for the phyA-L group, p = .0008 for the phyA-H group) and Sobs (p = .0003 for the phyA-L group, p = .0052 for the phyA-H group) indices were significantly increased, whereas the Simpson index was significantly decreased in the phyA-L (p = .0004) and phyA-H (p = .0066) groups (). These results suggested that the administration of phytate was associated with increased species richness and diversity of the gut microbial community in mice. The samples in the Ctrl group were clustered together and located at different branches in the hierarchical clustering tree when compared with those of the other two phytate-treated groups (Supplemental Figure S1). According to PCoA analysis, the samples in the Ctrl group were separated from those in the phyA-L and phyA-H groups (). A similar result was obtained in PLS-DA analysis (Supplemental Figure S2). All of these results demonstrated that consuming phytate was associated with a significant rearrangement of the gut microbial community in mice.
Figure 3. Diversity analysis of gut microbiome of mice with and without sodium phytate intake. (A) The α-diversity analysis of gut microbiome of mice in the Ctrl, the phyA-L and the phyA-H group. The Shannon, Simpson, ACE, Chao and Sobs indices reflecting species diversity and richness were determined and compared with the Mothur software (v.1.30.1). Data are presented as means with SD (*p < .05, **p < .01, ***p < .001). (B) PCoA analysis of the gut microbiome of mice in the Ctrl, the phyA-L and the phyA-H group. PC1 and PC2 explained 26.11% and 20.27% of the variance, respectively. A symbol in the plot represents a sample. The discrete degree of PC1 is shown in the right panel. Data were analyzed with QIIME 2 software, and the diagrams were generated with R software package. Note: 4-week-old male Kunming mice were orally gavaged with 100 μL saline (Ctrl, Control) or 100 μL saline containing 8 mg (phyA-L, low phyate) or 40 mg of sodium phytate (phyA-H, high phyate) per day for 4 weeks.
Effects of phytate on gut microbiota composition in mice
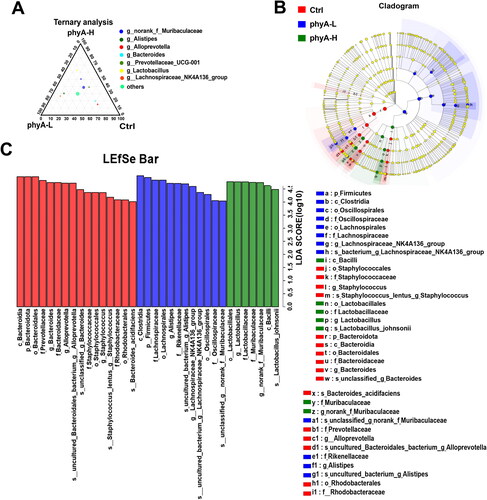
The relative abundances of the bacterial phyla identified in each group are shown in . Bacteroidetes was the most abundant phylum among the three groups and its relative abundance in the phytate-treated groups was significantly lower than that in the Ctrl group (p = .003164) (). The relative abundances of Firmicutes (p = .004018), Patescibacteria (p = .008745) and Desulfobacterota (p = .001368) were much higher in the phyA-L and phyA-H groups than in the Ctrl group. These changes in the phytate-treated groups (p = .0035 for the phyA-L group, p = .0484 for the phyA-H group) caused a reduction in the Bacteroidetes/Firmicutes (B/F) ratio (). The most abundant genera in individual samples of the three groups are shown in . The phytate-treated groups exhibited a higher abundance of the genera Lactobacillus, Alistipes and Lachnospiraceae_NK4A136_group, and a lower abundance of the genera Alloprevotella and Staphylococcus compared with that of the Ctrl group. A ternary plot was used to analyze the proportional distribution of the dominant genera among the three groups (). The changes in abundance of specific genera were also revealed by LEfSe analysis ().
Figure 4. Compositions of the gut microbiome of mice with and without sodium phytate intake. (A) Column diagrams of dominant bacterial phyla. (B) Comparation of the significantly altered phyla. (C) Bacteroidetes/Firmicutes (B/F) ratio. (D) Relative abundance of the most dominant genera. The size of the dots represents the relative abundance of each genus in the sample. The diagrams were generated using R software with stats package. Data are presented as means with SD (n = 9 for each group). (*p < .05, **p < .01). 4-week-old male Kunming mice were orally gavaged with 100 μL saline (Ctrl, Control) or 100 μL saline containing 8 mg (phyA-L, low phyate) or 40 mg of sodium phytate (phyA-H, high phyate) per day for 4 weeks.
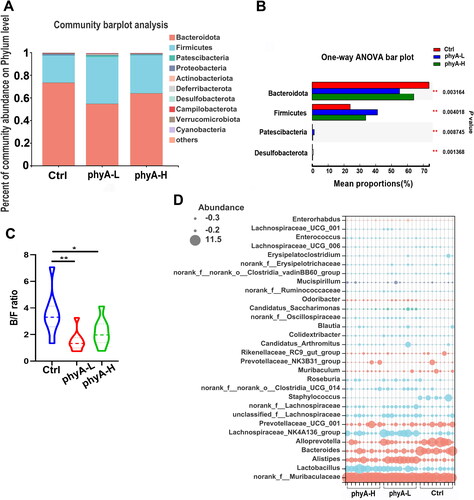
Figure 5. Ternary and LEfSe analysis of the gut microbiome of mice with and without sodium phytate intake. (A) A ternary plot reflects the dominant genera in the three groups. The diagram was generated using GGTERN server (http://www.ggtern.com/). (B) LDA effect size (LEfSe) analysis of the gut microbiome in the three groups. (C) LDA score in the three groups. The altered abundant taxa with a score > 4 in the gut microbiome in the Ctrl, the phyA-L and the phyA-H group are shown in the histogram. LEfSe analysis was performed using the online LEfSe server (http://huttenhower.sph.harvard.edu/galaxy/root?tool_id=lefse_upload). 4-week-old male Kunming mice were orally gavaged with 100 μL saline (Ctrl, Control) or 100 μL saline containing 8 mg (phyA-L, low phyate) or 40 mg of sodium phytate (phyA-H, high phyate) per day for 4 weeks.
Effects of phytate on functional changes to gut microbiota in mice
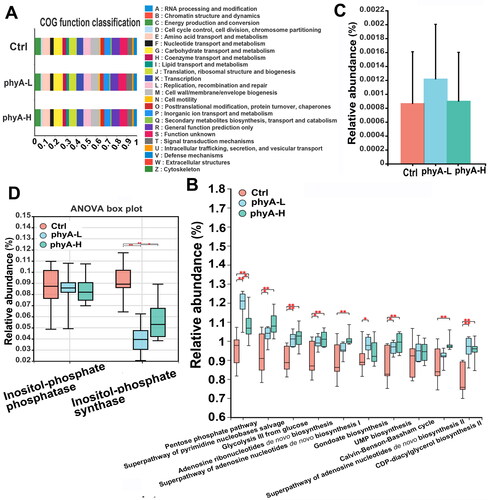
The administration of phytate resulted in no obvious functional changes, as predicted by the clusters of orthologous groups (COG) functional classification (). According to the function prediction of microbial community by PICRUSt software with 16S rRNA gene sequences, significant alterations were observed in certain metabolic pathways of the gut microbiota in the phytate-treated groups (). The abundance of phytase-producing microorganisms predicted in the phyA-L group was slightly higher than that in the other two groups (p = .3768), but with no statistical significance, indicating that consuming phytate daily did not induce an increase in phytase abundance in mice (). Interestingly, although the abundance of inositol-phosphate-phosphatase–producing microorganims was not significantly different among the three groups (p = .9963), the abundance of inositol-phosphate-synthase–producing microorganims was decreased in the phytate-treated mice compared with control mice (p < .0001 for the phyA-L group, p = .0011 for the phyA-H group) (). These results indicated that the presence of phytate or its lower myo-inositol phosphate products in the gut affected the abundance of inositol-phosphate producers in the gut microbiota in mice.
Figure 6. Functional changes of the gut microbiome of mice with and without sodium phytate intake. (A) COG functional classification analysis of the gut microbiome in the three groups. (B) The top metabolic pathways altered in the gut microbiome in the three groups. (C) Relative abundance of phytase-producing microorganisms in the three groups. (D) The relative abundances of inositol-phosphate phosphatase and inositol-phosphate synthase in the three groups. The relative abundance of microorganisms producing specific enzymes and the involved metabolic pathways were predicted with PICRUSt2 software package by mapping the gut microbial information against the KEGG database. Data are presented as means with SD (*p < .05, **p < .01, ***p < .001). 4-week-old male Kunming mice were orally gavaged with 100 μL saline (Ctrl, Control) or 100 μL saline containing 8 mg (phyA-L, low phyate) or 40 mg of sodium phytate (phyA-H, high phyate) per day for 4 weeks.
Discussion
Phosphorus is an indispensable element for all forms of life on earth and participates in many cellular structural and metabolic processes, including the synthesis of cell membranes and genetic material, cellular signal transduction and post-translational modification [Citation14]. The uptake of sufficient phosphorus from the diet is essential for the health of humans and other animals with economic value. Thus, for a long time, researchers have focused on hydrolyzing phytate, the main form of phosphorus in plant foods, and releasing free phosphorus from the diet [Citation8]. Degradation of phytate not only promotes the absorption of available phosphorus but can also diminish its anti-nutrient effects and improve the utilization of dietary minerals, proteins, carbohydrates and lipids. The methods used to sufficiently hydrolyze phytate in the diet today include fermentation, soaking, germination, cooking and supplementation with commercial phytases [Citation6].
However, accumulating evidence has demonstrated that phytate has great pharmaceutical value, as reflected by its anti-cancer, anti-inflammatory, anti-diabetes and anti-pathological calcification activities [Citation15]. Phytate has immunoregulatory effects and can maintain the colonic mucosa in a non-inflammatory state [Citation16]. However, the anti-inflammatory effects of phytate are not limited to the colon, and studies have shown that phytate can alleviate mammary inflammatory responses, pulmonary inflammation and fibrosis in murine experimental models [Citation9, Citation17]. Phytate can reduce the serum lipid levels, prevent platelet aggregation, and protect the myocardium from ischemic damage and reperfusion injury in murine models [Citation18,Citation19]. Therefore, phytate consumption has both adverse and beneficial effects.
At this point, two interesting questions arise: in which situation should we increase the hydrolysis of phytate to reduce its anti-nutrient effects, and in which situation should we employ a diet rich in phytate to use its health-promoting functions to prevent certain diseases? To answer these questions, we believe that it is important to extensively explore the effects of phytate on different physiological aspects of consumers, including their gut microbiota. Gut microbiota, as an extra ‘organ’, can regulate many aspects of the host, including colonization of pathogens, immune system development, and neuropsychiatric and metabiotic functions [Citation2]. Considering that the gut microbiota is prone to be affected by dietary components, consuming phytate may cause alterations to the composition of gut microbiota and indirectly affect consumer health [Citation20]. Therefore, to use phytate more scientifically and rationally in the future, here, we investigated the effects of phytate on the gut microbial community of mice by high-throughput sequencing.
Administration of phytate was associated with reduced body weight gain in mice in a concentration-dependent manner, suggesting that the anti-nutrient effects of phytate inhibited the growth performance of its consumers (). This finding emphasizes the importance of hydrolyzing phytate in feedstuff to promote the growth performance of monogastric animals with farm value. The diversity and composition of the gut microbial community in mice were significantly altered after phytate administration. The relative abundance of the genus Lactobacillus in mice increased in a phytate concentration-dependent manner (p = .0094 for the phyA-L group, p < .0001 for the phyA-H group) (). Several other studies have also demonstrated that phytate can upregulate the abundance of Lactobacillus in the gut microbiota of different hosts [Citation19, Citation21]. Lactobacillus is a common probiotic that has many beneficial effects on the host, including anti-inflammatory and immunomodulatory effects, promotion of epithelial barrier function, inhibition of pathogen adhesion, and generation of antimicrobial products when colonized in the gut [Citation22]. The relative abundance of the genus Alistipes was remarkably higher in phytate-treated mice than in control mice (p < .0001 for the phyA-L group, p = .0229 for the phyA-H group) (). Alistipes is a relatively new genus belonging to the phylum Bacteroidetes and is commonly isolated from gut samples of humans and mice. Studies have demonstrated both beneficial and harmful effects of this genus on host health [Citation23]. Alistipes shows positive effects against cardiovascular diseases, liver fibrosis, autism spectrum disorder and in cancer immunotherapy and colitis; however, it also plays pathogenic roles in the development of colorectal cancer, anxiety, depression and chronic fatigue syndrome. The administration of phytate reduced the abundance of the genus Alloprevotella (p = 0.0271 for the phyA-L group, p = 0.0149 for the phyA-H group), which usually causes oral dysbiotic infections in humans () [Citation24]. Phytate significantly inhibited the growth of Staphylococcus (p = 0.0265 for the phyA-L group, p = 0.0265 for the phyA-H group) (). Many species of this genus, such as Staphylococcus aureus, can cause many diseases, including skin infections, bone infections and toxic shock syndrome [Citation25]. Our findings suggest that phytate has beneficial effects on consumer health by increasing the abundance of some probiotics and decreasing the abundance of certain pathogens in gut microbiota. However, phytate also has adverse effects on the gut microbiota, as reflected by the reduction in the B/F ratio, which is an indicator of several pathological conditions.
In the gut, phytate is commonly hydrolyzed by phytases from four possible sources: plant phytase in the diet, supplemented commercial phytase, gut microbial phytase, and phytase generated by the small intestinal mucosa [Citation6]. Compared with exogenous phytases (plant phytase and commercial phytase additives), the activities of endogenous phytases (phytases from the gut microbiota and the small intestinal mucosa) are insufficient to degrade phytate. Oral administration of phytate did not stimulate the abundance of phytase-producing microorganims of the gut microbiota in mice (). This result is consistent with the findings of a previous study in rats [Citation26], and suggests that the abundance of bacteria that are known to harbor phytase-encoding genes are not affected by the increased phytate. Phytate reduced the abundance of bacteria that harbor inositol-phosphate synthase genes in the gut microbiota of mice (). Inositol-phosphate has a role in various important physiological functions, including protein folding and trafficking, enzyme stabilization, enzyme activity inhibition, regulation of transmembrane signalling, cell division and differentiation and DNA repair [Citation6]. The beneficial effects of inositol-phosphate are associated with the number and position of phosphate groups on the myo-inositol ring. Considering that hydrolysis of phytate generates a series of lower inositol-phosphate products, it could be hypothesized that supplementation and digestion of phytate could increase the generation of inositol-phosphate in the gut, and in turn may inhibit the inositol-phosphate synthase activity in the gut microbiota.
The beneficial effects of phytate have been mostly attributed to its ability to reduce pH values, antioxidize, bind metal ions, inhibit the cell cycle, regulate cellular signal transduction and enhance natural killer cell activity [Citation6]. In this study, we found that phytate could increase the relative abundance of some probiotics and decrease the relative abundances of certain pathogens in the gut microbiota, and these findings provide additional clues to reveal the health-promoting effects of phytate. Because phytate has both negative and positive effects on its consumers, its use should be monitored. Generally, improved growth performance is highly desirable in the animal farm industry. The presence of phytate with strong anti-nutrient effects would reduce the utilization of feed and is unfavourable to the growth performance of farmed animals. Thus, the digestion of phytate in feedstuff is necessary to improve the production of animals, save costs and protect the environment.
In developing countries, some populations still suffer from mineral and other nutrient deficiencies, and they usually consume unrefined cereals and/or pulses rich in phytate, which would further hinder the absorption of various nutrients. Hydrolysis of phytate by fermentation or supplementation with phytase to diminish its anti-nutrient effects is of particularly great importance for populations in developing countries. In contrast, populations in developed countries usually consume balanced nutrition or even overnutrition diets, and the presence of phytate has a lesser effect on their nutritional status. Moreover, it has been shown that consuming whole grains, legumes, and other phytate-rich foods can promote health. Considering that the so-called ‘civilization’ diseases, including colon cancer, diabetes and atherosclerosis, are relatively prevalent, the therapeutic properties of phytate, such as antioxidant, anti-calcification and anticancer properties, have great significance to populations in developed countries [Citation6]. Consuming a phytate-rich diet and reducing the hydrolysis of phytate in the human gut are highly desirable. The results presented here and in studies carried out by others suggest that phytate may have different effects on consumers in a concentration-dependent manner [Citation6]. Thus, we believe that more extensive investigations to determine the optimal dosage for human use should be conducted in the future.
Conclusions
In this study, we analyzed the effect of phytate on mice from the perspective of gut microbiota. Phytate had no considerable effects on the intestinal morphological features of mice but altered the diversity and compositions of the gut microbial community. The relative abundance of some probiotics significantly increased, whereas that of some pathogens in the gut microbiota of mice decreased after phytate administration. The results presented here can provide new clues into the health-promoting effects of phytate on consumers.
Authors’ contributions
XG: Study design, data analysis, funding and writing. LW, XL and YW: Study design; performed experiments and data analysis. JZ, ML and YY: Performed experiments. All of the authors have read and approved the final manuscript and have agreed on the submission to the journal.
Supplemental Material
Download PDF (612.9 KB)Acknowledgment
The authors thank Majorbio Technology Co. Ltd. for high throughput sequencing, and Editage (www.editage.cn) for English language editing.
Data availability statement
All data are available from the corresponding author upon reasonable request. The datasets involved in this study were deposited in the National Center for Biotechnology Information database with accession no. PRJNA884098 (https://www.ncbi.nlm.nih.gov/bioproject/?term=PRJNA884098).
Disclosure statement
The authors declare no conflict of interest.
Additional information
Funding
References
- Beam A, Clinger E, Hao L. Effect of diet and dietary components on the composition of the gut microbiota. Nutrients. 2021;13(8):1. doi: 10.3390/nu13082795.
- Adak A, Khan MR. An insight into gut microbiota and its functionalities. Cell Mol Life Sci. 2019;76(3):473–12. doi: 10.1007/s00018-018-2943-4.
- Bohn L, Meyer AS, Rasmussen SK. Phytate: impact on environment and human nutrition. A challenge for molecular breeding. J Zhejiang Univ Sci B. 2008;9(3):165–191. doi: 10.1631/jzus.B0710640.
- Humer E, Schwarz C, Schedle K. Phytate in pig and poultry nutrition. J Anim Physiol Anim Nutr (Berl). 2015;99(4):605–625. doi: 10.1111/jpn.12258.
- Zhang Z, Yang J, Xie P, et al. Characterization of a thermostable phytase from Bacillus licheniformis WHU and further stabilization of the enzyme through disulfide bond engineering. Enzyme Microb Technol. 2020;142:109679. doi: 10.1016/j.enzmictec.2020.109679.
- Kumar V, Sinha AK, Makkar HP, et al. Dietary roles of phytate and phytase in human nutrition: a review. Food Chem. 2010;120(4):945–959. doi: 10.1016/j.foodchem.2009.11.052.
- Vucenik I, Shamsuddin AM. Protection against cancer by dietary IP6 and inositol. Nutr Cancer. 2006;55(2):109–125. doi: 10.1207/s15327914nc5502_1.
- Schlemmer U, Frølich W, Prieto RM, et al. Phytate in foods and significance for humans: food sources, intake, processing, bioavailability, protective role and analysis. Mol Nutr Food Res. 2009;53(S2):S330–S375. doi: 10.1002/mnfr.200900099.
- Ran X, Liu J, Fu S, et al. Phytic acid maintains the integrity of the blood-milk barrier by regulating inflammatory response and intestinal flora structure. J Agric Food Chem. 2022;70(1):381–391. doi: 10.1021/acs.jafc.1c06270.
- Mori H, Maruyama F, Kato H, et al. Design and experimental application of a novel non-degenerate universal primer set that amplifies prokaryotic 16S rRNA genes with a low possibility to amplify eukaryotic rRNA genes. DNA Res. 2014;21(2):217–227. doi: 10.1093/dnares/dst052.
- Wu L, Li F, Ran L, et al. Insight into the effects of nisin and cecropin on the oral microbial community of rats by high-throughput sequencing. Front Microbiol. 2020;11:1082. doi: 10.3389/fmicb.2020.01082.
- Quast C, Pruesse E, Yilmaz P, et al. The SILVA ribosomal RNA gene database project: improved data processing and web-based tools. Nucleic Acids Res. 2012;41(D1):D590–D596. doi: 10.1093/nar/gks1219.
- Altermann E, Klaenhammer TR. PathwayVoyager: pathway mapping using the Kyoto encyclopedia of genes and genomes (KEGG) database. BMC Genomics. 2005;6(1):60. doi: 10.1186/1471-2164-6-60.
- Heyer CM, Weiss E, Schmucker S, et al. The impact of phosphorus on the immune system and the intestinal microbiota with special focus on the pig. Nutr Res Rev. 2015;28(1):67–82. doi: 10.1017/s0954422415000049.
- Harland BF, Morris ER. Phytate: a good or a bad food component? Nutr Res. 1995;15(5):733–754. doi: 10.1016/0271-5317(95)00040-P.
- Weglarz L, Wawszczyk J, Orchel A, et al. Phytic acid modulates in vitro IL-8 and IL-6 release from colonic epithelial cells stimulated with LPS and IL-1beta. Dig Dis Sci. 2007;52(1):93–102. doi: 10.1007/s10620-006-9320-0.
- Kamp DW, Israbian VA, Yeldandi AV, et al. Phytic acid, an iron chelator, attenuates pulmonary inflammation and fibrosis in rats after intratracheal instillation of asbestos. Toxicol Pathol. 1995;23(6):689–695. doi: 10.1177/019262339502300606.
- Lee SH, Park HJ, Chun HK, et al. Dietary phytic acid improves serum and hepatic lipid levels in aged ICR mice fed a high-cholesterol diet. Nutr Res. 2007;27(8):505–510. doi: 10.1016/j.nutres.2007.05.003.
- Okazaki Y, Sekita A, Katayama T. Intake of phytic acid and myo-inositol lowers hepatic lipogenic gene expression and modulates gut microbiota in rats fed a high-sucrose diet. Biomed Rep. 2018;8(5):466–474. doi: 10.3892/br.2018.1079.
- Markiewicz LH, Honke J, Haros M, et al. Diet shapes the ability of human intestinal microbiota to degrade phytate-in vitro studies. J Appl Microbiol. 2013;115(1):247–259. doi: 10.1111/jam.12204.
- Sekita A, Okazaki Y, Katayama T. Dietary phytic acid prevents fatty liver by reducing expression of hepatic lipogenic enzymes and modulates gut microflora in rats fed a high-sucrose diet. Nutrition. 2016;32(6):720–722. doi: 10.1016/j.nut.2016.01.003.
- Petrova MI, Reid G, Vaneechoutte M, et al. Lactobacillus iners: friend or foe? Trends Microbiol. 2017;25(3):182–191. doi: 10.1016/j.tim.2016.11.007.
- Parker BJ, Wearsch PA, Veloo ACM, et al. The genus alistipes: gut bacteria with emerging implications to inflammation, cancer, and mental health. Front Immunol. 2020;11:906. doi: 10.3389/fimmu.2020.00906.
- Toprak NU, Duman N, Sacak B, et al. Alloprevotella rava isolated from a mixed infection of an elderly patient with chronic mandibular osteomyelitis mimicking oral squamous cell carcinoma. New Microbes New Infect. 2021;42:100880. doi: 10.1016/j.nmni.2021.100880.
- Li J, Wen Q, Gu F, et al. Non-antibiotic strategies for prevention and treatment of internalized Staphylococcus aureus. Front Microbiol. 2022;13:974984. doi: 10.3389/fmicb.2022.974984.
- Miyazawa E, Iwabuchi A, Yoshida T. Phytate breakdown and apparent absorption of phosphorus, calcium and magnesium in germfree and conventionalized rats. Nutr Res. 1996;16(4):603–613. doi: 10.1016/0271-5317(96)00038-3.