
Abstract
In this work, we studied the physiological, biochemical and molecular mechanisms underlying the response to polyethylene glycol (PEG) in a drought-resistant variety ‘HZYTJ’ and the sensitive variety ‘WZWJD’ of common beans. The two bean varieties were subjected to a 10% PEG simulated drought stress treatment, and the resultant physiological and biochemical characteristics of the leaves and roots were compared. The superoxide dismutase (SOD), peroxidase (POD), catalase (CAT) and other indicators were higher in ‘HZYTJ’ than in ‘WZWJD’; additionally, the ‘HZYTJ’ exhibited slower changes in response to stress. The proline content in ‘HZYTJ’ changed slowly compared to that in ‘WZWJD’. The transcriptome analysis of the two varieties showed that 1,361 and 1,447 genes were differentially expressed in ‘HZYTJ’ and ‘WZWJD’, respectively. DEGs were also analyzed via the KEGG pathway database, and 10 significant metabolic pathways were found to be involved in ‘HZYTJ’, while nine were found in ‘WZWJD’. Using the GO function database, we found that 111 significant GO terms were involved in ‘HZYTJ’, whereas 125 were involved in ‘WZWJD’. Through analysis of transcription factors, 487 DEGs were identified, of which bHLH transcription factors were the most abundant, followed by ERF, MYB-related, B3 and other transcription factor families. The selected and screened genes with DEGs were validated by qRT–PCR. These results provide a basis for further research into the drought resistance of the common bean.
Introduction
The common bean (Phaseolus vulgaris L.) belongs to Leguminosae, Papilionoideae, and Phaseolus [Citation1]. The environmental conditions necessary for the successful cultivation of the common bean are complex; specifically, its cultivation is easily impacted by a variety of biotic and abiotic factors, and the impact of drought is particularly serious. Drought can directly affect the emergence rate of common beans and the growth of seedlings, thereby affecting the yield of common beans. Within the context of anthropogenic climate change, drought spells have become more severe in some common-bean-producing areas [Citation2]. The intrinsic responses of the common bean to drought have shown that the magnitude of drought resistance varies depending on the intensity of the drought at hand. Thus, drought resistance has garnered the attention of many researchers across the globe, and a series of studies have been conducted in common bean, to name a few [Citation3–7].
The common bean has acquired a complex set of physiological mechanisms linked to stress resistance. The acquisition of such capabilities can be attributed to the complex environment in which the common bean grows. During periods of drought, plants exhibit physiological and biochemical adaptive responses, such as a decline in the photosynthetic rate, the accumulation of ABA and osmotic adjustment substances, and the operation of antioxidant systems; overall, these changes help the plant to effectively cope with the drought stress [Citation5, Citation8]. Many studies have pointed to the uniqueness of the adaptive responses of the common bean (i.e. and its varieties) under drought stress [Citation6–12].
Transcriptome sequencing (RNA-seq) is a high-throughput sequencing technology that detects the gene transcription of an organism under specific environmental conditions. Currently, RNA-seq technology is widely used not only in plants but also in the mining of plant drought resistance genes. Transcriptome sequencing was used to compare and analyze the gene expression levels in many plant species under drought stress to identify drought resistance genes [Citation13–16].
In this study, we performed RNA-seq on the two common bean varieties in three different states under PEG-simulated drought stress. Using high-throughput sequencing combined with bioinformatic analyses, we studied the differences among the two varieties at the transcriptional level. By determining and analyzing the physiological responses of the leaves and roots of two common bean varieties with different drough tolerance, this study will provide a theoretical basis for improving the quality and yield of common beans.
Materials and methods
Common bean varieties
The varieties of the common bean used in this study were the ‘Hong zi ya ta jia’ (‘HZYTJ’) and the ‘Wang zhong wang jia dou’ (‘WZWJD’) [Citation17]. The ‘HZYTJ’ is a variety with relatively strong drought resistance. This variety is characterized by high yield potential and strong disease resistance. The ‘WZWJD’ variety has relatively weak drought resistance. The characteristic is that it is an early maturing variety with relatively low yield. The study was conducted in the artificial climate room of the intelligent multispan greenhouse of Shanxi Agricultural University, Taigu County, Shanxi Province (altitude 790 m, longitude 112°37’26", latitude 37°29’17").
Treatment
The seeds (i.e. with full grains, 100 seeds) of the two common bean varieties were selected and soaked in warm water. Once the true leaves of the common bean varieties were fully expanded, six seedlings for each treatment were removed and planted in 35-L plastic dark water tanks with 1/2 Hoagland solution [Citation18, Citation19]. Hydroponic seedlings were treated with 10% PEG-6000 for 6 h to simulate drought stress, with three biological replicates (Supplemental Figure S1). Samples (leaves and roots) were then collected at three time points, specifically, when untreated (0 h), when wilting after treatment (6 h after treatment), and after transfer to 1/2 Hoagland solution rehydration treatment (12 h after transfer) to determine if the stress would be reflected in various physiological indicators (superoxide dismutase (SOD), peroxidase (POD) and catalase (CAT) activity and malondialdehyde (MDA) content). Three biological replicates were run for each physiological indicator.
Sample preparation
The samples were homogenized in liquid nitrogen using a precooled mortar and pestle at 4 °C. The homogenized samples in PBS (pH 6.0) were then centrifuged it at 4,000 g for 15 min. The homogenate was filtered through two layers of filter paper. The supernatant was immediately used for enzyme activity analysis.
Measurement of physiological indicators
The antioxidant SOD, POD and CAT enzyme activities were determined according to the methods described [Citation20–22]. The main reagents for enzyme activities determination were purchased from the Solarbio Company (Beijing, China). We quantified MDA content by the thiobarbituric acid assay with slight modifications [Citation23]. In brief, we ground about 500 mg of sample in liquid nitrogen and homogenized it in 0.1% (w/v) trichloroacetic acid (TCA) solution (0.5 mL). For the reaction mixture, 1 mL supernatant was added to 20% TCA (2 mL) containing 0.6% thiobarbituric acid (TBA) in a clean glass tube. We cooled it immediately thereafter, then centrifuged it at 3,000 g for 10 min at 4 °C. We measured the absorbance of the clarified supernatant at 600, 532 and 450 nm. The soluble protein content in leaves and roots was determined by Coomassie brilliant blue [Citation24]. The samples (leaves and roots) (0.1 g) were ground into a homogenate using 5 mL of 50 mmol L−1 phosphate buffer (pH 7.8). The supernatant (0.1 mL) was transferred to a test tube and 4 mL Coomassie brilliant blue (0.01%) and 1 mL distilled water were added. After standing for 3 min, absorbance was read at 595 nm in a UV spectrophotometer. The soluble sugar content was determined by anthrone colorimetry [Citation25]. The reaction mixture containing 1 mL supernatant and 5 mL anthrone (100 mg anthrone + 100 mL 80% H2SO4) was heated at 100◦C for 10 min, and then absorbance was read at 620 nm. The proline content was determined according to the method described by Bates et al. [Citation26]. In brief, fresh leaves or roots (0.5 g) were ground with 5 mL of 3% sulfosalicylic acid. The extract was filtered and acid ninhydrin solution (2 mL) was added to the filtrate. The absorbance of the solution was read at 520 nm. The content was determined using a proline standard curve.
RNA extraction
Samples from the seedling leaves representing the drought stress of ‘HZYTJ’, namely, 0 h (CK1), 6 h (T1) and 12 h (T3); and those representing the drought stress of ‘WZWJD’, namely, 0 h (CK2), 6 h (T2) and 12 h (T4) were immediately frozen in liquid nitrogen and stored at −80 °C. Plant RNA extraction kit (Tiangen Company, Beijing, China) was used to extract total RNA from the leaves of the two common bean varieties.
RNA library construction and sequencing methods
The concentration, purity and integrity of the extracted RNA were then determined by a spectrophotometer and an Agilent 2100 bioanalyzer (Agilent, Santa Clara, CA, USA) before freeze storage. The mRNA-seq library was constructed using the Illumina’s TruSeq RNA Sample Preparation Kit (Illumina, San Diego, CA, USA). A total amount of 1 μg RNA per sample was used to prepare the library with insert sizes of 350 bp and sequenced on a NovaSeq 6000 (Illumina, San Diego, CA, USA). The samples were sequenced on NovaSeq 6000 at Bioeditas Technology Corporation (Shaanxi, China). The original image files were converted into raw data, and then the raw reads obtained through sequencing were filtered to remove the following reads: reads with connector contamination and reads with an N content greater than 5%. Overall, these steps were taken to obtain high-quality reads that would be subsequently spliced. The transcript sequence obtained through splicing was classified and characterized according to different genome annotation information. HISAT2 tools were used to map the reference genome (ftp://ftp.ncbi.nlm.nih.gov/genomes/all/GCF/000/499/845/GCF_000499845.1_PhaVulg1_0/GCF_000499845.1_PhaVulg1_0_genomic.gff.gz).
Differentially expressed gene (DEG) analysis
To identify the differentially expressed genes (DEGs) between the compared samples, FDR <0.001 and |log2Ratio|≥2 found by DESeq was set as the threshold for significant differential expression, at a p value <0.05 [Citation27, Citation28]. Differential expression analysis of the two cultivars was performed using the DEGseq R package. These genes were then analysed using two major databases, namely, Gene Ontology (GO) enrichment significance analysis and Kyoto Encyclopedia of Genes and Genomes (KEGG) metabolic pathway database (http://www.genome.jp/kegg/) [Citation29, Citation30]. Finally, the differential genes were enriched and analyzed. The GOseq R packages and KOBAS software were used to test the statistical enrichment of DEGs [Citation31].
Gene validation and expression analysis by qRT–PCR
Quantitative real-time reverse transcription PCR (qRT–PCR) was performed to confirm the results of the DEG analysis. A Hiscript II Q RT SuperMix (Vazyme Company, Nanjing, China) was used for qPCR reverse transcription for total RNA reverse transcription to obtain cDNA as a template. The primers designed by Primer Premier 5 used were as shown in Supplemental Table S1. The qRT-PCR was performed on the Roche Light Cycler® 480 system (Roche Diagnostics, CA, USA). The nine genes selected were tested for functional verification, primers were designed using Primers software, the Actin gene was used as the internal reference gene, and the 2 × SYBR® Green dye method was used for qRT-PCR analysis [Citation32]. The qRT–PCR reactions were repeated three times. The 2-ΔΔCT method was finally used to calculate the relative expression of genes.
Data analysis
We performed statistical analyses by one-way analysis of variance (ANOVA) in SPSS (version 25.0) with Duncan’s test. The different letters indicate significant differences at p< 0.05 (Student’s t-test).
Results
Effect of PEG-simulated drought stress and rehydration on the activity of common bean antioxidant enzymes
As shown in , the SOD activity (U·mg−1 FW (fresh weight) in the leaves and roots of the two common bean varieties during the 10% PEG simulated drought stress treatment and rehydration first declined and then increased as the treatment progressed. Additionally, the change in the SOD activity of the common bean leaf was greater than that of the root. Specifically, the SOD activity in the leaves of ‘HZYTJ’ decreased by 43.72% 6 h into the treatment, to 2.69 U·mg−1, and increased 12 h into the treatment to 4.84 U·mg−1. The SOD activity after 6 h of treatment was significantly lower than that at 0 h and 12 h (p < 0.05). The SOD activity in the leaves of ‘WZWJD’ was lower than that in the leaves of ‘HZYTJ’. After 6 h, the SOD activity in the leaves of ‘WZWJD’ decreased by 49.47%, to 2.39 U·mg−1, and after 12 h, it increased to 4.66 U·mg−1. The SOD activity at 6 h was significantly lower than that at 0 h and 12 h (p < 0.05).
Figure 1. Changes in SOD (A), POD (B) and CAT (C) activity (U·mg−1 fresh weight) in leaves and roots of common bean varieties ‘WZWJD’ and ‘HZYTJ’ during 10% PEG-simulated drought stress and rewatering. Samples (leaves and roots) were collected at three time points, specifically, when untreated (0 h), when wilting after treatment (6 h after treatment), and after transfer to 1/2 Hoagland solution rehydration treatment (12 h after transfer). Error bars are standard errors of the mean from three biological replicates. The different letters indicate significant differences at p < 0.05 (student’s t-test).
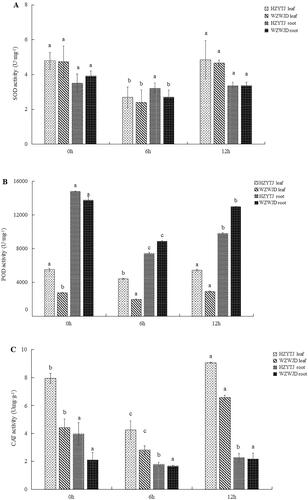
The SOD activity in the roots of ‘HZYTJ’ fluctuated but, there was no significant difference across the three treatment times. The SOD activity in the roots of ‘WZWJD’ decreased by 31.12% at 6 h, to 2.70 U·mg−1, and rose to 3.36 U·mg−1 at 12 h. The SOD activity at 6 h was significantly lower than that at 0 h and 12 h (p < 0.05).
As shown in , as the treatment progressed, the POD activity in common bean leaves and roots first decreased and then increased; specifically, the POD activity in common bean leaves was significantly lower than that in roots. The change in the POD activity in the leaves was slower than that observed in the roots. In the leaves, the POD activity of ‘HZYTJ’ at 6 h was significantly lower than the POD activity at 0 h and 12 h. At 6 h, the POD activity of ‘HZYTJ’ was reduced by 19.90%, to 4,400 U·mg−1, and at 12 h, the POD activity increased to 5,427 U·mg−1. The POD activity in the ‘WZWJD’ leaves was significantly different across the three treatment times. The POD activity at 12 h was the highest, at 2,920 U·mg−1, which was significantly higher than the POD activity at 0 h and the POD at 6 h (p < 0.05). The lowest POD activity in the ‘WZWJD’ leaves at 6 h was 1,970 U·mg−1.
In the roots, there were significant differences in the POD activity of the two varieties at the three time points. The POD activity at 0 h was significantly higher than that at 12 h and 6 h, and the POD activity at 12 h was significantly higher than that at 6 h. The POD activity of ‘HZYTJ’ was 14,800 U·mg−1 at 0 h, and the 12 h POD activity increased by 24.21% compared to the 6 h POD activity. The POD activity of the ‘WZWJD’ root at 0 h was 13,753 U·mg−1, and at 12 h it increased by 31.57% compared with the POD activity at 6 h (p < 0.05).
As shown in , the CAT activity in the common bean leaves was higher than that in roots. In the leaves, the CAT activities of the two common bean varieties across the three treatment times were significantly different from each other. The CAT activity of ‘HZYTJ’ at 6 h was 4.24 Umg·g−1, which was 46.53% lower than the CAT activity at 0 h, which increased to 9.05 Umg·g−1 at 12 h. The CAT activity of ‘WZWJD’ at 6 h was 2.80 Umg·g−1, which was 36.51% lower than the CAT activity at 0 h, which increased to 6.57 Umg·g−1 at 12 h (p < 0.05).
In the roots, there were significant differences in CAT activity across the three time points of ‘HZYTJ’. The CAT activity at 0 h (i.e. 3.96 Umg·g−1) was significantly higher than the CAT activity at 6 h and 12 h (p < 0.05); the minimum CAT activity at 6 h was 1.78 Umg·g−1. There was no significant difference in the CAT activity of ‘WZWJD’ across the three time points; the highest CAT activity at 12 h was 2.17 Umg·g−1, and the lowest at 6 h was 1.67 Umg·g−1 (p > 0.05).
PEG simulated drought stress and the effect of rehydration on osmotic regulators of common bean
As shown in , the soluble protein content in common bean leaves was significantly higher than that of the roots (p > 0.05). Additionally, in the leaves, the soluble protein content of ‘HZYTJ’ was significantly different across the three time points. As the treatment progressed, the soluble protein content gradually increased; the content at 12 h was 0.30 mg·g−1, and the minimum value at 0 h was 0.24 mg·g−1. There was no significant difference in the soluble protein content in the leaves of ‘WZWJD’ at 0 h and 12 h, and at 6 h the content was the lowest at 0.16 mg·g−1.
Figure 2. Changes in soluble protein (A) and sugar (B) in leaves and roots of common bean varieties ‘WZWJD’ and ‘HZYTJ’ during 10% PEG-simulated drought stress and rewatering. Samples (leaves and roots) were collected at three time points, specifically, when untreated (0 h), when wilting after treatment (6 h after treatment), and after transfer to 1/2 Hoagland solution rehydration treatment (12 h after transfer). Error bars are standard errors of the mean from three biological replicates. The different letters indicate significant differences at p < 0.05 (student’s t-test).
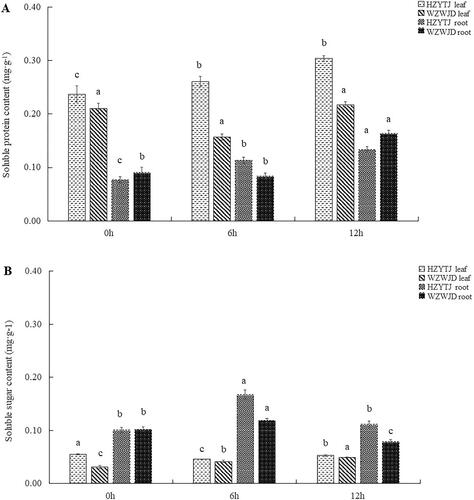
In the roots, there were significant differences in the soluble protein content of ‘HZYTJ’; the highest content at 12 h was 0.13 mg·g−1, and the lowest content at 0 h was 0.08 mg·g−1. There was no significant difference in the soluble protein content in the roots of ‘WZWJD’ at 0 h and 6 h (p > 0.05), and it reached its highest at 12 h, which was 0.16 mg·g−1.
As shown in , the soluble sugar content in common bean leaves was significantly lower than that of the roots. In the leaves, the soluble sugar content of the two common bean varieties was significantly different. The soluble sugar content in ‘HZYTJ’ was 0.055 mg·g−1 at 0 h, and the minimum was 0.045 mg·g−1 at 6 h. The content of soluble sugar in the ‘WZWJD’ leaves was different from that of ‘HZYTJ’. The soluble sugar content in ‘WZWJD’ leaves at 12 h (0.049 mg·g−1) was significantly higher than that at 6 h (0.033 mg·g−1) and 0 h (0.031 mg·g−1).
In ‘HZYTJ’ roots, there was a significant difference in the soluble sugar content. The content at 6 h (0.167 mg·g−1) was significantly higher than the content at 0 h and 12 h (p < 0.05), and there was non-significant difference between the content of soluble sugar at 0 h and 12 h (p > 0.05). There were significant differences in the soluble sugar content in ‘WZWJD’ across the three time points. The highest soluble sugar content was 0.119 mg·g−1 at 6 h, and the lowest was 0.078 mg·g−1 at 12 h.
As shown in , the proline content in common bean leaves was significantly higher than that in roots. In the leaves of ‘HZYTJ’, the proline content at 6 h (0.0052 mg·g−1) was significantly higher than the proline content at 0 h and 12 h (p < 0.05), and the proline content at 0 h was significantly lower than that at 12 h (p < 0.05). The proline content in ‘HZYTJ’ leaves at 0 h was 0.0019 mg·g−1. The proline content of ‘WZWJD’ at 6 h (0.0045 mg·g−1) was significantly higher than that at 0 h and 12 h. There was no significant difference in the proline content between 0 h and 12 h in the leaves.
Figure 3. Changes in the proline contents (mg·g−1 fresh weight) (A) and MDA contents (Nmol·mg−1 fresh weight) (B) in leaves and roots of common bean varieties ‘WZWJD’ and ‘HZYTJ’ during 10% PEG-simulated drought stress and rewatering. Samples (leaves and roots) were collected at three time points, specifically, when untreated (0 h), when wilting after treatment (6 h after treatment), and after transfer to 1/2 Hoagland solution rehydration treatment (12 h after transfer). Error bars are standard errors of the mean from three biological replicates. The different letters indicate significant differences at p < 0.05 (student’s t-test).
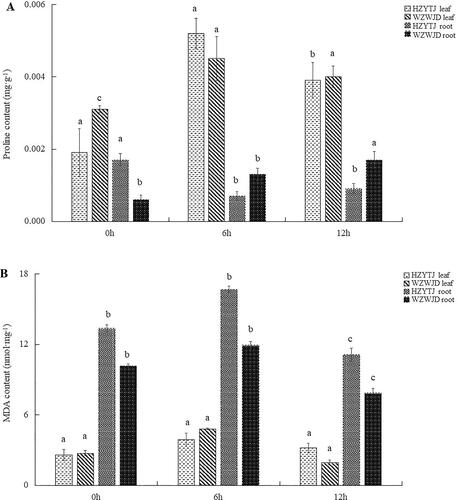
In the roots of ‘HZYTJ’, the proline content at 0 h was significantly higher that at 6 h and 12 h and was 0.0017 mg·g−1. There was no significant difference between the proline content at 6 h and 12 h. The proline content in the roots of ‘WZWJD’ at 12 h (0.00168 mg·g−1) was significantly higher than that at 0 h and 6 h, and the proline content at 0 h (0.0006 mg·g−1) was significantly lower than that at 6 h (0.00114 mg·g−1).
The effect of PEG-simulated drought stress and rehydration on the malondialdehyde content of common bean
As shown in , under 10% PEG-simulated drought stress, the MDA content of roots was significantly higher than that of leaves. In the leaves, the MDA content of ‘HZYTJ’ was significantly different at 0 h and 6 h. The MDA content at 6 h was 3.87 nmol·mg−1 fresh weight, and the minimum content at 0 h was 2.58 nmol·mg−1. The MDA content of ‘WZWJD’ was significantly different among the three time points. The MDA content at 6 h was the highest at 4.79 nmol·mg−1, and the MDA content at 12 h was the lowest at 1.91 nmol·mg−1 (p < 0.05).
In the roots, the MDA content of ‘HZYTJ’ at 6 h was significantly higher than the MDA content at 0 h and 12 h, which was 11.10 nmol·mg−1, and the MDA content at 0 h (13.35 nmol·mg−1) was significantly lower than that at 6 h and 12 h (p < 0.05). The MDA content of ‘WZWJD’ at 6 h was significantly higher than that at 0 h and 12 h, which was 11.91 nmol·mg−1, and the MDA content at 12 h was significantly lower than that at 0 h and 6 h, which was 7.84 nmol·mg−1 (p < 0.05).
Transcriptome analysis of common bean under drought stress
Data quality assessment and comparison analysis
The RNA library was constructed using three sampling time points from each of the two varieties (‘HZYTJ’ and ‘WZWJD‘). For transcriptome sequencing, the raw reads produced by each library were filtered. We found that the proportion of clean reads of the six samples was higher than 89%, which will allow for a follow-up assembly. The Q30 values of the samples were all greater than 94%. The above-mentioned results show that the sequencing accuracy was high, which means the sequences can be used for subsequent analyses.
Sample correlation analysis and cluster analysis
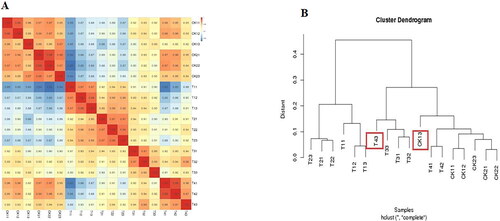
Correlation and cluster pattern analyses were performed on 18 samples after three repetitions of six samples. As shown in , samples CK13 and T43 were abnormal in their clustering. Therefore, to improve the accuracy of the results, this study removed samples CK13 and T43 prior to the samples being processed for subsequent analysis.
Figure 4. Correlation of RNA-seq data among different samples of common bean varieties ‘WZWJD’ and ‘HZYTJ’. Heatmap (A) of correlation coefficient values across samples based on RNA-seq FPKM. Cluster tree (B) based on the distances of expressed genes. CK11, CK12 and CK13 are the three biological replicates of ‘HZYTJ’ sampled at 0 h; T11, T12 and T13 at 6 h; T31, T32 and T33 at 12 h. CK21, CK22 and CK23 are the three biological replicates of ‘WZWJD’ sampled at 0 h; T21, T22 and T23 at 6 h; T41, T42 and T43 at 12 h. Samples (leaves and roots) were collected at three time points, specifically, when untreated (0 h), when wilting after treatment (6 h after treatment), and after transfer to 1/2 Hoagland solution rehydration treatment (12 h after transfer).
Differentially expressed gene (DEG) analysis
In this experiment, 24,241 genes in 16 samples were clearly annotated or speculatively analysed. After screening and analysis, 1,361 differentially expressed genes were obtained from ‘HZYTJ’ after PEG stress, of which 726 were upregulated genes and 635 were downregulated genes. In ‘WZWJD’, 1,447 differentially expressed genes were obtained, and among them, 506 and 941 genes were upregulated and downregulated, respectively. Overall, 545 genes were shared by the two varieties.
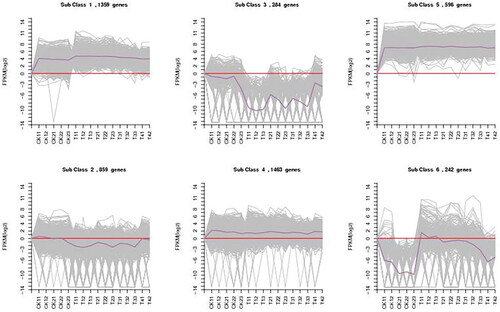
Functionally related genes usually have similar expression patterns under the same conditions, as shown in . Through hierarchical cluster analysis of the differentially expressed genes of two bean varieties at different times, a heatmap of the differential expression of the two varieties was generated. According to the expression level of the differentially expressed genes in each sample, we took the logarithm to the base of 2 and then used K-means clustering to determine the clustering of the genes. The differential genes were classified into six different clusters according to their expression patterns (). Based on the results, class 2, class 3 and class 6 were analysed further. After the DEG analyses of the two common bean varieties, 599 DEGs between ‘HZYTJ’ with PEG and without PEG and 544 DEGs between ‘WZWJD’ with PEG and without PEG, respectively.
Figure 5. Heatmap analysis of DEGs. DEGs analysis of the ‘HZYTJ’ transcriptome (A) and ‘WZWJD’ transcriptome (B). The DEGs gene expression level is shown by the logarithmic normalized RNA-seq FPKM value.
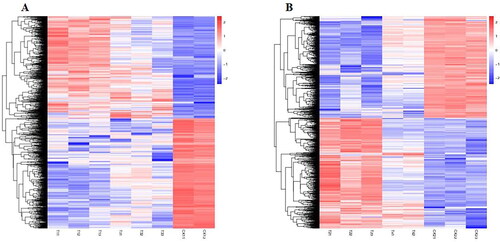
Figure 6. Six clusters of coexpressed genes and the K-means clustering pattern analysis of the DEGs. The gene expression level is shown by the logarithmic normalized RNA-seq FPKM value. The grey lines in the figure show the expression patterns of genes in each cluster, and the dark purple line represents the average expression of all genes in the cluster in the sample.
DEGs functional annotation
The selected DEGs were compared with the databases (GO and KEGG), and the functions of unknown genes were inferred according to genes whose functions are known (i.e. genes in the database). The GO (Gene Ontology) database divides the function of genes into three categories, namely, biological process, molecular function, and cellular component. GO functional analysis was performed on the two common bean varieties in this study, and the results are shown in Supplemental Figure S2. The annotated genes of ‘HZYTJ’ (T13-C1) and ‘WZWJD’ (T24-C2) were subdivided into 51 and 49 GO functional classes, respectively. We found that the two common bean varieties had most of their DEGs involved in biological processes.
According to the calculation of the number of DEGs annotated into each GO entry, the hypergeometric test method was used to find the GO entries that were significantly enriched with DEGs. In ‘HZYTJ’, 111 significant GO classification terms were involved; among them, there were 67 metabolic pathways in the biological processes category, accounting for 60.36% of the significant GO classification terms, and a total of 4,891 DEGs; the cell components category had 34 metabolic pathways, accounting for 30.63% of the significant GO classification terms, and a total of 3,834 DEGs; and the molecular functions category had 10 metabolic pathways, accounting for 9.01% of the significant GO classification terms, and a total of 1,431 DEGs. In the biological processes category, there were many different genes linked to responses to abiotic stimuli, oxalate metabolism, signal transduction, response to chemical substances and oxygenated compounds. In the cell components category, there were many different genes, such as those linked to membrane components, membrane inherent components, extracellular regions, and plasma membrane components. In the molecular functions category, there were genes linked to oxidoreductase activity, DNA binding transcription factor activity, transcription regulation activity, transmembrane transport protein activity and transportation activity.
In ‘WZWJD’, a total of 125 significant GO classification terms were involved, of which there were 61 metabolic pathways in biological processes, accounting for 48.8% of the significant GO classification terms, and a total of 2,836 DEGs; there were 52 metabolic pathways in cell components, accounting for 41.6% of the significant GO classification terms, and a total of 8,031 DEGs; and molecular functions had 12 metabolic pathways, accounting for 9.6% of the significant GO classification terms, and a total of 2,025 DEGs. In the biological processes category, there were many different genes linked to responses to non-biological stimuli, small molecule catabolism, oxalic acid metabolism, organic acid metabolism, and carboxylic acid metabolism. In the cell components category, there were many DEGs, such as those linked to biofilm, membrane components, membrane inherent components, membrane components, and cytoplasmic parts. In the molecular functions category, there were many different genes associated with calcium ion binding, catalytic activity, oxidoreductase activity, chlorophyll binding and tetrapyrrole conjugates.
Using the hypergeometric test method, the path with q ≤ 0.05 was defined as the path of significant enrichment in differentially expressed genes, and significant enrichment analysis of metabolic pathways was performed on the two samples under PEG stress for significantly differentially expressed genes ( and ). Ten significant metabolic pathways were found in ‘HZYTJ’, namely, plant hormone signal transduction, MAPK signalling pathway in plants, peroxisomes, fatty acid metabolism, valine, leucine acid and isoleucine degradation, keratin, amber and wax biosynthesis, glyoxylic acid and dicarboxylic acid metabolism, fatty acid degradation, photosynthesis-antenna protein, and α-linolenic acid metabolism. There were 215 genes in these pathways. Among them, there were 70 differentially expressed genes in the plant hormone signal transduction pathway.
Table 1. Analysis of the main metabolic pathways of ‘HZYTJ’ under drought stress. The expression difference multiple log2 (fold change) ≥ 2, false discovery rate (FDR) <0.01, and p value <0.05 were used as screening criteria, and the DEGs genes were selected.
Table 2. Analysis of the main metabolic pathways of ‘WZWJD’ under drought stress. The expression difference multiple log2 (fold change) ≥ 2, false discovery rate (FDR) <0.01, and p value <0.05 were used as screening criteria, and the DEGs genes were selected.
There were nine significant metabolic pathways in ‘WZWJD’, namely, plant pathogen interaction, carbon metabolism, glyoxylic acid and dicarboxylic acid metabolism, porphyrin and chlorophyll metabolism, photosynthesis, photosynthesis-antenna biosynthesis of protein and carotenoids, carbon fixation in photosynthetic organisms and biosynthesis of isoquinoline alkaloids. There were 185 genes in these pathways, most of which were linked to plant pathogens (i.e. 43) and carbon metabolism (i.e. 39). Both varieties exhibited metabolic pathways linked to glyoxylic acid and dicarboxylic acid and photosynthesis-antenna protein pathways.
Transcription factor analysis
In the analysis of transcription factors, 58 transcription factor families were identified. Among them, 487 differentially expressed genes were involved. Furthermore, bHLH transcription factors were the greatest (i.e. 35), followed by ERF, MYB-related, B3 and C2H2. Among other transcription factor families, there were more than 20 differentially expressed genes. The top 18 transcription factor families had more than 10 differentially expressed genes. There were nine transcription factor families with only one DEG. The detailed results are shown in Supplemental Table S2.
Gene validation and expression analysis by qRT–PCR
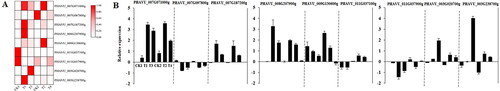
Nine genes exhibiting significant differential expression were selected and screened by qRT–PCR. The nine genes are XM_007143360.1 (PHAVU_007G071000g), EIXI-2 (XM_007143566.1) (PHAVU_007G087800g), CALM (XM_007144763.1) (PHAVU_007G187200g), frmA, ADH5, adhC (XM_007141519.1) (PHAVU_008G207900g), CML (XM_007137421.1) (PHAVU_009G130600g), SAUR (XM_007131669.1) (PHAVU_011G037100g), SAUR (XM_007131677.1) (PHAVU_011G037900g), PXG (XM_007153204.1) (PHAVU_003G0207000g) and GH3 (XM_007155808.1) (PHAVU_003G238700g). The remaining eight genes (except for XM_007143360.1) can be annotated in KEGG, and nine genes can be annotated in the GO function database. Six of these nine genes encode transcription factors. The specific results are shown in .
Table 3. The KEGG enrichment of DEGs for qRT–PCR validation. The expression difference multiple log2 (foldchange) ≥ 2, false discovery rate (FDR) <0.01, and p value <0.05 were used as screening criteria.
After comparing the results of qRT–PCR and RNA-seq, we found that the expression levels of these nine genes were different, but the overall expression trends of the genes were largely the same, which is indicative of the biological meaningfulness of the transcriptome sequencing results across the two common bean varieties ().
Figure 7. Relative expression levels of DEGs by RNA-seq (A) and qRT–PCR (B).
Discussion
Relationship between antioxidant enzyme activity and drought resistance in common soybean
As a global issue that is increasing in severity and frequency within the context of climate change, drought is worthy of in-depth study, especially in the context of agriculture. The drought resistance of common bean has a long evolutionary history in most areas where it occurs [Citation33, Citation34]. Plant growth and development are slowed down under drought stress [Citation35]; additionally, the intrinsic antioxidant defense system will be activated, increasing antioxidant enzyme activity, thereby reducing damage to the plant [Citation36–38]. In this study, we showed that the SOD and POD activities of common bean decreased under drought stress and then increased after rewatering; these findings are inconsistent with those of Wang et al. [Citation39]. This study showed that the SOD activity in the roots was lower than that in the leaves and that the SOD activity in the roots changed more slowly with increasing treatment time than that of leaves, but the POD activity of roots was much greater than that of leaves. In this study, CAT activity first decreased and then increased, this result is in agreement with a previous report [Citation40]. In this study, the soluble protein, soluble sugar and proline contents in common bean leaves and roots under PEG stress increased, consistent with a previous study [Citation41]. In this study, the soluble protein and proline contents in the leaves were significantly higher than that of roots, but the soluble sugar content in the leaves was significantly lower than in the roots. Under drought stress, the MDA content of common bean plants increased, similar to a previous observation [Citation42], and the MDA content in leaves was significantly lower than that of roots.
Screening of common bean for drought tolerance by RNA-Seq
With the continuous improvement of analytical techniques within the context of molecular biology, transcriptome sequencing technology will continue being widely used in plant and animal genomics research. In this study, RNA-Seq was performed to analyse the transcriptome of the two common bean varieties under drought stress. Overall, this approach enabled the construction of a transcriptome database of the common bean varieties, ‘HZYTJ’ and ‘WZWJD’, under drought stress. We found 1,361 DEGs in ‘HZYTJ’, of which most were upregulated, and there were 1,447 DEGs in ‘WZWJD’, with most of them being downregulated. The differentially expressed genes were mainly involved in biological metabolism. In the GO function database, the metabolic processes with most DEGs were linked to abiotic stimulus responses and oxalate metabolic processes. This shows that under drought stress, different common bean varieties could have the same metabolic response. There are many different genes involved in the process of signal transduction, reaction to chemical substances and reaction to oxygenated compounds in ‘HZYTJ’, and there are also small molecule catabolism processes in ‘WZWJD’. There are numerous genes involved in organic acid metabolism and carboxylic acid metabolism by GO and KEGG enrichment analysis, which indicates that under drought stress, the more drought-resistant bean variety and the more drought-sensitive bean variety employ different metabolic processes. By analysing the KEGG metabolism pathway, we found 10 significant metabolic pathways in ‘HZYTJ’, involving a total of 215 genes; there were nine significant metabolic pathways in ‘WZWJD’, involving a total of 185 genes. The metabolic pathways shared between the two varieties are photosynthesis-antenna protein, and glyoxylic acid and dicarboxylic acid metabolism pathways. This shows that under drought stress, the metabolism of these two pathways across the two varieties would change. Through an analysis of the factors, we found that bHLH transcription factors were the most abundant, followed by transcription factor families such as ERF, MYB-related, B3 and C2H2. During qRT–PCR, nine genes were randomly selected for verification, and the results of this verification were consistent with those of the transcriptome sequencing results, indicating that the transcriptome sequencing was reliable and therefore yielded biologically meaningful results.
The EIX1-2 (XM_007143566.1) gene is a receptor protein and belongs to the C3H family of transcription factors. It participates in the defence against plant pathogen under drought stress in Arabidopsis [Citation43] and tomato (Solanum lycopersicum) [Citation44–46]. The CALM (XM_007144763.1) gene encodes calmodulin, and it belongs to the HB-other family of transcription factors. This gene participates in the metabolic process of the MAPK signalling pathway in plants. CALM is involved in the antioxidant effect of Cassia leaves [Citation47]. The expression of CALM is upregulated in the immune, detoxification or apoptotic response caused by Cr-induced plant organ damage [Citation48]. A study found that CALM is involved in the Ca2+ signal transduction pathway by studying the resistance response mechanism of Malus halliana seedlings under salt-alkali stress [Citation49]. The frmA, ADH5 and adhC (XM_007141519.1) genes are S-(hydroxymethyl) glutathione dehydrogenase/alcohol dehydrogenase and are involved in carbon metabolism. Searching through the corresponding KO number on the KEGG pathway, we found that many studies have been reported [Citation50, Citation51]. The calcium-binding protein CML (XM_007137421.1) is in a family of transcription factors, FAR1. This protein is involved in plant–pathogen interactions. The CML gene has been studied in many plants. Dopamine can activate the Ca2+ signal transduction pathway by increasing the expression of CNGG and CAM/CML family genes, thereby improving the drought tolerance of apples [Citation52]. Dubrovina et al. [Citation53] cloned 54 CML mRNA transcripts from wild grapes and found that the grapes have significant stress tolerance. Through real-time quantitative RT–PCR, they found that the CML gene family actively responded to abiotic stress. Another study screened the CML gene in the calcium signal pathway by studying the transcriptome expressed during the low temperature-induced dormancy of garlic stems [Citation54]. A study on the defence response of Chinese cabbage to soft rot through transcriptome analysis found that CML is a downstream immune defence gene triggered by the pathogen mode [Citation55].
SAUR (XM_007131669.1) and SAUR (XM_007131677.1) are both SAUR family proteins that belong to the bHLH class of transcription factors. These proteins participate in the metabolic process of plant hormone signal transduction. For example, the SAUR gene was upregulated in response to barley waterlogging [Citation56]. SAUR was also involved in the response of yam tuber expansion [Citation57]. PXG (XM_007153204.1) is a peroxidase that participates in the biosynthesis pathway of cutin, amber and wax. Analysis of the evolution and function of PXG in fungi and other nonplant clades shows that PXG in fungi and plants have similar but different effects [Citation58]. The XM_007143361.1 gene was not annotated in KEGG. It is annotated as an oxalate-CoA ligase in the UniProt database. The GH3 (XM_007155808.1) gene belongs to the auxin-responsive GH3 gene family and is involved in signal transduction. To date, many GH3 families have been identified across different plant species, such as the apple (Malus domestica) [Citation59], maize (Zea mays) [Citation60], citrus (Citrus sinensis) [Citation61], rice (Oryza sativa) [Citation62] and Kiwifruit (Actinidia chinensis) [Citation63].
With the continued improvement of transcriptome technology, the cost of sequencing has gradually decreased; therefore, whole genome sequencing of the common bean has been completed. These advancements have allowed for more in-depth research into the molecular mechanisms underlying the drought resistance of the common bean. This study lays a foundation for the further study of the drought resistance of the common bean.
Conclusions
This study analyzed the physiological responses of two common soybean varieties under PEG treatment. The transcriptome analysis of the two varieties showed that 1,361 and 1,447 genes were differentially expressed in ‘HZYTJ’ (strong drought resistance) and ‘WZWJD’ (weak drought resistance), respectively. The selected and screened genes were validated by qRT–PCR. This study will provide candidate genes for genetic engineering towards drought resistance breeding of common bean.
Authors’ contributions
S.Z. and D.Z. conceived and designed the study with the help of M.L.; S.Z., D.Z., T.L., T.W., G.X. performed the experiments and analyzed the data; S. Z and D.Z. drafted and wrote the manuscript; S. Z, D.Z. and M.L. revised the manuscript. All authors have read and agreed to the published version of the manuscript.
Supplemental Material
Download PDF (231.4 KB)Acknowledgements
We thank Bioeditas Technology Corporation (Shaanxi, China; www.bioeditas.cn) for performing RNA sequencing and providing technical assistance during the data analysis.
Disclosure statement
No potential conflict of interest was reported by the authors. The funders had no role in the design of the study; in the collection, analyses, or interpretation of data; in the writing of the manuscript; or in the decision to publish the results.
Data availability statement
The raw RNA sequencing data to NCBI at (https://www.ncbi.nlm.nih.gov/bioproject/PRJNA946172) under accession numbers (SRX19727897-SRX19727914). All data that support the findings reported in this study are available from the corresponding author Meilan Li upon reasonable request ([email protected] or [email protected]).
Additional information
Funding
References
- Chen J, Zhang X, Jing R, et al. Cloning and genetic diversity analysis of a new P5CS gene from common bean (Phaseolus vulgaris L.). Theor Appl Genet. 2010;120(7):1–16. doi: 10.1007/s00122-010-1263-3.
- Jones PG, Thornton PK. The potential impacts of climate change on maize production in Africa and Latin America in 2055. Global Environ Change. 2003;13(1):51–59. doi: 10.1016/S0959-3780(02)00090-0.
- Cortés A, This D, Chavarro C, et al. Nucleotide diversity patterns at the drought-related DREB2 encoding genes in wild and cultivated common bean (Phaseolus vulgaris L.). Theor Appl Genet. 2012;125(5):1069–1085. doi: 10.1007/s00122-012-1896-5.
- Sadeghipour O. Response of common bean (Phaseolus vulgaris L.) to exogenous application of salicylic acid (SA) under water stress conditions. Adv Environ Biol. 2012;6:1160–1168.
- Wu L, Chang Y, Wang L, et al. The aquaporin gene PvXIP1;2 conferring drought resistance identified by GWAS at seedling stage in common bean. Theor Appl Genet. 2022;135(2):485–500. doi: 10.1007/s00122-021-03978-w.
- Polania JA, Salazar-Chavarría V, Gonzalez-Lemes I, et al. Contrasting Phaseolus crop water use patterns and stomatal dynamics in response to terminal drought. Front Plant Sci. 2022;13:894657. doi: 10.3389/fpls.2022.894657.
- Dong X, Zhu H, Hao X, et al. Genome-wide identification of common bean PvLTP family genes and expression profiling analysis in response to drought stress. Genes. 2022;13(12):2394. doi: 10.3390/genes13122394.
- Shao HB, Chu LY, Jaleel CA, et al. Understanding water deficit stress-induced changes in the basic metabolism of higher plants-biotechnologically and sustainably improving agriculture and the ecoenvironment in arid regions of the globe. Crit Rev Biotechnol. 2009;29(2):131–151. doi: 10.1080/07388550902869792.
- Singh SP. Broadening the genetic base of common bean cultivars. Crop Sci. 2001;41(6):1659–1675. doi: 10.2135/cropsci2001.1659.
- Simsek M, Comlekcioglu N, Ozturk I. The effects of the regulated deficit irrigation on yield and some yield components of common bean (Phaseolus vulgaris L.) under semiarid conditions. African J Biotechnol. 2011;10:4057–4064.
- Lizana C, Wentworth M, Martinez JP, et al. Differential adaptation of two varieties of common bean to abiotic stress I. Effects of drought on yield and photosynthesis. J Exp Bot. 2006;57(3):685–697. doi: 10.1093/jxb/erj062.
- Papathanasiou F, Ninou E, Mylonas I, et al. The evaluation of common bean (Phaseolus vulgaris L.) genotypes under water stress based on physiological and agronomic parameters. Plants. 2022;11(18):2432. doi: 10.3390/plants11182432.
- Davoudi M, Song M, Zhang M, et al. Long-distance control of the scion by the rootstock under drought stress as revealed by transcriptome sequencing and mobile mRNA identification. Hort Res. 2022;9:uhab033.
- Sun M, Huang D, Zhang A, et al. Transcriptome analysis of heat stress and drought stress in pearl millet based on pacbio full-length transcriptome sequencing. BMC Plant Biol. 2020;20(1):323. doi: 10.1186/s12870-020-02530-0.
- Ghodke P, Khandagale K, Thangasamy A, et al. Comparative transcriptome analyses in contrasting onion (Allium cepa L.) genotypes for drought stress. PLoS One. 2020;15(8):e0237457. doi: 10.1371/journal.pone.0237457.
- Zhou R, Yu X, Zhao T, et al. Physiological analysis and transcriptome sequencing reveal the effects of combined cold and drought on tomato leaf. BMC Plant Biol. 2019;19(1):377. doi: 10.1186/s12870-019-1982-9.
- Zhou D, Xing GM, Zheng SW. Screening of drought-resistant varieties of common bean (Phaseolus vulgaris L.). J Shanxi Agricult Sci. 2020;48(1):15–22.
- Yan W, Guohua MI, Amp CF, et al. Genotypic difference in nitrogen efficiency of five maize inbred lines as affected by nitrate levels. Chin J Appl Environ Biol. 2002;8:361–365.
- van Delden SH, Nazarideljou MJ, Marcelis LFM. Nutrient solutions for Arabidopsis thaliana: a study on nutrient solution composition in hydroponics systems. Plant Methods. 2020;16:72. doi: 10.1186/s13007-020-00606-4.
- Giannopolitis CN, Ries SK. Superoxide dismutases: i. Occurrence in higher plants. Plant Physiol. 1977;59(2):309–314. doi: 10.1104/pp.59.2.309.
- Nickel KS, Cunningham B. Improved peroxidase assay method using leuco 2,3′,6-trichloroindophenol and application to comparative measurements of peroxidatic catalysis. Anal Biochem. 1969;27(2):292–299. doi: 10.1016/0003-2697(69)90035-9.
- Aebi H. Catalase in vitro. Metho Enzym. 1984;105:121–126.
- Metwally A, Finkemeier I, Georgi M, Georgi., et al. Salicylic acid alleviates the cadmium toxicity in barley seedlings. Plant Physiol. 2003;132(1):272–281., doi: 10.1104/pp.102.018457.
- Snyder JC, Desborough SL. Rapid estimation of potato tuber total protein content with Coomassie brilliant blue G-250. Theor Appl Genet. 1978;52(3):135–139. doi: 10.1007/BF00264747.
- Buysse JAN, Merckx R. An improved colorimetric method to quantify sugar content of plant tissue. J Exp Bot. 1993;44(10):1627–1629. doi: 10.1093/jxb/44.10.1627.
- Bates LS, Waldren RP, Teare ID. Rapid determination of free proline for stress studies. Plant Soil. 1973;39(1):205–207. doi: 10.1007/BF00018060.
- Li L, Zhang H, Liu Z, et al. Comparative transcriptome sequencing and de novo analysis of Vaccinium corymbosum during fruit and color development. BMC Plant Biol. 2016;16(1):223. doi: 10.1186/s12870-016-0866-5.
- Wang J, Qin Q, Pan J, et al. Transcriptome analysis in roots and leaves of wheat seedlings in response to low-phosphorus stress. Sci Rep. 2019;9(1):19802. doi: 10.1038/s41598-019-56451-6.
- Kanehisa M, Araki M, Goto S, et al. KEGG for linking genomes to life and the environment. Nucleic Acids Res. 2008;36:D480–484. doi: 10.1093/nar/gkm882.
- Mao X, Cai T, Olyarchuk JG, et al. Automated genome annotation and pathway identification using the KEGG orthology (KO) as a controlled vocabulary. Bioinformat. 2005;21(19):3787–3793. doi: 10.1093/bioinformatics/bti430.
- Bu D, Luo H, Huo P, et al. KOBAS-i: intelligent prioritization and exploratory visualization of biological functions for gene enrichment analysis. Nucleic Acids Res. 2021;49(W1):W317–W325. doi: 10.1093/nar/gkab447.
- Shamimuzzaman M, Vodkin L. Identification of soybean seed developmental stage-specific and tissue-specific miRNA targets by degradome sequencing. BMC Genomics. 2012;13:310. doi: 10.1186/1471-2164-13-310.
- Guimares CM, Stone LF, Peloso M, et al. Common bean genotypes under water stress. Revista Brasileira De Engenharia Agrícola E Ambiental. 2011;15:649–656.
- Wu J, Wang L, Li L, et al. De novo assembly of the common bean transcriptome using short reads for the discovery of drought-responsive genes. PLoS One. 2014;9(10):e109262. doi: 10.1371/journal.pone.0109262.
- Rama Reddy N, Ragimasalawada M, Sabbavarapu M, et al. Detection and validation of stay-green QTL in postrainy sorghum involving widely adapted cultivar, M35-1 and a popular stay-green genotype B35. BMC Genomics. 2014;15(1):909. doi: 10.1186/1471-2164-15-909.
- Mir MA, John R, Alyemeni MN, et al. Jasmonic acid ameliorates alkaline stress by improving growth performance, ascorbate glutathione cycle and glyoxylase system in maize seedlings. Sci Rep. 2018;8(1):2831. doi: 10.1038/s41598-018-21097-3.
- Farnese FS, Oliveira JA, Paiva EAS, et al. The involvement of nitric oxide in integration of plant physiological and ultrastructural adjustments in response to arsenic. Front Plant Sci. 2017;8:516. doi: 10.3389/fpls.2017.00516.
- Ma XF, Yu T, Wang LH, et al. Effects of water deficit at seedling stage on maize root development and anatomical structure. Chin J Appl Ecol. 2010;21:1731–1736.
- Wang QM. Effects of drought stress on protective enzymes activities and membrane lipid peroxidation in leaves of soybean seedlings. J Agro-Environ Sci. 2006;25:918–921.
- Khakwani AA, Dennett M, Khan NU, et al. Stomatal and chlorophyll limitations of wheat cultivars subjected to water stress at booting and anthesis stage. Pakistan J Bot. 2013;45:1925–1932.
- Mafakheri A, Siosemardeh A, Bahramnejad B, et al. Effect of drought stress on yield, proline and chlorophyll contents in three chickpea cultivars. Australian J Crop Sci. 2010;4:580–585.
- Cheng C, Yun KY, Ressom HW, et al. An early response regulatory cluster induced by low temperature and hydrogen peroxide in seedlings of chilling-tolerant japonica rice. BMC Genomics. 2007;8(1):1–18. doi: 10.1186/1471-2164-8-175.
- Jehle AK, Lipschis M, Albert M, et al. The receptor-like protein ReMAX of Arabidopsis detects the microbe-associated molecular pattern eMax from Xanthomonas. Plant Cell. 2013;25(6):2330–2340. doi: 10.1105/tpc.113.110833.
- Lorena P, Meirav LM, Silvia S, et al. Tomato prenylated RAB acceptor protein 1 modulates trafficking and degradation of the pattern recognition receptor LeEIX2, affecting the innate immune response. Front Plant Sci. 2018;9:257–272.
- Bar M, Sharfman M, Ron M, et al. BAK1 is required for the attenuation of ethylene-inducing xylanase (EIX)-induced defense responses by the decoy receptor LeEix1. Plant J. 2010;63(5):791–800. doi: 10.1111/j.1365-313X.2010.04282.x.
- Ron M, Avni A. The receptor for the fungal elicitor ethylene-inducing xylanase is a member of a resistance-like gene family in tomato. Plant Cell. 2004;16(6):1604–1615. doi: 10.1105/tpc.022475.
- Kaur S, Kumar A, Thakur S, et al. Antioxidant, antiproliferative and apoptosis-inducing efficacy of fractions from cassia fistula L. leaves. Antioxidants. 2020;9(2):173–181. doi: 10.3390/antiox9020173.
- Wang G, Zhang C, Huang B. Transcriptome analysis and histopathological observations of Geloina erosa gills upon Cr (VI) exposure. Comp Biochem Physiol C Toxicol Pharmacol. 2020;231:108706. doi: 10.1016/j.cbpc.2020.108706.
- Jia X, Zhu Y, Zhang R, et al. Ionomic and metabolomic analyses reveal the resistance response mechanism to saline-alkali stress in Malus halliana seedlings. Plant Physiol Biochem. 2020;147:77–90. doi: 10.1016/j.plaphy.2019.12.001.
- Ras J, Van Ophem PW, Reijnders WN, et al. Isolation, sequencing, and mutagenesis of the gene encoding NAD-and gluthathione dependent. J Bacteriol. 1995;177(1):247–251. doi: 10.1128/jb.177.1.247-251.1995.
- Barber RD, Rott MA, Donohue TJ. Characterization of a glutathione-dependent formaldehyde dehydrogenase from Rhodobacter sphaeroides. J Bacteriol. 1996;178(5):1386–1393. doi: 10.1128/jb.178.5.1386-1393.1996.
- Gao T, Zhang Z, Liu X, et al. Physiological and transcriptome analyses of the effects of exogenous dopamine on drought tolerance in apple. Plant Physiol Biochem. 2020;148:260–272. doi: 10.1016/j.plaphy.2020.01.022.
- Dubrovina AS, Aleynova OA, Ogneva ZV, et al. The effect of abiotic stress conditions on expression of calmodulin (CaM) and Calmodulin-Like (CML) genes in Wild-Growing grapevine Vitis amurensis. Plants. 2019;8(12):602–620. doi: 10.3390/plants8120602.
- Dong Y, Guan M, Wang L, et al. Transcriptome analysis of low-temperature-induced breaking of garlic aerial bulb dormancy. Int J Genomics. 2019;2019:9140572. doi: 10.1155/2019/9140572.
- Liu M, Wu F, Wang S, et al. Comparative transcriptome analysis reveals defense responses against soft rot in Chinese cabbage. Hortic Res. 2019;6:68. doi: 10.1038/s41438-019-0149-z.
- Borrego-Benjumea A, Carter A, Tucker JR, et al. Genome-Wide analysis of gene expression provides new insights into waterlogging responses in barley (Hordeum vulgare L.). Plants. 2020;9(2):240–252. doi: 10.3390/plants9020240.
- Zhou Y, Luo S, Hameed S, et al. Integrated mRNA and miRNA transcriptome analysis reveals a regulatory network for tuber expansion in Chinese yam (Dioscorea opposita). BMC Genomics. 2020;21(1):117–135. doi: 10.1186/s12864-020-6492-5.
- Tran AD, Cho K, Han O. Rice peroxygenase catalyzes lipoxygenase-dependent regiospecific epoxidation of lipid peroxides in the response to abiotic stressors. Bioorg Chem. 2023;131:106285. doi: 10.1016/j.bioorg.2022.106285.
- Zhao D, Wang Y, Feng C, et al. Overexpression of MsGH3.5 inhibits shoot and root development through the auxin and cytokinin pathways in apple plants. Plant J. 2020;103(1):166–183. doi: 10.1111/tpj.14717.
- Feng S, Yue R, Tao S, et al. Genome-wide identification, expression analysis of auxin-responsive GH3 family genes in maize (Zea mays L.) under abiotic stresses. J Integr Plant Biol. 2015;57(9):783–795. doi: 10.1111/jipb.12327.
- Zou X, Long J, Zhao K, et al. Overexpressing GH3.1 and GH3.1L reduces susceptibility to Xanthomonas citri subsp. citri by repressing auxin signaling in citrus (citrus sinensis osbeck). PLoS One. 2019;14(12):e0220017. doi: 10.1371/journal.pone.0220017.
- Hao Du NW, Fu J, Wang S, et al. A GH3 family member, OsGH3-2, modulates auxin and abscisic acid levels and differentially affects drought and cold tolerance in rice. J Exp Bot. 2012;63(18):6467–6480. doi: 10.1093/jxb/ers300.
- Gan Z, Fei L, Shan N, et al. Identification and expression analysis of Gretchen hagen 3 (GH3) in kiwifruit (Actinidia chinensis) during postharvest process. Plants. 2019;8(11):473–486. doi: 10.3390/plants8110473.