
Abstract
In this study, we investigated the potential association between the severity of COVID-19 (coronavirus disease 2019) and nasopharyngeal viral loads or serum antibody levels and evaluate the temporal dynamics of antibodies against SARS-CoV-2 (severe acute respiratory syndrome coronavirus 2). Using ELISA (enzyme-linked immunosorbent assay), we determined the presence of IgA, IgM and IgG antibodies in 450 serum samples from 122 patients for a period of 9 months after disease onset. Viral burden was quantified by RT-PCR (reverse transcription polymerase chain reaction) in 270 nasopharyngeal swab samples from 122 patients for a period of 4 weeks after the onset of the symptoms. Higher antibody values were generally seen in patients with moderate and severe disease compared to patients with mild COVID-19. Significant differences were established in IgA and IgG antibody levels at weeks 3–4 and 5–13 after the disease onset. In all severity groups, seroconversion rates were high and a similar pattern was observed with IgM antibodies quickly decreasing after reaching peak levels and IgA and IgG antibodies persisting at high values up to 9 months. The mean viral loads were higher in the mild group during the first 2 weeks and in the moderate and severe groups later on. However, the differences were not statistically significant. The IgA and IgG antibody response was significantly stronger in patients with moderate/severe disease around the time of peak antibody production as well as in vaccinated patients. No definitive association between viral load levels and the severity of COVID-19 was observed.
Introduction
COVID-19 (coronavirus disease 2019) is a viral respiratory disease, which – by the time of writing – has been responsible for over 670 million infections and 6.8 million deaths worldwide. The causative agent is SARS-CoV-2 (severe acute respiratory syndrome coronavirus 2), a virus from the genus Betacoronavirus that is transmitted via respiratory droplets. Active viral replication in tissues could be indicated by evaluation of the viral load. Viral detection in nasopharyngeal or throat swabs by RT-PCR (reverse transcription polymerase chain reaction) has been one of the mainstays for diagnosis of COVID-19. The duration of viral shedding and the viral load in respiratory samples have been extensively studied in relation to disease severity and immune status with varying results being reported. Prolonged viral shedding has been correlated with more severe disease, older age, organ damage, etc. [Citation1, Citation2]. However, others have not found any significant association with underlying diseases, disease severity, or age [Citation3, Citation4]. There have also been conflicting reports regarding the relationship between viral load and antibody response.
SARS-CoV-2 has four structural proteins: spike (S), envelope (E), membrane (M) and nucleocapsid (N). Antibodies produced against the S and N proteins have been the most extensively studied for their potential protective, diagnostic and epidemiologic role. Results from previous studies have been contradictory, with some reporting an association of higher antibody levels with milder course of disease [Citation5], while others observing the opposite trend, with higher antibodies found in patients with more severe symptoms [Citation6–8]. There are also authors who have not found any conclusive link between disease severity and antibody levels at all [Citation9]. Interpretations of the results, therefore, have also been conflicting: antibodies might be key players for disease resolution or they might have only a limited contribution to the antiviral defence. There have been claims that antibodies might have aggravating effects during infection; Sánchez-Zuno et al. [Citation10] suggested the antibody-dependent enhancement phenomenon as an explanation for a more severe clinical course in case of reinfection. Many factors have to be taken into account when examining the relationship between disease outcome and antibody production including age, sex, underlying illnesses, etc. There have been reports of successful viral clearance with minimal to no contribution from neutralizing antibodies in healthy individuals, suggesting that a solid T-cell response is enough for a more favourable outcome [Citation11]. In addition, a study among patients with agammaglobulinaemia who recovered from COVID-19 infection indicated that even if antibodies have an advantageous role, they are not critical for clearance of infection and suggested that B lymphocytes may play a pathological role in lung inflammation [Citation12].
Another common subject of interest is the temporal dynamics of antibodies in recovered COVID-19 patients. Longitudinal studies have been complicated by instances of re-infections and vaccinations during the observation period as well as by lack of patient compliance. Due to the relative novelty of the disease, reports on the longevity of humoral immunity beyond the first year after disease onset are scarce.
The aim of this study was to determine and analyze the antibody dynamics and viral loads of COVID-19 patients at the time of illness and during the convalescence period. We examined the production of IgA and IgG antibodies against the S1 domain of the spike protein and IgM antibodies against the nucleoprotein of SARS-CoV-2 in order to study the strength and longevity of the humoral immune response in different clinical groups. Nasopharyngeal swab samples were examined by RT-PCR in search of a possible connection between disease severity and viral load.
Subjects and methods
Ethics statement
Ethical approval for this study was obtained from the Institutional Review Board at the National Center of Infectious and Parasitic Diseases (approval number 4/17.02.2021). Written informed consent was obtained from all patients before the study.
Patients
We enrolled 122 COVID-19 patients: 54 with mild, 48 with moderate and 20 with severe illness. Serum and nasopharyngeal swab samples were collected in the period December 2020–December 2021. Samples from 12 patients were included retrospectively (collected in the period December 2020–January 2021). The following inclusion criteria were applied: (1) age over 16 years; (2) positive test for COVID-19, either by rapid antigen test or by PCR. Individuals who were unable to provide informed consent were excluded from the study. Laboratory confirmation of infection was done by detection of viral RNA in nasopharyngeal swab samples using qRT-PCR (quantitative reverse transcription polymerase chain reaction). Clinical classification of disease severity was based on WHO living guidelines from 15 September 2022 [Citation13].
Antibody measurement
IgM antibodies against the N protein of SARS-CoV-2 (EUROIMMUN Medizinische Labordiagnostika AG, Germany, Cat. No. EI 2606-9602-3M), IgA antibodies against the S1 domain of the S protein (EUROIMMUN, Cat. No. EI 2606-9601A) and IgG antibodies against the S1 domain of the S protein (EUROIMMUN, Cat. No. EI 2606-9601G) were tested in serum samples using ELISA (enzyme-linked immunosorbent assay) kits in accordance with the manufacturer’s instructions. As specified by the manufacturer, semi-quantitative test results were calculated as a ratio of the extinction of the patient sample over the extinction of the calibrator. Interpretation of the results was as follows: positive if the ratio ≥1.1, borderline if the ratio ≥0.8 to <1.1 and negative if the ratio <0.8.
Overall, 450 serum samples from 122 patients were obtained and, for better analysis of the dynamics of the antibody response, the sampling time points were grouped into five periods of time: weeks 1, 2, 3–4, 5–13, 14–25, 26–40 after disease onset.
Viral RNA detection
Extraction of SARS-CoV-2 RNA was done from nasopharyngeal swabs using QIAmp Viral Mini Kit (Qiagen, Hilde, Germany, Cat. No. 52906), and viral loads were quantified by quantitative real-time RT-PCR kit (Quanty COVID-19v2, Clonit Srl., Italy, Cat. No. RT-25v2), which uses the N-region (nucleocapsid protein) as a target. The standard curve was built using four RNA standards of known concentration. Results were presented as copies per millilitre.
Overall, 270 nasopharyngeal swab samples were obtained from 122 patients, and the samples were divided into four time points: weeks 1, 2, 3 and 4 after disease onset.
Statistical analysis
Statistical analysis of the data was performed with SPSS 26.0 software by applying independent samples Kruskal–Wallis test. We evaluated the correlations by calculating the Spearman’s rank correlation coefficient. Differences were considered statistically significant at the p < .05 level. Graphs were made with GraphPad Prism 9 software.
Results
In our study, we included 122 COVID-19 patients: 54 with mild, 48 with moderate and 20 with severe illness. We obtained overall 270 nasopharyngeal swab samples (at least one sample from each patient) and divided the samples into four groups according to the sampling time points: week 1 (n = 46), week 2 (n = 46), week 3 (n = 22) and week 4 (n = 21) after onset of symptoms. Serum samples were drawn from each patient and were divided into five groups depending on the sampling time points: week 1 (n = 41), week 2 (n = 41), weeks 3–4 (n = 54), weeks 5–13 (n = 40), weeks 14–25 (n = 25) and weeks 26–40 (n = 24) after onset of disease – overall 450 serum samples. In the severe group after weeks 3–4, there were only two patients who turned up for subsequent follow-ups and no statistical analysis was done on their results. The mean age of the whole population was 49 years (range 17–86), 54 were male and 68 were female, 24 patients were immunized and 98 were unimmunized. Among the vaccinated patients, there were 16 with mild disease, 6 with moderate and 2 with severe illness.
Seroconversion
Forty-six (82%) out of 56 patients who were not initially positive for IgA subsequently seroconverted, and the mean days to seroconversion in these patients were 12.1 days (range 6–27). Fifty-two (52%) out of 100 patients who were not initially positive for IgM subsequently seroconverted, and the mean days to seroconversion in these patients were 11.4 days (range 6–24). Fifty-four (73%) out of 74 patients who were not initially positive for IgG antibodies at the time of first sampling subsequently seroconverted, and the mean days to seroconversion in these patients were 13.8 days (range 6–27). At week 3, all tested patients were seropositive for at least one class of antibodies. There were four patients who dropped out of the study at an earlier stage before achieving seroconversion.
All vaccinated patients were positive for both IgA and IgG antibodies at the time of first sampling, which varied from 1 to 8 days (mean 3.1 days) after disease onset. Only one of them was positive for IgM initially, two patients developed an IgM response afterwards and in the rest we did not detect any IgM production at any time point.
IgM antibodies
Dynamics of IgM antibodies in different severity groups
The mean IgM levels in the mild group were generally lower than those in the moderate and severe groups at all time points. For all severity groups, the mean levels peaked at weeks 3–4, and at weeks 5–13 had fallen to borderline. The mean IgM values continued to decline and were negative at weeks 14–25 and 26–40. There was a statistically significant difference in the mean IgM values only at weeks 3–4 between the mild and the moderate (p = .0036) and the mild and the severe groups (p = .0246). The mean IgM values in the mild, moderate and severe groups are presented in .
Figure 1. IgM values in COVID-19 patients at different time points after disease onset.
(A) Mean IgM values at different time points in mild, moderate and severe illness groups given with standard deviation (±SD). Only statistically significant differences are presented (*p < .05, **p < .005).
(B) Percentages of positive, borderline and negative samples for IgM at different time points overall and in the mild, moderate and severe disease groups.
(C) Mean IgM values at different time points in vaccinated and unvaccinated patients given with standard of deviation (±SD). Statistically significant differences are shown (*p < .05, ***p < .0005; ns = not significant, p > .05).
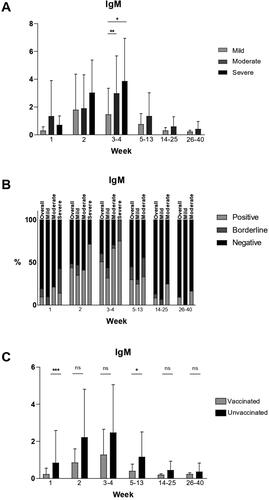
Percentage of seropositivity at different time points overall and in the different severity groups
At week 1, overall less than 10% of all samples tested were positive. The proportion of positive samples increased to 51% at weeks 3–4 and then started decreasing. There were less than 10% positive samples overall at weeks 26–40. In the mild group, there were no positive samples at week 1. At weeks 3–4, the percentage of seropositivity was 32% and at weeks 14–25 and 26–40, there were again no positive samples. In the moderate group, the percentages of positive samples were higher than in the mild group – over 20% at week 0, 67% at weeks 3–4 and 17% at weeks 26–40. In the severe group, only 14% of the patients were positive and 57% were negative at week 1. At weeks 3–4, 75% of the tested patients were positive and 0% were negative. The percentages of positive, borderline and negative samples are presented in .
Comparison between vaccinated and unvaccinated patients
The mean IgM values were lower in vaccinated than in unvaccinated patients at all time points (). Statistically significant differences between the mean values were observed only at week 1 (p = .0007) and at weeks 5–13 (p = .0304).
IgA antibodies
Dynamics of IgA antibodies in different severity groups
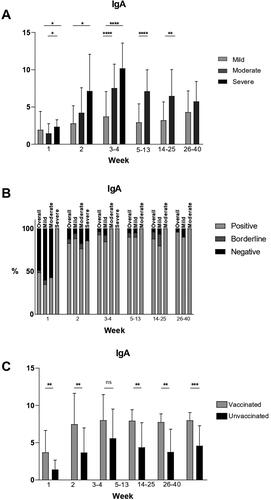
In general, the mean IgA values were higher in the moderate and severe groups compared to the mild group at most time points (). Patients with severe symptoms had significantly higher mean IgA levels during the first three time periods. Peak mean values were observed during weeks 3–4 and were highest in the severe group.
Figure 2. IgA values in COVID-19 patients at different time points after disease onset.
(A) Mean IgA values at different time points in mild, moderate and severe illness groups given with standard deviation (±SD). Only statistically significant differences are presented (*p < .05, **p < .005, ****p < .00001).
(B) Percentages of positive, borderline and negative samples for IgA at different time points overall and in the mild, moderate and severe disease groups.
(C) Mean IgA values at different time points in vaccinated and unvaccinated patients given with standard of deviation (±SD). Statistically significant differences are shown (**p < .005, ***p < .0005; ns = not significant, p > .05).
Percentage of seropositivity at different time points overall and in the different severity groups
At week 1, overall 49% of the tested samples were positive. At weeks 3–4, over 90% of the tested samples overall were positive and the high percentage of seropositivity remained stable throughout the observation period, with over 95% of tested samples overall positive at weeks 26–40. In the mild group at week 1, there were 35% positive samples and at week 2, there were 89% − 2.5 times more than at week 1. This percentage remained stable throughout the observation period and 90% of the samples were positive at weeks 26–40. In the moderate group at week 1, there were 43% positive samples and the percentage of seropositivity increased to 100% at weeks 3–4. It remained so for the rest of the observation period. In the severe group, all patients tested (100%) were positive at week 1 and at weeks 3–4. The percentages of positive, borderline and negative samples are presented in .
Comparison between vaccinated and unvaccinated patients
The mean IgA values were higher in vaccinated patients than in unvaccinated patients at all time points. Statistically significant differences between the mean values were observed at week 1 (p = .0013), week 2 (p = .0030), weeks 5–13 (p = .0024) and at weeks 26–40 (p = .0006). No significant difference was found at weeks 3–4. The mean IgA values in vaccinated and unvaccinated patients are presented in .
IgG antibodies
Dynamics of IgG antibodies in different severity groups
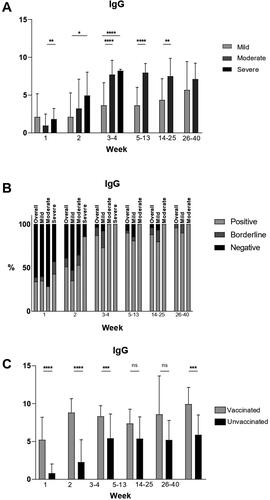
Except for week 1, at all time points, the mean IgG values were higher in the moderate and severe groups compared to the mild group. For all severity groups peak mean values were reached at weeks 3–4. Mean IgG values remained steady during the observation period and persisted at high levels at weeks 26–40 in all groups. Mean IgG values in the mild, moderate and severe groups are presented in .
Figure 3. IgG values in COVID-19 patients at different time points after disease onset.
(A) Mean IgG values at different time points in mild, moderate and severe illness groups given with standard deviation (±SD). Only statistically significant differences are presented (*p < .05, **p < .005, ****p < .00001).
(B) Percentages of positive, borderline and negative samples for IgG at different time points overall and in the mild, moderate and severe disease groups.
(C) Mean IgG values at different time points in vaccinated and unvaccinated patients given with standard of deviation (±SD). Statistically significant differences are shown (***p < .0005, ****p < .00001; ns = not significant, p > .05).
Percentage of seropositivity at different time points overall and in the different severity groups
At week 1, 34% of tested samples overall were positive. The percentage of seropositive samples increased to 87% at weeks 3–4. The percentage remained high until weeks 26–40 when 96% of all samples tested were positive, 4% were borderline and 0% were negative. In the mild group, this trend was similar, with 35% positive samples at week 1, 73% at weeks 3–4 and a slow increase until weeks 26–40, when 90% of the tested samples were positive, 10% were borderline and 0% were negative. In the moderate group at week 1, there were 29% positive samples and 100% were positive at weeks 3–4, which remained so throughout the rest of the observation period. In the severe group, 43% were positive at week 1. At weeks 3–4, all tested patients were positive for IgG antibodies. The percentages of positive, borderline and negative samples are presented in .
Comparison between vaccinated and unvaccinated patients
The mean IgG values were higher in vaccinated patients than in unvaccinated patients at all time points. Statistically significant differences were observed at week 1 (p < .0001), week 2 (p < .0001), weeks 3–4 (p = .0008) and at weeks 26–40 (p = .0001). The mean IgG values in vaccinated and unvaccinated patients are presented in .
Comparison between sex and age groups
No statistically significant differences were found between the mean viral load, IgA, IgM and IgG values of female and male patients and between the mean values of patients ≥65 and <64 years old at any time point.
Viral load levels of SARS-CoV-2 in mild, moderate and severe patients
To determine when the peak of viral shedding occurs and to evaluate its dynamics over time, we measured and analyzed the viral load from COVID-19 patients at four time points/weeks: first (1–7 days), second (8–14 days), third (15–21 days) and fourth (22–28 days) after onset of symptoms or hospital admission.
The peak of viral load in the patients with mild disease occurred within the first 2 weeks after onset of symptoms. After this period, we noticed a relatively rapid clearance, and viral RNA was detected at levels that had no medical significance. The dynamics of mean values of viral loads (±SD) are presented in . The quantitation of viral RNA during the first and second weeks determined similar viral loads (3.93 × 10⁵ copies/mL vs. 4.40 × 10⁵ copies/mL). At weeks 3 and 4, there was a significant decrease in the viral loads: 21.86 copies/mL vs. 2.26 copies/mL.
Figure 4. Individual values (left panels) and mean values (right panels) of SARS-CoV-2 viral load from nasopharyngeal swab specimens in patients with mild (A), moderate (B) and severe (C) COVID-19. SARS-CoV-2 viral load is determined at four time points: 0–7 days, 8–14 days, 15–21 days and 22–28 days after onset of symptoms. Statistical differences were determined by the Kruskal–Wallis test. Statically significant differences are shown (*p < .05, **p < .005, ***p < .0005, ****p < .00001; ns = not significant, p > .05).
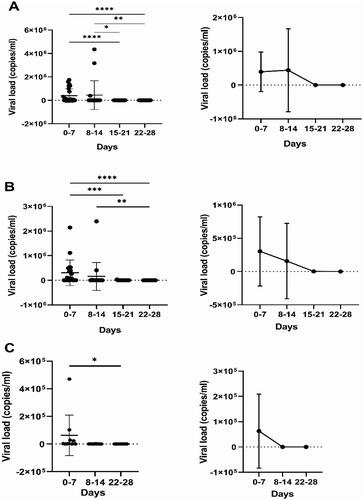
In patients with moderate symptoms, the highest mean viral load (3.03 × 10⁵ copies/mL), was in the first week after onset of symptoms. In the second week, the mean viral load was 1.5 × 10⁵ copies/mL; however, there was no statistically significant difference between these two results. As expected, at the next follow-up, the mean viral load continued to decrease to 3.2 × 10³ copies/mL. In one patient in this group, RNA was detected up to the 25th day after onset of symptoms. The dynamics of viral load in patients in this group are presented in .
In the severe group, nasopharyngeal swab samples were collected upon patients’ admission to the hospital. The mean value was 6.30 × 10⁴ copies/mL. At week 2, the mean viral load decreased to 2.80 × 10² copies/mL. After 21 days of hospital stay, viral shedding was established only in two patients. In this group, we observed an increase in viral load only in one patient during the second week. It is likely that deterioration of the condition occurred very quickly, before reaching viral peak. It is also interesting that viral RNA in relatively high titres (1.85 × 10³ copies/mL) was detected up to 27 days after admission to the hospital. Two patients in this group were PCR negative at hospital admission. Mean and individual viral loads are presented in .
Analysis of the viral load was performed by comparing the mean values between the three groups at each time point of the study. During the first and second weeks, higher viral loads were found in patients with mild COVID-19 symptoms. For the third week, a comparison was made only between the mild and the moderate groups, and at this point, a higher load was found in the latter group. In the fourth week, a higher viral load was found in the severe group. The viral loads of patients with mild, moderate and severe COVID-19 are presented in with mean values for the group. A comparison between the mean antibody levels and mean viral loads of the different severity groups throughout the time period of the study is shown in .
Figure 5. Comparison between SARS-CoV-2 viral loads during the first (A), second (B), third (C) and fourth (D) weeks with mean values ± SD (in copies/mL) from patients with mild, moderate and severe COVID-19 infection.
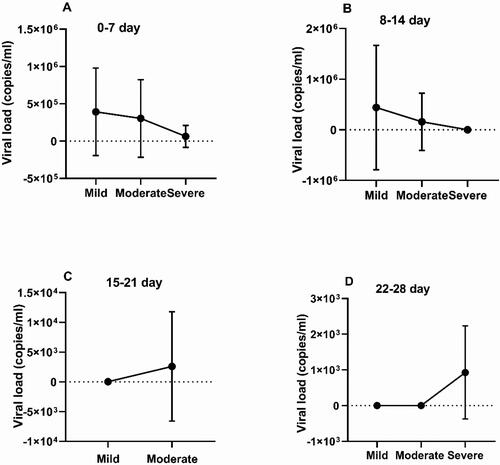
Table 1. Mean antibody levels and mean viral loads in the different disease severity groups at different time points.
Correlation between viral load and specific antibodies
To establish whether there was an association between the viral load and antibody levels, the Spearman’s correlation coefficient was calculated. In all severity groups, there was a negative correlation between the viral load and the antibody levels during the first 2 weeks of COVID-19. In patients with mild infection, IgA antibodies were strongly associated with viral load (R = −0.61 vs. −0.64 for the first and second week), while the correlation with IgG was moderate (R = −0.38 vs. −0.44 for the same time points). In the moderate group, the correlation between viral load and antibodies was not as strong as in the mild group but was still present. The viral load in severe patients correlated moderately with IgG antibodies.
Discussion
Antibodies, as one of the main branches of the adaptive immune system and major players in the defence efforts against numerous viral infections, have been the subject of many studies related to SARS-CoV-2. In our study, we observed that, with the exception of four patients who did not show up after initial sampling, all patients had seroconverted at 3 weeks after onset of infection. IgA seroconversion was achieved on average on day 11, IgM on day 11 as well, and IgG on day 14. In general, these results are consistent with data from previous studies [Citation7, Citation11, Citation14].
In this study, we found that the production of anti-S1 IgA and IgG and anti-N IgM antibodies tended to be stronger and more durable in patients with severe and moderate disease compared to patients with mild illness. Peak mean values for the three classes of antibodies in all severity groups were achieved at weeks 3–4 and were highest in patients with severe symptoms. The difference in the mean antibody levels between the mild group, on the one hand, and the moderate and severe groups, on the other, at this time point, was the most conspicuous. This is not surprising since antibody production is the most intense during this period and any differences between the strength of antibody response in the three severity groups would be accentuated. The observed differences between the mean values were in some cases maintained until weeks 5–13 and only occasionally beyond that time point. At weeks 14–25 and afterwards, IgM antibodies were practically negative in the majority of patients, while IgA and IgG antibodies had reached comparable levels in the mild and moderate groups. In most cases, IgA and IgG antibodies persisted at weeks 26–40 with high mean values and over 95% seropositivity in patients. Therefore, we have observed that the timeline of antibody production in SARS-CoV-2 infection is consistent with previously established generic models for antibody dynamics during other infectious diseases, as well as with results from preceding studies on antibody kinetics in COVID-19 patients [Citation15]. Gaebler et al. [Citation16] reported that 6 months after infection there was a significant decline in anti-RBD IgG antibodies but not in IgA antibodies. In contrast, the results reported by Kowitdamrong et al. [Citation17] suggested that IgA responses started declining significantly 1 month after the disease onset.
There have been claims that the presence of antibodies against the N and S proteins are clinically relevant for protection during COVID-19 and that the level of antibody response at early stages might be predictive of clinical outcome [Citation18]. On the other hand, others have found that stronger antibody responses were observed in patients with more severe disease and therefore do not prevent development of a severe form of COVID-19 [Citation19–21]. Yet, results from some studies have shown no significant differences between levels of antibodies in different severity groups [Citation6, Citation22]. In our study, patients with milder form of disease did not display a stronger antibody response, which indicates that the resolution of SARS-CoV-2 infection is not associated with higher antibody levels. In addition, no significant differences were observed during the first 2 weeks of infection, revealing that, on their own, antibodies are not reliable prognostic factors for disease outcome. Generally, patients with mild disease had lower mean antibody values. The stronger antibody response in patients with more severe symptoms might be a reciprocal reaction to a greater antigen load, as suggested by Kowitdamrong et al. [Citation17]. However, some studies have proposed that antibodies might play a role in the immunopathological processes responsible for worsening of the clinical course in these patients [Citation10, Citation23]. Ameratunga et al. [Citation24] have suggested that the leading factor for determining disease outcome is the adequacy of T-cell responses with the humoral immunity playing at best a supplementary role in clearance of infection.
As expected, all vaccinated patients presented with IgA and IgG antibodies on initial testing and overall only three of them developed IgM antibodies. The mean values of IgA and IgG in immunized patients were generally higher, while the mean values of IgM were lower than in unimmunized patients. This is not surprising since the commercial vaccines available stimulate the production of anti-S antibodies, and the anti-S antibody response in vaccinated individuals is stronger and faster during infection. The differences in IgG mean values were significant at most time points and were most pronounced during the first week. In a study on breakthrough infections, Duarte observed a drastic increase in anti-S1-RBD IgG antibodies 2 and 4 weeks after onset of the disease [Citation25]. This suggests that infection in vaccinated individuals rapidly triggers the production of specific anti-S1-IgG antibodies, which are generally considered one of the main players in viral neutralization. In our study, we noticed that, with time, the adaptive immune response in unvaccinated patients started catching up: the difference between the mean IgG antibody values in the two groups slowly diminished and was no longer statistically significant at weeks 5–13. Notably, at weeks 26–40, the mean IgG values in the vaccinated group were significantly higher than in the unvaccinated group, which is an indication of enhanced durability of IgG antibodies in individuals who had been both immunized and infected compared to those who had only been exposed to natural infection. It has been suggested that both breakthrough infection (infection after vaccination) and hybrid immunity (immunization following recovery from infection) provide an enhanced antibody response, and more specifically neutralization antibodies, compared to vaccination alone [Citation26].
Real-time RT-PCR is a major diagnostic tool for many infectious pathogens and SARS-CoV-2 is no exception. Viral load monitoring is a key approach to elucidate the factors that influence the severity of COVID-19 infection. Overall, in this study, the highest levels of SARS-CoV-2 viral load were observed during the first and second week of disease onset, regardless of disease severity. In patients with moderate and severe COVID-19, the viral loads were lower than in patients with mild illness. After this period, virus clearing occurred in patients with mild symptoms, and the viral load decreased rapidly after the 14th day. Subsequently, during the third and fourth weeks, the viral loads in patients with moderate and severe disease were higher than in patients in the mild group. This means that the duration of viral shedding was longer in patients with more severe symptoms. In one patient from the severe group, there was a prolonged presence of viral RNA, which we followed up for 27 days. However, when analysing the data, the time of sampling should be considered, especially in severe cases, where the first sample was taken on admission to the hospital. Therefore, there could have been a considerable delay between the onset of disease and the time at which the initial RT-PCR testing was done, and we can assume that the initial viral load was higher in these individuals.
Similar to our results, other authors have also found a peak of viral RNA load during the first week after onset of disease in patients with mild symptoms [Citation27] and viral clearance after 8- to 14-day post-infection [Citation27, Citation28]. According to Liu et al. [Citation29], viral clearance in patients with mild disease can occur as early as the 10th day, while patients with severe COVID-19 have a long viral shedding period [Citation29, Citation30]. Our results are in agreement with a survey on patients with moderate and mild disease, which established no significant difference between both groups in their viral load and symptom duration [Citation31]. Many studies have been done on viral load and its dynamics in the course of COVID-19. There are studies showing that high viral load is a predictor of COVID-19 severity and outcome, especially in older patients and those with comorbidities [Citation32, Citation33]. Such comparisons should take into account many factors related to how the study was conducted.
In our study, we could not establish a relationship between the initially detected viral load levels and the severity of COVID-19. The importance of the level of viral load is uncontested, but it cannot be considered on its own as a determining factor for the course of infection.
The authors acknowledge that there are several limitations in this study. Firstly, the number of participants is small, which did not allow us to perform a calculation and justification of the sample size. Another limitation is the lack of detailed information on the type, number of doses and time of administration of the vaccines in immunized patients.
Conclusions
Many attempts have been made to associate the severity of symptoms during COVID-19 with certain parameters such as serum antibody levels and viral load in nasopharyngeal secretions. Seroconversion rates were high in COVID-19 patients from all severity groups and we found that COVID-19 patients with moderate/severe symptoms, as well as vaccinated patients, had higher antibody levels both at the time of peak antibody production and 9-month post-infection. At most time points throughout the duration of the study, anti-S IgG and IgA antibodies were better at differentiating between the three severity groups than anti-N IgM antibodies and were also more durable. As expected, viral loads were highest during the first week after disease onset regardless of disease severity. However, in patients with moderate and severe illness viral loads remained higher for a longer period of time compared to patients with mild symptoms.
Author contributions
Conceptualization: I.C.; methodology: I.C. and I.T.; software: K.N. and I.T.; validation: I.C., M.B., M.P.P., K.P. and R.M.G.; formal analysis: K.N and T.G.; investigation: I.T., T.G, V.I. and A.Z.; resources: I.C., K.N., E.D. and I.T.; data curation: T.G., I.T. and M.B.; writing – original draft preparation: K.N. and I.T.; writing – review and editing: I.C.; supervision: I.C. and R.M.G.; project administration: I.T. and M.B.; funding acquisition: I.C. All authors have read and agreed to the published version of the manuscript.
Disclosure statement
The authors declare no conflict of interest.
Data availability statement
The anonymized data that support the findings of this study are available on request from the corresponding authors.
Additional information
Funding
References
- Liu Y, Liao W, Wan L, et al. Correlation between relative nasopharyngeal virus RNA load and lymphocyte count disease severity in patients with COVID-19. Viral Immunol. 2021;34(5):1–12. doi: 10.1089/vim.2020.0062.
- Waller H, Carmona-Vicente N, James A, et al. Viral load at hospitalization is an independent predictor of severe COVID-19. Eur J Clin Invest. 2023;53:e13882.
- Pawar RD, Balaji L, Mehta S, et al. Viral load and disease severity in COVID-19. Intern Emerg Med. 2022;17(2):359–367. doi: 10.1007/s11739-021-02786-w.
- Long H, Zhao J, Zeng HL, et al. Prolonged viral shedding of SARS-CoV-2 and related factors in symptomatic COVID-19 patients: a prospective study. BMC Infect Dis. 2021;21(1):1282. doi: 10.1186/s12879-021-07002-w.
- Kong WH, Zhao R, Zhou JB, et al. Serologic response to SARS-CoV-2 in COVID-19 patients with different severity. Virol Sin. 2020;35(6):752–757. doi: 10.1007/s12250-020-00270-x.
- Cheng ML, Liu HY, Zhao H, et al. Longitudinal dynamics of antibody responses in recovered COVID-19 patients. Signal Transduct Target Ther. 2021;6(1):137. doi: 10.1038/s41392-021-00559-7.
- Chvatal-Medina M, Mendez-Cortina Y, Patiño PJ, et al. Antibody responses in COVID-19: a review. Front Immunol. 2021;12:633184. doi: 10.3389/fimmu.2021.633184.
- Efrati S, Catalogna M, Hamed RA, et al. Early and long term antibody kinetics of asymptomatic and mild disease COVID-19 patients. Sci Rep. 2021;11(1):13780. doi: 10.1038/s41598-021-93175-y.
- Borremans B, Gamble A, Orager KC, et al. Quantifying antibody kinetics and RNA detection during early-phase SARS-CoV-2 infection by time since symptom onset. eLife. 2020;9:e60122. doi: 10.7554/eLife.60122.
- Sánchez-Zuno GA, Matuz-Flores MG, González-Estevez G, et al. A review: antibody-dependent enhancement in COVID-19: the not so friendly side of antibodies. Int J Immunopathol Pharmacol. 2021;35:20587384211050199. doi: 10.1177/20587384211050199.
- Sette A, Crotty S. Adaptive immunity to SARS-CoV-2 and COVID-19. Cell. 2021;184(4):861–880. doi: 10.1016/j.cell.2021.01.007.
- Quinti I, Lougaris V, Milito C, et al. A possible role for B cells in COVID-19? Lesson from patients with agammaglobulinemia. J Allergy Clin Immunol. 2020;146(1):211–213.e4. doi: 10.1016/j.jaci.2020.04.013.
- WHO. Clinical management of COVID-19: living guideline. Geneva: World Health Organization; 2022. https://apps.who.int/iris/handle/10665/362783
- Boechat JL, Chora I, Morais A, et al. The immune response to SARS-CoV-2 and COVID-19 immunopathology – current perspectives. Pulmonology. 2021;27(5):423–437. doi: 10.1016/j.pulmoe.2021.03.008.
- Dan JM, Mateus J, Kato Y, et al. Immunological memory to SARS-CoV-2 assessed for up to 8 months after infection. Science. 2021;371:eabf4063. doi: 10.1126/science.abf4063.
- Gaebler C, Wang Z, Lorenzi JC, et al. Evolution of antibody immunity to SARS-CoV-2. Nature. 2021;591(7851):639–644. doi: 10.1038/s41586-021-03207-w.
- Kowitdamrong E, Puthanakit T, Jantarabenjakul W, et al. Antibody responses to SARS-CoV-2 in patients with differing severities of coronavirus disease 2019. PLoS One. 2020;15(10):e0240502. doi: 10.1371/journal.pone.0240502.
- Wu J, Liang B, Chen C, et al. SARS-CoV-2 infection induces sustained humoral immune responses in convalescent patients following symptomatic COVID-19. Nat Commun. 2021;12(1):1813. doi: 10.1038/s41467-021-22034-1.
- Patil HP, Rane PS, Shrivastava S, et al. Antibody (IgA, IgG, and IgG subtype) responses to SARS-CoV-2 in severe and nonsevere COVID-19 patients. Viral Immunol. 2021;34(3):201–209. doi: 10.1089/vim.2020.0321.
- Yan X, Chen G, Jin Z, et al. Anti-SARS-CoV-2 IgG levels in relation to disease severity of COVID-19. J Med Virol. 2022;94(1):380–383. doi: 10.1002/jmv.27274.
- Dobaño C, Ramírez-Morros A, Alonso S, et al. Persistence and baseline determinants of seropositivity and reinfection rates in health care workers up to 12.5 months after COVID-19. BMC Med. 2021;19(1):155. doi: 10.1186/s12916-021-02032-2.
- Feng C, Shi J, Fan Q, et al. Protective humoral and cellular immune responses to SARS-CoV-2 persist up to 1 year after recovery. Nat Commun. 2021;12(1):4984. doi: 10.1038/s41467-021-25312-0.
- Farshadpour F, Taherkhani R. Antibody-dependent enhancement and the critical pattern of COVID-19: possibilities and considerations. Med Princ Pract. 2021;30(5):422–429. doi: 10.1159/000516693.
- Ameratunga R, Woon ST, Lea E, et al. The (apparent) antibody paradox in COVID-19. Expert Rev Clin Immunol. 2022;18(4):335–345. doi: 10.1080/1744666X.2022.2044797.
- Duarte LF, Gálvez NM, Iturriaga C, et al. Immune profile and clinical outcome of breakthrough cases after vaccination with an inactivated SARS-CoV-2 vaccine. Front Immunol. 2021;12:742914. doi: 10.3389/fimmu.2021.742914.
- Bates TA, McBride SK, Leier HC, et al. Vaccination before or after SARS-CoV-2 infection leads to robust humoral response and antibodies that effectively neutralize variants. Sci Immunol. 2022;7(68):eabn8014. doi: 10.1126/sciimmunol.abn8014.
- Anantharaj A, Gujjar S, Verma N, et al. Resolution of viral load in mild COVID-19 patients is associated with both innate and adaptive immune responses. J Clin Virol. 2022;146:105060. doi: 10.1016/j.jcv.2021.105060.
- Challenger JD, Foo CY, Wu Y, et al. Modelling upper respiratory viral load dynamics of SARS-CoV-2. BMC Med. 2022;20(1):25. doi: 10.1186/s12916-021-02220-0.
- Liu Y, Yan LM, Wan L, et al. Viral dynamics in mild and severe cases of COVID-19. Lancet Infect Dis. 2020;20(6):656–657. doi: 10.1016/S1473-3099(20)30232-2.
- Fontana LM, Villamagna AH, Sikka MK, et al. Understanding viral shedding of severe acute respiratory coronavirus virus 2 (SARS-CoV-2): review of current literature. Infect Control Hosp Epidemiol. 2021;42(6):659–668. doi: 10.1017/ice.2020.1273.
- Caplan A, Bates KW, Brioni C, et al. Clinical characteristics and viral load dynamics of COVID-19 in a mildly or moderately symptomatic outpatient sample. PLoS One. 2021;16(10):e0258970. doi: 10.1371/journal.pone.0258970.
- Dadras O, Afsahi AM, Pashaei Z, et al. The relationship between COVID-19 viral load and disease severity: a systematic review. Immun Inflamm Dis. 2022;10:e580.
- Mehraeen E, Karimi A, Barzegary A, et al. Predictors of mortality in patients with COVID-19: a systematic review. Eur J Integr Med. 2020;40:101226. doi: 10.1016/j.eujim.2020.101226.