
Abstract
Bladder cancer holds a steady 10th place among oncological diseases. Follow-up and timely diagnosis of recurrence and progression of bladder cancer are still based on regular but outdated cystoscopy followed by cytological examination. To reduce the number of cystoscopy procedures, new and reliable biomarkers for predicting tumor behavior must be developed. The aim of this study was to confirm our previous results that demonstrated overexpression of AP1S1, CDK9, FIGF and HDAC11 in muscle-invasive bladder cancer. The project management was performed using iterative flexible project work (Flexible Methodology for Innovative Projects in Scientific Organizations, FMIPSO). Gene expression analysis of the AP1S1, CDK9, FIGF and HDAC11 genes was evaluated in 39 newly collected non-invasive and muscle-invasive bladder tumors. Differential gene expression was calculated using the ΔΔCt method with GPDH as a housekeeping gene. The 4,0-fold change in gene expression was used as a cutoff to determine up- or down-regulation compared to the negative control. Our results demonstrate the involvement of the FIGF, CDK9 and HDAC11 in tumor progression and their potential use as candidate biomarkers to characterize invasive tumor phenotype and muscle progression, as well as potentially reduce the number of cystoscopies. We used FMIPSO to be able to achieve the results at the optimum level of efficiency and control of the project with all possible constraints in scientific organizations.
Introduction
Bladder cancer (BC) is a multifactorial disease which holds a steady 10th place among oncological diseases. It affects predominantly Caucasian men over the age of 60 from industrialized countries, as well as from countries with a tradition of smoking habits and diets high in fried foods and red meat [Citation1,Citation2]. Among European countries, Bulgaria is in the intermediate position with a 2021 mortality rate at 14.3 and 3.4 per 100,000 for men and women, respectively [Citation3]. The exact causes of bladder cancer are not yet completely understood; however, there is a worldwide trend toward an increase in the incidence of BC due to global changes in exposure to risk factors and the aging of the world population [Citation4].
Currently, a well-defined classification of BC is used, depending on the stage and grade of the tumor. Per this classification, patients with BC are grouped into five categories depending on the tumor size, degree of invasion and histological pattern (Tis – T4). Most of the newly diagnosed cases are found to be superficial, non-muscle invasive, papillary transitional-cell carcinomas (NMIBC, Non-Muscle Invasive Bladder Cancer). Although NMIBC are mostly pTa/T1 tumors, they are characterized by genetic instability, the tendency to relapse and to progress into invasive tumors [Citation5,Citation6]. However, the classification lacks information related to prediction of recurrence and potential for progression. This means that choosing the right therapeutic strategy is still a problem due to the high incidence and specific course of development of BC [Citation7–9]. At present, the follow-up and timely diagnosis of recurrence and progression of BC are based on regular but outdated cystoscopy, followed by cytological examination. However, according to current guidelines for the evaluation of NMIBC, this procedure (cystoscopy followed by cytology) should be performed as early as three months after tumor removal [Citation9]. On the one hand, cytology is a relatively cumbersome and burdensome process for the healthcare system, requiring hospitalization of the patient, additional time allocated by the urologist for the procedure, as well as a small, but still existent risk of infections. On the other hand, there is the physical and emotional discomfort of the patient, as well as the time wasted for the procedure. In addition, a limitation of urine cytology and current urine markers is their low sensitivity for low-grade relapses [Citation10]. However, according to current knowledge, no single urinary marker can replace cystoscopy during a follow-up, so as potentially to reduce the incidence of cystoscopy. In order to cut down the number of cystoscopy procedures, new, reliable and powerful biomarkers for predicting tumor behavior must be developed.
In recent years, many efforts have been made to discover new biomarkers by exploiting the growing capabilities of gene expression technologies. Gene-expression profiling supports the detection of new molecules - potential predictors or targets for antitumor therapy [Citation11,Citation12] as well as molecular biomarkers of potential clinical relevance [Citation13,Citation14]. Our research team also used gene-expression analysis to characterize the profiles of non-invasive and muscle-invasive bladder tumors. We found differences in gene expression levels between non-invasive and invasive bladder tumors [Citation15]. The present study is an extension of our previous results that demonstrated overexpression of AP1S1 (adaptor related protein complex 1 subunit sigma 1), CDK9 (Cyclin-dependent kinase 9), FIGF (c-fos induced growth factor, VEGFD) and HDAC11 (histone deacetylase 11) in muscle-invasive bladder cancer. The aim of this study was to validate/confirm the results in a new group of individual samples obtained from non-invasive (pTa to pT1) and muscle-invasive (pT2 to pT2b) uroepithelial tumors.
Subjects and methods
Ethics statement
The study protocol was approved by the Ethics Committee of the Medical University of Sofia, Bulgaria (protocol No 76/23.04.2012). Each patient provided written informed consent to participate in the study and completed a questionnaire containing data on occupational exposure, environmental hazards, lifetime use of tobacco products and familial anamnesis.
Patients
Newly diagnosed bladder cancer samples were collected from 52 Caucasian patients undergoing surgical treatment at the Department of Urology, UMBALSM ‘N. I. Pirogov’, Sofia, Bulgaria, in the period of 2017 - 2019. The patients were selected according to the specific inclusion and exclusion criteria. Inclusion criteria were the presence of a mass in the bladder confirmed by cystoscopy, signing of an informed consent after detailed familiarization with the aims, objectives and processes of the study, and undergoing surgery to remove the tumor by transurethral resection (TUR). Exclusion criteria were absence of a mass in the bladder, patient refusal to sign informed consent or misunderstanding of the nature of the study. Relevant clinical data of tumor grade, stage, histology, number of recurrences and data of any prior treatment such as chemotherapy, radiotherapy or immunotherapy, were collected form the trained urologist. Complete staging procedures were performed to precisely define tumor size - T, nodal involvement - N and presence of distant metastases - M. None of the patients received neoadjuvant radiotherapy or chemotherapy.
Samples
All BC samples collected were frozen in liquid nitrogen and stored at -800C. Normal bladder tissue (as healthy control tissue) was taken from patients suffering from benign prostatic hyperplasia. The histological evaluation of ‘normality’ of the taken bladder tissue was performed by a trained pathologist. The tumor samples were divided into several clinical subgroups according to tumor stage (precancerous, pTa; pT1; pT2; pT2a and pT2b), tumor grade (G1, G2, G3) and the degree of muscle invasion (invasive versus non-invasive). Only samples that met quality control (QC) criteria were used for further genetic analysis.
RNA extraction
Total RNA was isolated using the ready-to-use TRIzolVR LS Reagent (Invitrogen, Cat. No 10296-010) according to the manufacturer’s protocol. Double-stranded cDNA was prepared from 1 mg of extracted total RNA using the RT2 First Strand Kit for cDNA synthesis (Qiagen, Cat. No 330401), which contains a step for genomic DNA elimination. RNA yield and purity were determined using NanoDropVR ND-1000, and RNA integrity, by 1% gel electrophoresis.
Quantitative real time PCR (qRT-PCR)
The relative mRNA expression of AP1S1, CDK9, FIGF and HDAC11 genes (found to be up-regulated in our previous study [Citation15]) was evaluated according to the manufacturer’s instructions (SA Biosciences, Qiagen - www.sabiosciences.com, ref.number 330001). GPDH (Glycerol-3-phosphate dehydrogenase) was used as a housekeeping gene, according to the manufacturer’s protocol. Quantitative PCR was performed using RT2 qPCR SYBR Green MasterMix in a 96-well plate format with the ABI 7500 instrument (Applied Biosystems). The instrument program was as follows: initial denaturation at 95°C for 10 min and 40 cycles of 95°C for 15 s followed by 60°C for 1 min, as previously described [Citation15].
Statistical analysis
Differential gene expression in the test samples relative to the control samples was calculated using the 2-ΔΔCt method. The obtained results were exported in Excel format, and further analyses were performed with the help of web-based software (www.sabiosciences.com). A 4,0-fold change in gene expression was used as the cutoff threshold to determine up- or down-regulation compared to the healthy tissue (negative control), as described in our previous study [Citation15]. Statistical analyses were performed with the GraphPad Prism 5,0 statistical program. Statistical analyses included one-way analysis of variance (ANOVA) (for Gaussian distribution), non-parametric Kruskall-Wallis test (in the absence of a Gaussian distribution), and descriptive statistics of the gene expression results and questionnaire obtained. Student’s T-test (with normal distribution of the sample) and Mann-Whitney test (with non-normal sample distribution) were applied in order to compare the results of the two groups. Differences were considered statistically significant at the p < 0.01 level, which was denoted with an asterisk ‘*’.
Project management approach
A flexible methodology for the development and management of innovative projects in scientific organizations (FMIPSO) was used to achieve systematic and targeted results, oriented toward the research goals and yet flexible according to the preliminary iterations [Citation16]. FMIPSO is characterized by its iterative nature and orientation to potential innovations. It allows for the dynamic adaptation of project plans to evolving circumstances, fostering efficient decision-making processes and optimizing project outcomes. By employing an iterative approach, we could continually evaluate and refine project objectives, methodological constrains, and deliverables throughout the project’s life cycle, thereby allowing them to address any emerging challenges or capitalize on new opportunities. Furthermore, this methodology encouraged a collaborative and interdisciplinary environment, promoting the exchange of ideas, knowledge and expertise among team members, which is crucial for the success of innovative scientific endeavors. This agile project management methodology is specifically tailored to scientific organizations and provides a structured framework that facilitates flexibility, adaptability and innovation, thereby improving the overall performance and success of scientific projects [Citation16].
Results
Sample distribution and epidemiologic data of the studied cohort
Of the collected 52 bladder tissue samples, 39 were confirmed as cancer tissue, 4 were classified as adenoma glandullae prostatae, 5 were found to be chronic inflammation (cystitis) and 4 were normal bladder tissue (negative control). One tumor sample did not meet the QC criteria and was excluded from further study.
The findings regarding the epidemiologic characteristics of the bladder tumor cohort and the distribution in clinical subgroups are presented in . The average age at diagnosis of the patients was 70 y (51 – 87 y). Ten were female and 28 male patients. Smoking was reported by 77% of the patients, with the highest number being those who smoked 20 cigarettes per day (26% of all smokers), followed by 20% who smoked 10 cigarettes per day. Five patients had a positive family history, three reported hazards and two presented with distant metastases ().
Table 1. Pathological characteristics of the studied group of patients with bladder cancer. The table demonstrates clinical and epidemiological data of the studied patients as well as characteristics of the analyzed tumor samples.
Gene expression analysis
Overall, the results showed variability in gene expression between the individual tumor samples (). However, the average expression for the AP1S1 gene compared to the negative control (healthy tissue) was 1.9-fold, for the FIGF gene − 2.6-fold and about 12.8-fold for CDK9 and HDAC11 genes (, ). Statistical analysis using a one-way ANOVA parametric test demonstrates significant differences between the means (p < 0.0001). Unpaired t-test column statistics indicated similar significance, comparing the gene expression levels of AP1S1 and CDK9 (p < 0.0001); AP1S1 and HDAC11 (p < 0.0001); as well as FIGF and CDK9 (p < 0.0001), and FIGF and HDAC11 (p < 0.001) ().
Figure 1. Gene expression levels of the AP1S1, FIGF, CDK9 and HDAC11 genes among the uroepithelial samples studied. The average expression levels of the tested genes are shown. Dashed line marks cut-off value of 4-fold change in gene expression. ***P<0.0001 indicates a statistically significant difference between the AP1S1 and FIGF gene expression levels in comparison to the CDK9 gene. ^^P<0.001 and ^^^P<0.0001 indicate significant difference of AP1S1 and FIGF gene expression levels in comparison to the HDAC11 gene, respectively. "ns" indicates "non-significant" difference between CDK9 and HDAC11 gene expression levels.
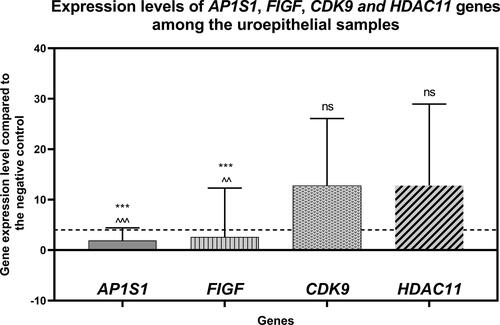
Table 2. Statistical data from the gene expression analysis. Descriptive statistics of the data from the gene expression results are shown: minimum, maximum and median values, range, mean, confidence interval (CI) and standard deviation (Std. Deviation) of the mean.
Gene expression analysis among clinical subgroups
The most significant changes in the expression levels of the studied genes in each distant clinical subgroup were identified according to tumor stage, degree of invasion and tumor grade (). The distribution of the tumor samples in clinical subgroups is presented in .
Figure 2. Expression levels of the AP1S1, FIGF, CDK9 and HDAC11 genes among the tested clinical groups in terms of tumor stage (Precancerous, pTa, рТ1, рТ2, pT2a and pT2b). The average expression levels of the tested genes are shown. Dashed line marks cut-off value of 4-fold change in gene expression. Error bars show standard deviation of the means. The distinct clinical groups are four groups of uroepithelial carcinoma: stage pTa, pT1, pT2, pT2a and T2b as well as a group of tumor lesions from a chronic inflammatory process (Precancerous lesion); ”*” indicates a P-value less than 0.05, “**” indicates a P-value less than 0.01 and “***”indicates a P-value less than 0.001 for one-sample Wilcoxon test.
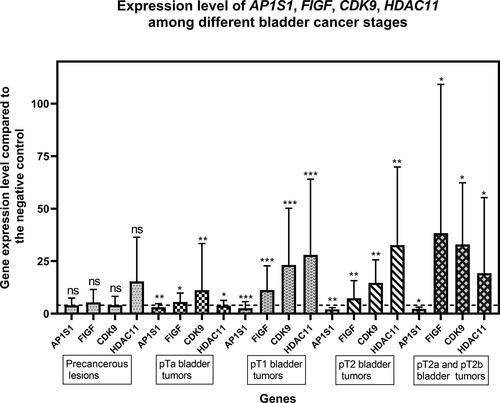
Figure 3. Expression levels of AP1S1, FIGF, CDK9 and HDAC11 genes among the tested clinical groups in terms of degree of invasion into the muscle layer. The average expressions of the tested genes are shown. Dashed line marks cutoff 4-fold change in gene expression. Error bars show standard deviation of the means. P value < 0.0001 found by Kruskall-Wallis statisticaltest .”*” indicates a P-value less than 0.05, “**” indicates a P-value less than 0.01 and “***”indicates a P-value less than 0.001 for one-sample Wilcoxon test, “ns” indicates nonsignificant.
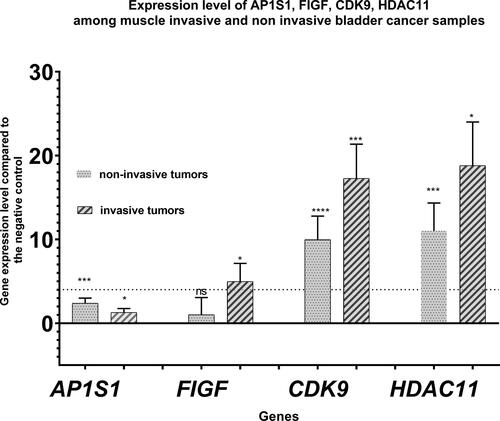
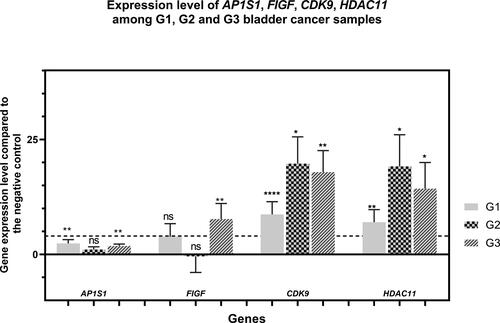
Figure 4. Expression levels of AP1S1, FIGF, CDK9 and HDAC11 genes among the tested clinical groups in terms of tumor grade. The average expression levels of the tested genes are shown in relation to the tumor grade. Dashed line marks cutoff 4-fold change in gene expression. Error bars show standard deviation of the means. The separate clinical groups are uroepithelial tumors with histological grade G1, G2 and G3 . P value < 0.0001 found by One-way ANOVA. . ”*” indicates a P-value less than 0.05, “**” indicates a P-value less than 0.01 “***”indicates a P-value less than 0.001, “***” indicates a P-value less than 0.0001 for one-sample Wilcoxon test, “ns” indicates nonsignificant.
The gene expression pattern of the studied genes according to the tumor stage is presented in . Thus, the up-regulation of AP1S1 ranged from 1 to 3.8-fold compared to negative control (healthy tissue). Moreover, the expression level of this gene was similar among all clinical subgroups: precancerous lesions and tumor subgroups. Significantly altered expression levels among the clinical subgroups were found for the remaining three genes FIGF, CDK9 and HDAC11 (). Significant upregulation of the HDAC11 gene was observed among all subgroups studied, except for the clinical subgroup of pTa tumor stage, where its expression level was close to the cutoff value.
demonstrates the gene expression level of AP1S1, CDK9, FIGF and HDAC11 genes according to the degree of muscle invasion, i.e. muscle invasive and non-invasive clinical subgroups. These data show a significant preponderance of up-regulation of FIGF, CDK9 and HDAC11 genes among muscle-invasive tumors. The gene expression level of FIGF, CDK9 and HDAC11 was 1.014, 9.954 and 11.015 for non-invasive tumors and 4.971, 17. 275 and 18.809 for invasive tumors, respectively. The results for AP1S1 were within a borderline 4-fold change and demonstrate no up-regulation compared to the negative control.
The expression level of the studied genes according to the degree of dedifferentiation or Grading (G1, G2 and G3 clinical subgroups) is presented in . The results also demonstrate up-regulation of the FIGF, CDK9 and HDAC11 genes, but with different expression level among G1, G2 and G3 groups. For the FIGF, increased expression was observed only among G3 tumors − 7.69-fold compared to the negative control. For the CDK9 and HDAC11 genes, expression was found to be increased in all three groups, but with G1 expression levels that were about two times lower than those of G2 and G3.
Discussion
The findings from this study provide valuable insight into the predisposing environmental and genetic factors that may influence the incidence of bladder cancer. The patients were mostly men, with the onset of the disease seven years earlier in men than in women. This gender difference may be a result of the higher proportion of smokers among men. It is believed that the main risk factors for the development of BC are tobacco consumption and occupational and industrial exposures [Citation9]. In fact, smoking is identified as a separate risk factor, due to the fact that cigarette smoke is the most harmful form of tobacco use and one of the main causes of cancer. The main cause of bladder malignancies is gene–environment interactions, mainly due to substances in the urine that are in direct contact with the bladder wall [Citation17]. The first established carcinogen in tobacco smoke, benzo[a]pyrene (BaP), leads to mutations in the TP53 gene, which is defined as the ‘guardian of the genome’ [Citation18]. Other tobacco carcinogens tend to potentiate different initiating factors [Citation19].
An interesting fact is that our patients did not report the presence of everyday-life risk factors, such as the quality of water consumed, the presence of chemicals, products containing polycyclic aromatic hydrocarbons, or the quality of inhaled air, which is largely determined by the gases emitted from the transport industry as well as the time spent in such an environment. This is most likely due to a lack of awareness, rather than the absence of such risk factors.
Carcinogenesis consists of several stages, so in the course of the disease, the neoplastic cell acquires new properties different than those of the highly differentiated urothelial cells [Citation20]. The results of this study confirm the findings of our previous report [Citation15] and reveal specific genetic markers accompanying the morphological changes in uroepithelial tumors. We suggest that these specific genetic markers may be used in the diagnosis, prevention or therapy of the disease. Although our sample is relatively small, consisting of 40 bladder cancer patients, our data confirm the involvement of FIGF, CDK9 and HDAC11 in the process of tumor progression. These genes could be used as potential prognostic markers to characterize the potential for invasive tumor phenotype, for muscle-progression () as well as for more robust patient stratification and therapy. The results for AP1S1 were borderline 4-fold change and demonstrated no up-regulation compared to the negative control. For this reason, the expression of the AP1S1 gene could not be considered a potential reliable marker for the evolution of a BC. Of the three remaining genes (FIGF, CDK9 and HDAC11), FIGF showed increased expression only among uroepithelial tumors, while increased expression of CDK9 and HDAC11 genes was also found among the non-cancerous controls – chronic inflammation samples (). This indicates the non-specificity of CDK9 and HDAC11 gene up-regulation and specifically increased expression of FIGF among muscle-invasive uroepithelial tumors.
The FIGF (c-fos induced growth factor, VEGFD) gene encodes a member of the platelet-derived growth factors (PDGF/VEGF) family. It is active in angiogenesis, lymphangiogenesis and endothelial cell growth. A significant difference in FIGF protein expression levels was found between small cell and non-small cell lung carcinoma [Citation21]. Another study reported that the expression level of the FIGF (VEGFD) gene and its encoded protein significantly decreased after the addition of a targeted drug that inhibited hepatocarcinoma growth in vivo [Citation22].
The CDK9 gene encodes cyclin-dependent kinase 9. This kinase is involved in the formation of a multiprotein TAK/P-TEFb complex required for RNA polymerase II-directed transcription. Deregulation of the Cdk9 anti-apoptotic signaling pathway can lead to malignant transformation in lymphocytes [Citation23] and monocytes [Citation24]. Mohapatra et al. [Citation25] demonstrated induction of apoptosis in vitro after the addition of cdk9 siRNA, dominant-negative cdk9 or cdk9 inhibitor to the treatment of advanced prostate carcinoma. This indicates the involvement of CDK9 in the genesis of advanced prostate carcinoma. Walsby et al. [Citation26] also study a CDK9 inhibitor in the treatment of leukemia cells in vitro. The CDK9 gene is multifunctional and is involved in various cellular pathways. One of the functions of CDK9 is related to stress response, as it forms a complex with cyclin-K, which is necessary to maintain the integrity of the genome. In recent years, the CDK9 gene has been indicated as an attractive potential therapeutic target in a number of malignant oncological diseases such as ovarian carcinoma, osteosarcoma, synovial sarcoma, etc. [Citation27–31].
The HDAC11 (histone deacetylase 11) gene encodes a class IV histone deacetylase localized in the nucleus and involved in the regulation of gene expression. The significance of this gene for oncological diseases is still not well understood, but it has been found to be involved in the regulation of interleukin 10. It has been suggested that aberrant expression of HDAC11 is due to dysregulation of gene expression [Citation32]. Knockdown (depletion) of HDAC11 is sufficient to induce cell death and inhibit metabolic activity in colon cancer cell lines (HCT-116), prostate carcinoma (PC-3), mammary gland (MCF-7) and ovaries (SK-OV-3). At the same time, according to Deubzer et al. [Citation33], reduction of HDAC11 level in healthy tissue does not alter metabolic activity and cell viability, making HDAC11 a suitable drug target in a number of oncological diseases. It has also been suggested that aberrant expression of HDAC11 is associated with the development of uroepithelial tumors in the course of Balkan Endemic Nephropathy [Citation34,Citation35].
These potential bladder cancer biomarkers are able to detect cancer progression at the molecular level. This may further improve the quality of follow-up cystoscopy, supporting the additional role of gene expression testing performed prior to deciding on the frequency of the follow-up cystoscopy. Despite the interesting results, the wider use of FIGF, CDK9 and HDAC11 genes still cannot be recommended for clinical application until further data from a larger group of patients are available.
Conclusions
In this study, we demonstrated the involvement of FIGF, CDK9 and HDAC11 in bladder cancer progression and their potential use as candidate biomarkers to characterize invasive tumor phenotype, muscle progression, and decrease therapeutic burden, which will reduce the number of cystoscopies. We used a flexible methodology for the development and management of innovative projects in scientific organizations (FMIPSO) so that we can achieve the results at the optimal level of efficiency and control of the project with all possible constraints in scientific organizations.
Authors’ contributions
O.A., conceptualization, funding acquisition, methodology, formal analysis, data interpretation, writing – original draft, review and editing; Z.H., investigation, formal analysis, literature search; Z.Y., project administration, sample logistics, formal analysis, writing – review and editing; BM, sample collection, patient communication, writing – review and editing. All authors have read and apporved the final version of the paper.
Disclosure statement
No potential conflict of interest was reported by the authors.
Data availability statement
The data that support the findings of this study are available from the corresponding author, upon reasonable request.
Additional information
Funding
References
- Bladder Source: Globocan 2020. 2021. Available from: https://gco.iarc.fr/today/data/factsheets/cancers/30-Bladder-fact-sheet.pdf
- Zuniga KB, Graff R, Feiger DB, et al. Lifestyle and non-muscle invasive bladder cancer recurrence, progression, and mortality: available research and future directions. Bladder Cancer. 2020;6(1):1–8. doi: 10.3233/blc-190249.
- National Statistical Institute of Bulgaria. Mortality by causes, sex and statistical regions in 2021. 2022. Available from: https://nsi.bg/en/content/3357/mortality-causes-sex-statistical-regions-and-districts
- Ploeg M, Aben KK, Kiemeney LA. The present and future burden of urinary bladder cancer in the world. World J Urol. 2009;27(3):289–293. doi: 10.1007/s00345-009-0383-3.
- Woldu SL, Bagrodia A, Lotan Y. Guideline of guidelines: non-muscle-invasive bladder cancer. BJU Int. 2017;119(3):371–380. doi: 10.1111/bju.13760.
- Pasin E, Josephson DY, Mitra AP, et al. Superficial bladder cancer: an update on etiology, molecular development, classification, and natural history. Rev Urol. 2008;10(1):31–43.
- Lopez-Beltran A, Amin MB, Oliveira PS, et al. Urothelial carcinoma of the bladder, lipid cell variant: clinicopathologic findings and LOH analysis. Am J Surg Pathol. 2010;34(3):371–376. doi: 10.1097/PAS.0b013e3181cd385b.
- Szarvas T. The diagnostic value of microsatellite LOH analysis and the prognostic relevance of angiogenic gene expression in urinary bladder cancer [article in hungarian]. Magy Onkol. 2009;53(4):385–389. doi: 10.1556/MOnkol.53.2009.4.8.
- Babjuk M, Burger M, Compérat EM, et al. European association of urology guidelines on non-muscle-invasive bladder cancer (TaT1 and carcinoma in situ) - 2019 update. Eur Urol. 2019;76(5):639–657. doi: 10.1016/j.eururo.2019.08.016.
- van Rhijn BW, van der Poel HG, van der Kwast TH. Urine markers for bladder cancer surveillance: a systematic review. Eur Urol. 2005;47(6):736–748. doi: 10.1016/j.eururo.2005.03.014.
- Dyrskjot L, Thykjaer T, Kruhoffer M, et al. Identifying distinct classes of bladder carcinoma using microarrays. Nat Genet. 2003;33(1):90–96. doi: 10.1038/ng1061.
- Thykjaer T, Workman C, Kruhoffer M, et al. Identification of gene expression patterns in superficial and invasive human bladder cancer. Cancer Res. 2001;61(6):2492–2499.
- Sanchez-Carbayo M, Socci ND, Lozano JJ, et al. Gene discovery in bladder cancer progression using cDNA microarrays. Am J Pathol. 2003;163(2):505–516. doi: 10.1016/S0002-9440(10)63679-6.
- Sanchez-Carbayo M, Socci ND, Charytonowicz E, et al. Molecular profiling of bladder cancer using cDNA microarrays: defining histogenesis and biological phenotypes. Cancer Res. 2002;62(23):6973–6980.
- Antonova O, Mladenov B, Rangelov S, et al. Expression profiling of muscle invasive and non-invasive bladder tumors for biomarkers identification related to drug resistance, sensitivity and tumor progression. Biotechnol Biotechnol Equip. 2020;34(1):506–514. doi: 10.1080/13102818.2020.1778528.
- Yordanova Z, Stoimenov N, Boyanova O, et al. The long way from science to innovation – a research approach for creating an innovation project methodology. In: Abramowicz W, Corchuelo R, editors. Business information systems. BIS. Lecture notes in business information processing. Cham: Springer; 2019.
- Cumberbatch MG, Jubber I, Black PC, et al. Epidemiology of bladder cancer: a systematic review and contemporary update of risk factors in 2018. Eur Urol. 2018;74(6):784–795. doi: 10.1016/j.eururo.2018.09.001.
- Sen S, Bhojnagarwala P, Francey L, et al. p53 mutagenesis by benzo[a]pyrene derived radical cations. Chem Res Toxicol. 2012;25(10):2117–2126. doi: 10.1021/tx300201p.
- Xue J, Yang S, Seng S. Mechanisms of cancer induction by Tobacco-Specific NNK and NNN. Cancers (Basel). 2014;6(2):1138–1156. doi: 10.3390/cancers6021138.
- Wild PJ, Fuchs T, Stoehr R, et al. Detection of urothelial bladder cancer cells in voided urine can be improved by a combination of cytology and standardized microsatellite analysis. Cancer Epidemiol Biomarkers Prev. 2009;18(6):1798–1806. doi: 10.1158/1055-9965.EPI-09-0099.
- Mairinger FD, Walter RF, Werner R, et al. Activation of angiogenesis differs strongly between pulmonary carcinoids and neuroendocrine carinomas and is crucial for carcinoid tumourgenesis. J Cancer. 2014;5(6):465–471. doi: 10.7150/jca.9235.
- Ji L, Zheng Z, Shi L, et al. Andrographolide decreased VEGFD expression in hepatoma cancer cells by inducing ubiquitin/proteasome-mediated cFos protein degradation. Biochim Biophys Acta. 2015;1850(4):750–758. doi: 10.1016/j.bbagen.2015.01.005.
- Bellan C, De Falco G, Lazzi S, et al. CDK9/CYCLIN T1 expression during normal lymphoid differentiation and malignant transformation. J Pathol. 2004;203(4):946–952. doi: 10.1002/path.1588.
- De Falco G, Giordano A. CDK9: from basal transcription to cancer and AIDS. Cancer Biol Ther. 2002;1(4):342–347.
- Mohapatra S, Chu B, Zhao X, et al. Apoptosis of metastatic prostate cancer cells by a combination of cyclin-dependent kinase and AKT inhibitors. Int J Biochem Cell Biol. 2009;41(3):595–602. doi: 10.1016/j.biocel.2008.07.013.
- Walsby E, Pratt G, Shao H, et al. A novel Cdk9 inhibitor preferentially targets tumor cells and synergizes with fludarabine. Oncotarget. 2014;5(2):375–385. doi: 10.18632/oncotarget.1568.
- Wang J, Dean DC, Hornicek FJ, et al. Cyclin-dependent kinase 9 (CDK9) is a novel prognostic marker and therapeutic target in ovarian cancer. Faseb J. 2019;33(5):5990–6000. doi: 10.1096/fj.201801789RR.
- Li X, Seebacher NA, Xiao T, et al. Targeting regulation of cyclin dependent kinase 9 as a novel therapeutic strategy in synovial sarcoma. J Orthop Res. 2019;37(2):510–521. doi: 10.1002/jor.24189.
- Ma H, Seebacher NA, Hornicek FJ, et al. Cyclin-dependent kinase 9 (CDK9) is a novel prognostic marker and therapeutic target in osteosarcoma. EBioMedicine. 2019;39:182–193. doi: 10.1016/j.ebiom.2018.12.022.
- Eyvazi S, Hejazi MS, Kahroba H, et al. CDK9 as an appealing target for therapeutic interventions. Curr Drug Targets. 2019;20(4):453–464. doi: 10.2174/1389450119666181026152221.
- Franco LC, Morales F, Boffo S, et al. CDK9: a key player in cancer and other diseases. J Cell Biochem. 2018;119(2):1273–1284. doi: 10.1002/jcb.26293.
- Loidl P. Towards an understanding of the biological function of histone acetylation. FEBS Lett. 1988;227(2):91–95. doi: 10.1016/0014-5793(88)80874-3.
- Deubzer HE, Schier MC, Oehme I, et al. HDAC11 is a novel drug target in carcinomas. Int J Cancer. 2013;132(9):2200–2208. doi: 10.1002/ijc.27876.
- Tsvetkova RS. Characteristics of methylation disorders in the genome of patients with Balkan endemic nephropathy. PhD Thesis [In Bulgarian], Medical University of Sofia, Sofia (Bulgaria). 2014, p. 322.
- Kocic G, Cukuranovic J, Stoimenov TJ, et al. Global and specific histone acetylation pattern in patients with Balkan endemic nephropathy, a worldwide disease. Ren Fail. 2014;36(7):1078–1082. doi: 10.3109/0886022X.2014.917562.