
Abstract
Microsatellite instability (MSI) is characterized by a highly immunogenic tumor phenotype and abundant lymphocytic infiltrates. The aim of this study was to investigate the association between four immunohistochemically determined classes of dendritic cells (DC) with microsatellite instability status of 258 colorectal cancer (CRC) patients and to explore the possible role of those cells as prognostic factors for survival. We observed a distinct infiltration pattern of DCs both in tumor stroma (TS) and invasive front (IF), with DCs significantly prevailing in the IF (p < 0.0001). MSI cancer biopsies showed significantly higher infiltration of CD1a + and CD83+ DCs in the TS and IF compared to microsatellite stable CRCs. Survival analysis revealed that higher CD1a + and CD83+ DC numbers both in TS and IF correlated with longer survival of the patients after surgical therapy (p < 0.05, Log rank test). Cox multivariate analysis showed that lower infiltration with CD1a + DCs in TS (p = 0.039) and CD83+ DCs in IF (p = 0.022) was an independent prognostic factor for unfavorable outcome for CRC patients. The results of our study suggest that the immunohistochemically determined CD1a + and CD83+ DCs could be used as a feature of microsatellite instability and could be further explored as prognostic markers for patients’ outcome.
Introduction
Colorectal cancer (CRC) has been considered to be scarcely immunogenic, but recently it has been reported that CRCs express tumor associated antigens (TAAs) that can trigger immune response [Citation1]. Dendritic cells (DCs), as the main antigen-presenting cells (APCs), take part in the anti-tumor immune reaction [Citation2,Citation3].
In humans, DCs are classified into myeloid or conventional (cDCs), plasmacytoid (pDCs), monocyte-derived DC (mo-DCs) and Langerhans cell subtypes [Citation2,Citation4]. The former two types exist in the steady state and the latter participate in inflammation [Citation5–7]. The first subtype of cDCs is CD141+ DC (cDC1), the cross-presenters [Citation8,Citation9]. The cDC1s express CD11c, HLA-DR, XCR1, CD141, CLEC9A, and are the rarest subset of DCs in human tissues, while they are the main APCs in realizing the immune response in cancer [Citation8]. Human cDCs also include the CD1c+ (cDC2) subtype subtype that secrete high amounts of IL-12 and prime CD4+ T cells through MHC class II and stimulate Th17 cell recruitment in cancer [Citation6,Citation7,Citation10]. Up till now cDC2 are known to express CD11c, HLA-DR, CD1c and CD1a in humans [Citation7]. The pDC subset together with cDCs are able to synergize the triggering of the anti-tumor immune response [Citation11]. They are localized mainly in lymphoid organs and stimulate the recruitment of FoxP3+ T regulatory cells (Tregs) in the tumor microenvironment (TME) maintaining the immune suppression [Citation12]. The pDCs can behave as APCs, but are not so efficient as the cDCs, and in some conditions act as regulatory or tolerogenic DCs [Citation12,Citation13]. Mo-DCs originate from monocytes in the inflammatory environment and express CD11c, HLA-DR, CD1a, CD1c, CD205, CD209, and CD11b [Citation7]. Mo-DCs present tumor antigens to CD8+ T cells and polarize CD4+ T cells to Th1, Th2, and Th17 type [Citation14,Citation15].
The CD1a+ immature DCs capture tumor antigens, engulf them via endocytosis and mature in their way to regional lymph nodes (LNs) [Citation1,Citation16]. Mature DCs polarize T helper cells in LNs and in the tumor tissue of CRC where high levels of CD11c+ DCs have been detected [Citation17]. Conceivably, cells of the TME through the secretion of different factors like TGF-β, IL-10 and stimulation of the expression of indoleamine 2,3-dioxygenase (IDO), iNOS, and arginase can convert cDCs into tolerogenic DCs in order to promote tumor progression [Citation3,Citation18,Citation19].
Microsatellite instability (MSI) is characterized with highly immunogenic tumor phenotype and abundant lymphocytic infiltrates [Citation20]. MSI is developed due to defective DNA mismatch-repair (MMR) and is a characteristic of the hereditary Lynch syndrome. In addition, MSI due to the hypermethylation in the promoter CpG islands of MMR genes, mainly MLH1, is found in about 15% of sporadic CRC [Citation21].
The MSI reported in CRC can be MSI-low (MSI-L) and MSI-high (MSI-H) phenotypes [Citation22,Citation23]. The MSI-H phenotype is determined as instability observed in two or more of five markers (BAT 25, BAT26, D2S123, D5S346, and D17S250) detected by PCR, and MSI-L phenotype is defined when there is a defect in only one marker [Citation23]. The hypermutated (MSI-H) cancers show accumulation of frame-shift mutations and synthesis of neoantigens with many antigenic epitopes that make the MSI CRCs more immunogenic [Citation24]. It has been reported that the elevation in the numbers of CD3+, CD8+, CD45RO+ and T-bet+ T lymphocytes associates with MSI CRCs [Citation21]. Increased expression of CD3+, CD8+, CD68+ cells, and up-regulation of programmed death-ligand 1 (PD-L1) on tumor cells are established in Lynch syndrome-associated tumors [Citation24]. CRC patients with MSI present higher levels of CD4+ and CD8+ T cells than microsatellite stable (MSS) tumors [Citation25].
In the present study, we have investigated the correlations of DC markers such as CD1a for immature DCs, CD83 for mature DCs, CD11c for conventional DCs and CD123 for plasmacytoid DCs with MSI/MSS status of CRC patients and analyzed the possible role of those cells as prognostic factors for survival of patients with CRC. Thus, the immunohistochemical DC markers can be used as obligatory feature of microsatellite instability and can be applied as predictors for patients’ outcome.
Subjects and methods
Ethics statement
Institutional review board statement
This work was approved by the Ethics committee at Medical Faculty, Trakia University, Stara Zagora, Bulgaria (Protocol № 9/15.05.2019 and Protocol 18/15.04.2022).
Informed consent statement
Written informed consent forms were obtained from all participants before the surgical therapy and enrollment in the study.
Study population
This study included patients who underwent surgery for primary CRC at the Department of Surgery, University Hospital Prof. St Kirkovich, Stara Zagora, from 1996 and were followed up until April 2021. The inclusion criteria for recruiting the patients into the study are: (1) availability of tumor biopsies; (2) the pathological assessment of primary colorectal cancer. The exclusion criterion is (1) neoadjuvant therapy. A total of 258 patients, 151 males and 107 females, with mean age of 64.80 ± 10.32 years (SEM, standard error of the mean) between 35 and 96 years of age, were recruited in the study. One hundred and four of the patients were also analyzed for MSI in a previously published work concerning the intratumoural expression of IL-6/STAT3, IL-17 and FOXP3 immune cells in CRC [Citation26].
Demographic and clinical data of all of the patients, such as gender, age, localization, pTNM stage, and histological data of differentiation grade, histological type [inflammatory infiltrate in the invasive front (IF, tumor border)], and MMR status are presented in .
Table 1. Demographic, clinical, and histological parameters of the patients with colorectal cancers included in this study.
Complete clinical data including survival rates are available from the oncological records for 248 patients. At the end of the follow-up period, 106 patients were still alive. The median survival period for all patients was 55.74 months, ranging from 0.43 to 183.16 months
Laboratory methods
Routine histochemical staining
Formalin-fixed paraffin-embedded tumor samples were stained with hematoxylin and eosin to identify specific areas, including IF, without necrosis and extensive mucin pools. The evaluation was performed by an experienced pathologist (M.G.).
Immunohistochemistry
The procedure was performed as described previously [Citation16]. In short, formalin-fixed paraffin-embedded tumor tissue samples cut to 4 μm thickness were processed as follows: sections were dewaxed in xylenes at 56ᵒ C for 1 h, and were rehydrated in alcohol and deionized water. The avidin-biotin-peroxidase complex technique was used. The primary antibodies used are given in . The detection system was EnVision®TM FLEX + System, HRP K8002 (Dako North America, Inc., Carpinteria, CA, USA). The reaction was visualized by a mixture of 3,3′–diaminobenzidine (DAB) (Sigma, St. Louis MO, USA). The sections were counterstained by Mayer’s hematoxylin. Negative controls were elaborated using PBS instead of primary antibodies.
Table 2. Antibodies used for IHC analyses, the applied dilutions and the company producers.
Assessing of immunohictochemical staining
Cell counting: CD1a+, CD83+, CD11c+ and CD123+ dendritic cells, as well as IL-6+ and CD8+ immune cells were counted in the tumor stroma (TS) and in the invasive front (IF), on 5 fields of vision in the areas with most intense cellular infiltrates (hot spots) at a magnification of (x 320, 0.74 mm2 area). The expression of MUC2 and MUC5AC was made semiquantitatively by MUC staining of tumor glands. The microscope used for cell counting was Leica DM2500 (Leica Microsystems, Germany).
MSI screening status
DNA isolation: Genomic DNA was obtained after dewaxing and rehydratation of 4–6 μm thick paraffin sections from tumor tissue (without necrosis) and from normal colon mucosa adjacent to the tumor. Two methods were applied: (1) the standard technique with proteinase K digestion followed by phenol-chloroform-isoamyle alcohol extraction and absolute ethanol precipitation of DNA and (2) a DNA extraction kit (NucleoSpin Tissue, Macherey-Nagel, Germany, Cat.No 740952.50), based on the proteinase K digestion followed by silica column filtration and collection of DNA. Extracted DNA was stored at −80 °C until further use. The concentration of genomic DNA was measured spectrophotometrically at 260 nm by NanoVue Spectrophotometer (GE Healthcare, Little Chalfont, UK). The ratio of absorptions at 260 versus 280 nm was calculated to assess the purity of DNA samples.
DNA MSI analysis: A set of five polymorphic microsatellite markers, BAT26 (poly-A mononucleotide repeats), D2S123 (poly-AC dinucleotide repeats), D5S346 (poly-CA dinucleotide repeats), D18S35 (poly-CA dinucleotide repeats), and FGA (tetra-nucleotide repeats), were analyzed for MSI as described before [Citation27]. The microsatellite markers were amplified from both normal and tumor tissue DNA samples and were analyzed via an automated fluorescence sequencer (ABI3130XI, Applied Biosystems). The presence of MSI was defined by the appearance of different alleles in the tumor DNA when compared to the corresponding normal DNA. When one or more microsatellite markers/loci demonstrate alterations, the specimen was considered MSI, and when there were no alterations in the analyzed loci, the specimen was considered MSS [Citation27–29].
Immunoihistochemistry for MMR proteins: Immunohistochemistry procedure was performed as described above with primary anti-human mouse (against MLH1 and MSH2) and anti-human rabbit (anti-MSH6 and PMS2) monoclonal antibodies (). MSI was evaluated as previously reported [Citation30–33]. Probes that lack nuclear staining of lymphocytes, some stromal cells or the nuclei of adjacent normal epithelial cells were considered uninformative [Citation30,Citation31]. When there was any nuclear staining in tumors, even patchy, the probe was interpreted as positive. When there was absolute lack of nuclear staining in tumors, the probe was considered negative [Citation29,Citation31]. A positive MSI screening status was evaluated when tumor cell nuclei lack one or more of the proteins MLH1, MSH2, MSH6, and PMS2. MSS status was defined when tumor cellular nuclei were positive for all four markers. We compared the data from MSI analysis and immunohistochemistry for MMR proteins and established similarity in almost all compared probes (data not shown). In a few cases where discrepancy appeared, we determined the status on the basis of the DNA analyses as a more sensitive method.
Statistical analysis
Statistical analysis was performed using SPSS v16.0 (SPSS, Inc.). The descriptive data, including the mean, standard error of the mean (SEM) and median, were assessed. Kolmogorov-Smirnov’s test and Shapiro-Wilk W-test were used to analyze the normality of the continuous variables. Variables with non-normal distribution were compared by using Mann-Whitney U test. The frequencies of the qualitative (categorical) variables were determined in 2 × 3 and 2 × 2 cross-tables and were evaluated using the χ2 test. Fisher’s exact test was used as appropriate (when the expected numbers of at least one of the cells of 2 × 2 cross-tables are small). The correlations between the quantitative variables were evaluated using Pearson or Spearman’s test according to the distribution (normal or skewed, respectively).
Cumulative survival curves were drawn using the Kaplan-Meier method, and the differences in survival were calculated using the log rank test. The prognostic significance of various factors regarding patient survival after surgery was determined by univariate and multivariate Cox regression analyses. Differences were considered statistically significant at the level of p < 0.05.
Results
Dendritic cells are more numerous in the invasive front compared to the tumor stroma
The density of the cells immunohistochemically labeled for the four analyzed markers for DCs is presented as cells/mm2. shows the mean ± SEM, the median values and the range of the number of DCs/mm2 (density) in both the tumor invasive front (IF) and in tumor stroma (TS). As seen in , the number of all investigated DCs was significantly higher in the IF as compared to TS (p < 0.0001, Mann-Whitney U test).
Table 3. Distribution of the DCs labeled immunohistochemically for CD1a, CD83, CD11c, and CD123 cell markers in tumor stroma (TS) and invasive front (IF) of biopsies of primary CRCs.
We observed weak or moderate positive correlations between the DCs labeled with all 4 markers both in the TS, as well as in the IF (). Only the correlation between CD1a + and CD11c + DCs in the IF was not significant. In addition, in the IF, the number of CD1a + cells correlated also with the number of IL-6+ cells, while the number of CD11c + DCs, as well as the number of CD123+ DCs correlated significantly with the number of CD8+ T lymphocytes (). In the TS, significant positive correlations were seen between the CD83+ and CD123+ DCs with IL-6+ cells, but not with CD8+ T cells ().
Table 4. Correlations between the density of DCs expressing the studied markers, as well as of DCs with IL-6+ or CD8+ cells in tumor stroma (TS) and invasive front (IF) of biopsies of primary CRCs.
Immature CD1a + and mature CD83+ DCs prevail in the tumor tissue of MSI patients
Successful assessment of MSI was performed for 178 patients with CRCs (). Among them, 66 (37.1%) showed at least one altered microsatellite locus or lack of IHC staining of at least one of the studied MMR proteins and were classified as MSI tumors.
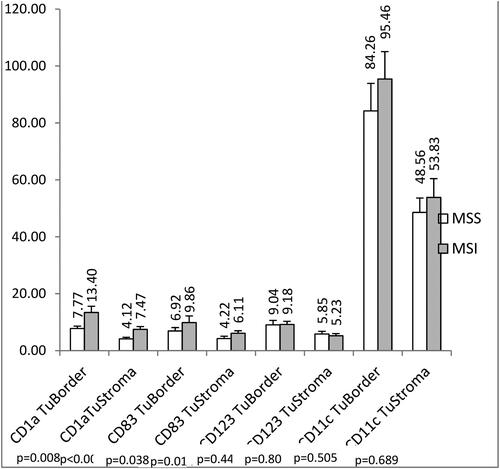
CD1a+ DCs (). CRC patients with MSI in the whole group (n = 66) had significantly higher infiltration with CD1a+ DCs in TS as compared to CRC patients with MSS (7.47 ± 0.98 (SEM) cells/mm2 for MSI vs. 4.12 ± 0.54 cells/mm2 for MSS, p < 0.0001, Mann-Whitney U test) (). The same significant relation was observed for the CD1a+ DCs in the IF (13.40 ± 2.17 (SEM) cells/mm2 for MSI vs. 7.77 ± 0.82 cells/mm2 for MSS, p = 0.008) ().
Figure 1. Immunohistochemically labeled DCs in CRC biopsies: CD1a + DCs (200x magnification) (a); CD83+ DCs (200x magnification) (b); CD123+ DCs in CRC (100x magnification) (c); CD11c+ DCs in CRC (100x magnification) (d) (IF: invasive front; TS- Tumor stroma); scale bars = 100 µm (a, c); 200 µm (b, d).
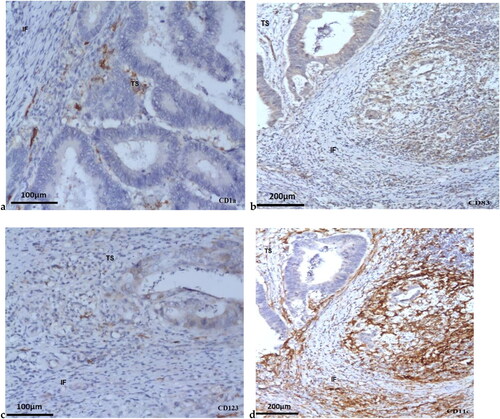
Figure 2. Density (cells/mm2) of the CD1a+, CD83+, CD123+, and CD11c+ DCs determined by IHC in tumor biopsies form patients with MSI and MSS CRC. Data are presented as means ± SEM, and the differences between the mean ranks were assessed by Mann-Whitney U test.
When patients were divided into subgroups according to the pTNM stage, the differences remained significant for TS and IF both for patients in early stage (stage II), as well as for patients with advanced cancers (stage III/IV). The patients with MSI in tumor stage II had significantly more CD1a+ DCs in TS (8.23 ± 1.23 (SEM) cells/mm2 vs. 4.85 ± 0.76 cells/mm2, p = 0.002) and in the IF (14.31 ± 2.83 cells/mm2 vs. 8.53 ± 1.04 cells/mm2, p = 0.050) as compared to stage II MSS patients ().
Figure 3. Density (cells/mm2) of the CD1a+ DCs determined by IHC in tumor biopsies between CRC patients with early pTNM stage (II stage) and with advanced pTNM stages (III/IV stage). Data are presented as means ± SEM, and the differences between the mean ranks were assessed by Mann-Whitney U test.
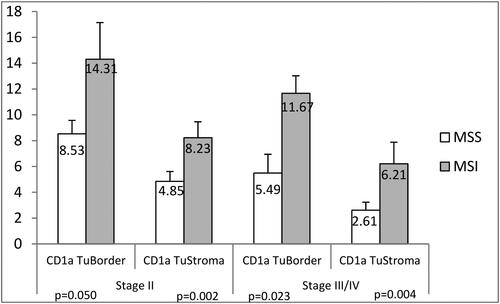
Similarly, patients with advanced cancer stages (stage III/IV) with MSI status had higher CD1a+ DCs both in the TS (6.21 ± 1.67 (SEM) cells/mm2 vs. 2.61 ± 0.62 cells/mm2, p = 0.004), and in the IF (11.67 ± 1.35 (SEM) cells/mm2 vs. 5.49 ± 1.45 cells/mm2, p = 0.023) compared to the patients with MSS status ().
CD83+ DCs (). CRC patients with MSI had significantly higher infiltration with CD83+ DCs in TS as compared to CRC patients with MSS (6.11 ± 0.87 (SEM) cells/mm2 for MSI vs. 4.22 ± 0.82 cells/mm2 for MSS, p = 0.014) (). A similar trend was observed for the CD83+ DCs in the IF (9.86 ± 2.30 (SEM) cells/mm2 for MSI vs. 6.92 ± 1.19 cells/mm2 for MSS, p = 0.038) ().When the patients were divided into two groups according to the stages (early stage: stage II and advanced stages: stage III + IV), the observed differences in the density of CD83+ DCs between MSI and MSS tumors remained significant only for the cells in the TS and among the patients with stage II (6.87 ± 1.13 (SEM) cells/mm2 vs. 3.83 ± 0.66 cells/mm2, p = 0.008). Although the cell density was higher in the IF of MSI as compared to MSS samples of stage II patients (8.73 ± 1.34 (SEM) cells/mm2 vs. 6.07 ± 1.03 cells/mm2, p = 0.053), this difference was non-significant (p = 0.053). In advanced stages, no differences were obtained in the numbers of CD83+ DCs between the MSI and MSS samples either in the TS (p = 0.354) or in the IF (p = 0.185).
Myeloid CD11c+ is higher in numbers in tumor tissue of MSI patients
The number of plasmacytoid CD123+ DCs was low in TS and IF and the CD123+ DCs counts were almost equal in MSI and MSS patients ( and ).
CRC patients with MSI showed higher, but not significant infiltration with CD11c+ DCs in TS as compared to MSS patients (53.83 ± 6.60 (SEM) cells/mm2 for MSI vs. 48.56 ± 6.60 cells/mm2 for MSS, p = 0.689) and in IF (95.46 ± 9.61 (SEM) cells/mm2 for MSI vs. 84.26 ± 9.66 cells/mm2 for MSS, p = 0.505) ( and ),
MSI characteristics—localization and some pathological parameters
When we analyzed the frequency of MSI in different localizations of primary CRC, we observed that the carcinomas of right colon were MSI in 53.3% of the cases (16/30); the carcinomas in transversal colon were MSI in 61.5% of the cases (8/13); the carcinomas in the left colon were MSI in 43.5% of the cases (20/46), while in the rectum carcinomas, were only 26.8% of the cases were MSI (19/52) (p = 0. 017, chi2 test).
Although only with a borderline trend (p = 0.096, chi2 test), we observed a logical association of the MSI/MSS status with the pathological forms. We found that the gelatinous cancers were more frequently MSI (71.4%, 5/7), compared to the low differentiated ones (48.5%, 16/33), those with moderate differentiation (34.7%, 42/121) and especially to the highly differentiated tumors (22.2%, 2/9).
MUC5AC positivity was observed in 41.1% of MSI cancers as compared to MSS cancers (27.7%, p = 0.153, Fisher’s Exact test), while no obvious difference was seen for the MUC2 positivity in MSI (66.1%) and MSS (59.6%) cancers (p = 0.496). When both MUC positivity were combined, again MSI tumor were positive more frequently (71.4%, 40.56), although not significantly, than MSI tumors (59.6%, 28/47, p = 0.206).
Survival analysis
To assess the factors that might influence the survival of the patients with CRC, we performed the Log-rank test and drew Kaplan-Meier curves. The patients were followed-up until April 2021 and the survival after the surgical therapy until the end of the follow-up period or death was calculated and included in the analyses. The mean survival period of the patients was 64.52 ± 3.19 (SEM) months (median of 55.74 months, range 0.43–183.16 months) (). At the end of the follow-up period, 106 out of 247 patients (42.19%) were alive.
There was no association between the survival after the diagnosis and the MSI/MSS status of the carcinomas (p = 0.426, Log rank test) (). However, as we expected, there were significant associations with the standard clinical and histological parameters, such as age (≤median of 66 years vs. >66 years, p = 0.017), pTNM stage of disease (Stage I/II vs. III/IV, p < 0.0001), histological type (I/II vs. III/IV, p < 0.0001), inflammatory infiltrate (no/weak vs. moderate/strong, p = 0.001) and differentiation (gelatinous/low differentiation vs. moderate/high differentiation, p = 0.012) ().
Figure 4. Kaplan-Meier survival curve of the patients with CRCs according to the MSI/MSS status of the cancers. The significance of the difference is assessed with Log-rank test. p = 0.426.
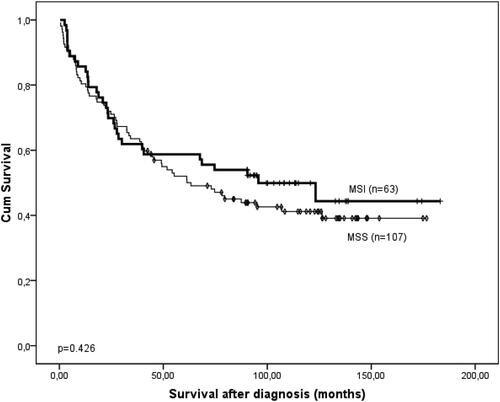
Table 5. Single factorial (univariate) and multifactoral (multivariate) Cox proportional analysis of the survival of patients with CRC.
For evaluation of the association of DC infiltration with the survival, the patients were dichotomized into groups according to the mean values of the density of CD1a+, CD83+, CD11c+ and CD123+ DCs in tumor stroma (TS) or in the invasive front (IF).
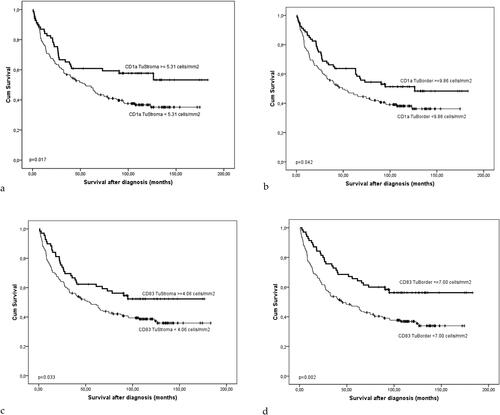
We found that the patients with higher infiltration of CD1a+ and CD83+ DCs both in the TS and in the IF had significantly longer survival than those with less pronounced DCs infiltration (p = 0.017 for CD1a in TS; p = 0.042 for CD1a in IF; p = 0.033 for CD83 in TS; p = 0.002 for CD83 in IF) ().
Figure 5. Kaplan-Meier survival curve of the patients with CRCs according to the density (cells/mm2) of CD1a+ (A and B) and CD83+ DCs (C and D) in the TS (A and C) and tumor border, IF (B and D). The significance of the difference is assessed with Log-rank test (A: p = 0.017; B: p = 0.042; C: p = 0.033; D: p = 0.002).
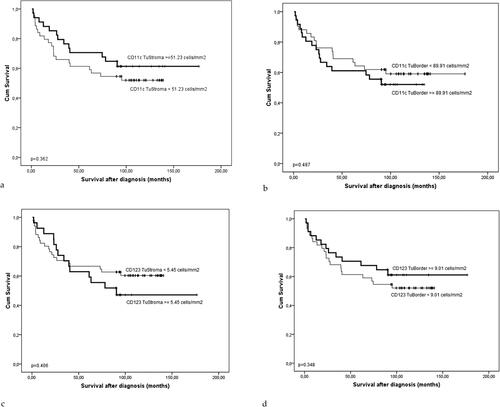
A similar trend, although not statistically significant, was observed for the CD11c+ DCs in TS (p = 0.362) and for the CD123+ DCs in the IF (p = 0.348) (). Interestingly, there was a tendency for the opposite effect of 11c+ DCs in the IF (p = 0.487) () and CD123+ DCs in the TS (p = 0.406) ().
Figure 6. The Kaplan-Meier survival curve of the patients with CRCs according to the density (cells/mm2) of CD11c+ (a and B) and CD123+ DCs (C and D) in the TS (a and C) and tumor border, IF (B and D). The significance of the difference is assessed with Log-rank test (A: p = 0.362; B: p = 0.487; C: p = 0.406; D: p = 0.348).
When all these associations were stratified for the presence of MSI, they remained significant only for CD83 in TS (p = 0.037), and had borderline tendency for CD1a+ and CD83+ DCs in TS (p = 0.093 and p = 0.077, respectively) and for CD1a+ DCs in the IF (p = 0.052).CRC patients with MSI having higher numbers of CD11c+ DCs in TS had longer survival, although not significantly, as compared to those with lower CD11c+ DCs numbers (p = 0.095).
The Cox univariate analysis demonstrated that several demographic, clinical and histological parameters could have significant adverse effects on the survival of patients with CRC. These included advanced age (age above 66 years, p = 0.017), advanced pTNM stage (stage III = IV, p < 0.0001), the gelatinous or weak differentiation (p = 0.012), weak or absence of inflammatory infiltrate (p = 0.001) and histological type III or IV (p < 0.0001) (). The lower level of CD1a+ and CD83+ DCs both in IF and TS were also unfavorable prognostic factors for survival of patients with CRC ().
Then all factors that were identified as significant in the univariate analysis were assessed by applying the multivariate Cox’s proportional hazard model. The lower infiltration with CD1a+ DCs in TS (p = 0.039) and CD83+ DCs in IF (p = 0.022) remained as independent unfavorable prognostic factors together with advanced age (p = 0.001), advanced stage (p < 0.0001) and absence or weak inflammatory infiltrate (p < 0.0001) (). All other factors (differentiation and histological type), as well as lower infiltration with CD1a+ DCs in IF and CD83+ DCs in TS lost their significance ().
Discussion
To our knowledge, this is the first study to indicate the presence of increased numbers of immature CD1a+ DCs and of mature CD83+ DCs in the tumor of CRC patients with MSI. The association between increased CD1a+ DC numbers and MSI status was statistically significant, suggesting that elevated DC numbers could be used as an immunohistochemical marker for the presence of microsatellite deficiency. This result has been observed in a group of 178 CRC patients, with successfully determined MSI status and all clinical, morphological and survival data followed up for 55.74 months. We also observed different populations of tumor-infiltrating DCs (CD1a+, CD83+, CD11c+, and CD123+) and we determined that they were associated with CRC progression after resection of the primary tumor. Furthermore, tumor-infiltrating DCs showed positive correlation with CD8+ T cells (anti-tumor DCs) and IL-6+ immune cells (pro-tumor tolerogenic DCs) [Citation15], presenting the complex interrelationship within tumor environment. The CD1a molecule has been widely accepted as a marker of immature DCs [Citation34–38] and recently of cDC2 and of Mo-DC [Citation7]. Our results showed that in CRC patients CD1a+ DCs were the prevailing DCs type in the TS and in the IF in MSI cancers. The number of mature DCs CD83+ was also increased in MSI cancers, especially in those with stage II. What is more, in MSI CRC patients, the CD1a+ DCs counts were higher in advanced tumor stages (III + IV) as compared to MSS patients with advanced stages. Similarly, some authors report that CD1a+ DCs mainly gather in the invasive margin and less in the tumor stroma of CRC patients, but they have been associated with shorter disease-free survival (unfavorable prognosis) [Citation35], and impaired antigen-presentation capacity [Citation39].
Colorectal cancers have been considered to be scarcely immunogenic, but anti-tumor immune responses occur there [Citation1]. Colon tumor antigens trigger DC recruitment, maturation and migration to the regional LN to generate effective Th1 type immune response [Citation16,Citation37,Citation40–42]. Moreover, CRC uses different strategies to escape immune attack and involves defects in DCs [Citation37,Citation43]. It has been reported that tumor milieu from cultured human colorectal tumor samples alters DC maturation [Citation17,Citation44]. The immune response has been reported to be suppressed by some chemokines C-C motif L (CCL2), vascular endothelial growth factor (VEGF), and an inhibition of IL12p70 secretion in DCs has been observed [Citation17]. Moreover, the CD1a expression has been considered to be high when the antigen is encountered and captured, and low when the antigen has been processed [Citation34]. We hypothesize that DC types like Th types have plasticity and change permanently with the continuous alteration of the factors in the TME. Mature DCs (CD83+) are DCs that usually migrate to the regional LN, to present the antigen [Citation45]. It is believed that the numbers of CD83+ DCs decrease with cancer invasion [Citation16,Citation37,Citation45].
In the present study, the increased CD83+ DCs were associated with more immunogenic tumors having MSI, and with early (II) stage tumors. We show that patients with high numbers of CD83+ DCs irrespectively of MSS/MSI status both in the IF and TS have longer survival, as it has been reported for gastric cancer [Citation44] and for colorectal cancer [Citation46]). It has been reported that mature DCs positive for CD83 are also positive for IL-12 and the CD83+ DCs counts decrease in the course of colon tumor progression [Citation46]. On the contrary, some authors show that mature CD83+ DCs in the TS and IF have been associated with vessel invasion and metastases in the surrounding lymph nodes [Citation47]. As a whole, the CD83+ DCs counts are reduced in the tumor tissue of CRC, compared to the normal mucosa [Citation47]. The discrepancies in the results for CD83+ DCs might be due to small numbers of patients in different studies or to various DC numbers in the different parts of the colon [Citation48]. Our observations concern the increased number of CD1a+ and CD83+ DCs in CRCs with MSI as compared to MSS ones.
Our study demonstrated a correlation between DCs and CD8+ T lymphocytes and IL-6+ immune cells and a significant increase in DCs (CD1a+, CD83+, CD11c+ and CD123+) in the invasive margin as compared to intratumoral tissue in all tumors, in agreement with other reports [Citation47,Citation49]. We found that MSI patients had a larger number of CD11c+ DCs in the tumor as compared to MSS patients (although not statistically significant). We show for the first time that patients with MSI that have higher CD11c+ DC numbers in the tumor stroma could show longer survival.
According to recent DC investigations, DCs are two main subtypes: cDCs and pDCs; and cDCs are two subtypes cDC1 and cDC2 with recently added Mo-DCs [Citation50,Citation51]. CD11c is a marker of cDCs, monocytes and macrophages [Citation7,Citation43]. CD123 is a marker of pDCs [Citation1,Citation2,Citation37,Citation52]. DCs positive for CD11c and CD123 have been investigated in 40 CRC patients together with other DC, macrophage and Treg markers [Citation43]. The conclusion is that CD11c+DCs increase in advanced disease, and that CD123+pDCs have been very low. Tumor-infiltrating DCs demonstrate positive correlation with Tregs and are a key factor in the immune response in malignant disease. In experimental colitis in mice, type 1 myeloid DCs (CD11c+CD11b+) make up the largest (40%–45%) population and mDCs increase four-to-five fold in the colon and in mesenteric lymph nodes [Citation53]. These DCs in healthy subjects express low levels of co-stimulatory molecules (CD80, CD86 and CD40); high endocytic activity consistent with immature phenotype, while in colitic mice mDCs show high levels of co-stimulatory molecules and low endocytic activity, presenting the mature DCs [Citation53]. Therefore, these findings suggest similarity between inflammation and the tumor process concerning DC participation in the immune response in colon tissue [Citation51].
A study that investigated CD11c+ DCs using tissue microarray in 85 patients with CRC treated with bevacizumab and in 23 healthy controls showed that CD11c+ DCs show a significant increase in tumor tissue and in the adjacent normal tissue compared to controls [Citation17]. The authors report inhibition of DCs maturation in the tumor or in the bevacizumab conditioned media with enhancing IL-10 secretion and suppressing IL12p70 secretion, and diminishing CD1d expression (an activation marker of mature DCs that present lipid antigens to NKT cells) [Citation54]. CD11c+ DCs have not been associated with patients’ survival. Our results bring some evidence for the possible role of the higher presence of CD11c+ DCs in biopsies of patients with MSI as a marker for better survival. Increased CD11c+ DC numbers have been reported in other tumors like prostate cancer and squamous cell cancer [Citation55]. The number of CD11c+ DCs have been studied in a group of 22 colon and 4 rectal cancers and the results show the monocytic nature of these DCs [Citation56]. Gai et al. (2013) [Citation57] reported increased CD11c+ DCs in 52 CRC samples compared to 20 normal colon mucosa samples. The authors have shown that the number of CD11c+ DCs decrease in tumors with LN metastases. It has been suggested that intratumoral DCs (CD11c+) are mainly immunosuppressive and induce tolerance to cancer [Citation3,Citation57].
Moreover, the frequency of circulating DCs (cDCs and pDCs) and their CD85k antigen related to immunosuppressive and tolerogenic properties have been investigated in peripheral blood by flow cytometry in 26 CRC patients and in 33 healthy controls [Citation1]. The pDCs counts were lower, reportedly, both in terms of absolute values and as a percentage of white blood cells especially in the stage III CRC patients. On the contrary, no significant differences are found in cDC number and percentage in the patients. Only in advanced stages (III + IV), cDCs have shown a marked decrease as absolute number and percentage, explained by the presence of suppressive TME, ensuring tumor-escape mechanisms [Citation1,Citation3,Citation58].
Researchers have supposed that higher CD8+ T cell densities appear in patients with a higher number of frame-shift mutations [Citation59]. It has been generally accepted that DCs in the TME show suppressed maturation with lower expression of co-stimulatory molecules, high endocytic activity and secretion of immunosuppressive cytokines such as IL-10 and reduced IL-12p70 secretion [Citation1,Citation3,Citation37,Citation58]. This fact can explain our finding of elevated CD1a cells in tumor tissue with MSI status. In MSI tumor tissues, the DNA mismatch repair processes are impaired [Citation60–63].
In our study, we investigated the association between some clinico-pathological parameters of CRC patients with the MSI/MSS phenotype, as determined by DNA MSI analysis and by immunohistochemistry. We found that gelatinous cancers were more frequently with MSI (71.4%), compared especially to highly differentiated tumors (29.2%). Mucinous nature of MSI cancers in our study was detected in 71.4% of cases (MUC5AC- or/and MUC2 -positivity), while 59.6% of MSS tumors were with MUC expression. These data are in accordance with earlier reported observations [Citation62,Citation64,Citation65]. It has been shown that MUC2 triggers IL-8 secretion in the large intestine and induces activation of human mo-DCs [Citation65]. Like others [Citation66], we established MUC5AC expression in 41.1% of MSI CRCs. MUC5AC is gastric mucin. In CRCs its expression is correlated with MSI status, but there are not exact data about its association with favorable prognosis. Studies have established that the proximal colon localization prevails in MSI patients, whereas the rectal location is less prevalent, although not statistically significantly, also reported by others [Citation61,Citation62,Citation67].
The prognostic significance of immune cells for CRC and the role of the adaptive immune system in regard to MSI is generalized in a review [Citation20]. Conversely, few studies have been performed on the expression of DCs in CRC [Citation17,Citation43,Citation68]. In a previous investigation, we reported data on 104 CRC patients that show increased numbers of IL-6+, IL-17+ and STAT3+ immune cells in MSS status [Citation26]. Previously, we have also shown that the CC genotype of TGFB1-509CT single nucleotide polymorphism (SNP) has been associated with lower cellular density of CD11c + DCs, whereas the carriers of A-allele genotypes of IL-10-1080A/G SNP have significantly lower CD83+ DCs in CRC patients [Citation69]. Therefore, mature DCs and myeloid cells probably have suppressive activity in CRC patients.
Limitations
The main limitation of the present study is the lack of exhaustive information about the outcome of all enrolled patients and about the type of chemotherapy those patients received. More complex investigations are needed to reveal the true nature of DCs in CRC tissue and to predict patients’ prognosis.
Conclusions
In the present study, for the first time, we show an association of increased numbers of CD1a+, CD83+, and CD11c+ DCs with MSI status in 178 patients. We propose that immature and mature and myeloid DCs are increased in the more immunogenic MSI CRCs, and that their increased numbers could be an immunohistochemical marker for the MMR condition of the cancer. In our CRC patients’ group (258 CRC patients), CD1a+ DCs and CD83+ DCs showed a distinct infiltration pattern in tumor stroma (TS) and invasive front (IF), and prevailed in the latter. Compared with MSS CRCs, the MSI cancer biopsies had significantly higher infiltration with CD1a+ and CD83+ DCs in the TS and IF. Therefore, CD1a+ and CD83+ DCs numbers might serve as an immunohistochemical sign of patients with MSI status of CRCs. Survival analysis revealed that higher CD1a+ and CD83+ DC numbers correlated with longer survival. Cox multivariate analysis showed that lower infiltration with CD1a+ DCs in TS and CD83+ DCs in IF remained an independent prognostic factor for poor outcome for CRC patients.
Author contributions
Conceptualization, MG; Funding acquisition, MG, TV; Methodology, MG, TV, EA; Software, TV, DC; Validation, MG, TV.; Formal analysis, MG, TV, EA. Investigation, MG, TV, EA.; Resources, MG, YY, PC, DC.; Writing – Original Draft Preparation, MG, TV; Writing – review & editing, MG, TV, YY; Visualization, MG, TV, EA, DC; Supervision, MG.; Validation, MG, TV; Project administration, MG, TV.
Informed consent statement
Written informed consents were obtained from all participants before the surgical therapy and enrollment in the study.
Institutional review board statement
This work was approved by the Ethics committee at Medical Faculty, Trakia University, Stara Zagora, Bulgaria (Protocol № 9/15.05.2019 and Protocol 18/15.04.2022).
Disclosure statement
The authors declare no conflict of interest.
Data availability statement
The raw data are available from the corresponding authors upon reasonable request.
Additional information
Funding
References
- Orsini G, Legitimo A, Failli A, et al. Defective generation and maturation of dendritic cells from monocytes in colorectal cancer patients during the course of disease. Int J Mol Sci. 2013;14(11):1–15. doi: 10.3390/ijms141122022.
- Collin M, Bigley V. Human dendritic cell subsets: an update. Immunology. 2018;154(1):3–20. doi: 10.1111/imm.12888.
- Ma Y, Shurin GV, Peiyuan Z, et al. Dendritic cells in the cancer microenvironment. J Cancer. 2013;4(1):36–44. doi: 10.7150/jca.5046.
- Mildner A, Jung S. Development and function of dendritic cell subsets. Immunity. 2014;40(5):642–656. doi: 10.1016/j.immuni.2014.04.016.
- Segura E, Valladeau-Guilemond J, Donnadieu MH, et al. Characterization of resident and migratory dendritic cells in human lymph nodes. J Exp Med. 2012;209(4):653–660. doi: 10.1084/jem.20111457.
- Nizzoli G, Krietsch J, Weick A, et al. Human Cd1c + dendritic cells secrete high levels of Il-12 and potently prime cytotoxic T-Cell responses. Blood. 2013;122(6):932–942. doi: 10.1182/blood-2013-04-495424.
- Lucarini V, Melaiu O, Tempora P, et al. Dendritic cells: behind the scenes of T-Cell infiltration into the tumor microenvironment. Cancers (Basel). 2021;13(3):433. doi: 10.3390/cancers13030433.
- Haniffa M, Shin A, Bigley V, et al. Human tissues contain Cd141hi Cross-Presenting dendritic cells with functional homology to mouse Cd103+ nonlymphoid dendritic cells. Immunity. 2012;37(1):60–73. doi: 10.1016/j.immuni.2012.04.012.
- Jongbloed SL, Kassianos AJ, McDonald KJ, et al. Human Cd141+ (bdca-3)+ dendritic cells (dcs) represent a unique myeloid Dc subset that Cross-Presents necrotic cell antigens. J Exp Med. 2010;207(6):1247–1260. doi: 10.084/jem.20092140.
- Leal Rojas IM, Mok WH, Pearson FE, et al. Human blood Cd1c(+) dendritic cells promote Th1 and Th17 effector function in memory Cd4(+) T cells. Front Immunol. 2017;8:971. doi: 10.3389/fimmu.2017.00971.
- Lou Y, Liu C, Kim GJ, et al. Plasmacytoid dendritic cells synergize with myeloid dendritic cells in the induction of antigen-specific antitumor immune responses. J Immunol. 2007;178(3):1534–1541. doi: 10.4049/jimmunol.178.3.1534.
- Villadangos JA, Young L. Antigen-presenting properties of pasmacytoid dendritic cells. Immunity. 2008;29(3):352–361. doi: 10.1016/j.immuni.2008.09.002.
- Bonaccorsi I, Pezzino G, Morandi B, et al. Drag cells in immunity: plasmacytoid dcs dress up as cancer cells. Oncoimmunology. 2014;3(3):e28184. doi: 10.4161/onci.28184.
- Verneau J, Sautes-Fridman C, Sun CM. Dendritic cells in the tumor microenvironment: prognostic and theranostic impact. Semin Immunol. 2020;48:101410. doi: 10.1016/j.smim.2020.101410.
- Pena-Romero AC, Orenes-Pinero E. Dual effect of immune cells within tumour microenvironment: pro- and anti-tumour effects and their triggers. Cancers. 2022;14(7):1681. doi: 10.3390/cancers14071681.
- Gulubova MV, Ananiev JR, Vlaykova TI, et al. Role of dendritic cells in progression and clinical outcome of Colon cancer. Int J Colorectal Dis. 2012;27(2):159–169. doi: 10.1007/s00384-011-1334-1.
- Michielsen AJ, Noonan S, Martin P, et al. Inhibition of dendritic cell maturation by the tumor microenvironment correlates with the survival of colorectal cancer patients following bevacizumab treatment. Mol Cancer Ther. 2012;11(8):1829–1837. doi: 10.158/535-7163.MCT-12-0162.
- Gulubova M, Manolova I, Cirovski G, et al. Recruitment of dendritic cells in human liver with metastases. Clin Exp Metastasis. 2008;25(7):777–785. doi: 10.1007/s10585-008-9191-1.
- Noubade R, Majri-Morrison S, Tarbell KV. Beyond Cdc1: emerging roles of Dc crosstalk in cancer immunity. Front Immunol. 2019;10:1014. doi: 10.3389/fimmu.2019.01014.
- Deschoolmeester V, Baay M, Lardon F, et al. Immune cells in colorectal cancer: prognostic relevance and role of MSI. Cancer Microenviron. 2011;4(3):377–392. doi: 10.1007/s12307-011-0068-5.
- Boissière-Michot F, Lazennec G, Frugier H, et al. Characterization of an adaptive immune response in microsatellite-instable colorectal cancer. Oncoimmunology. 2014;3(6):e29256. doi: 10.4161/onci.29256.
- Pawlik TM, Raut CP, Rodriguez-Bigas MA. Colorectal carcinogenesis: MSI-H versus MSI-L. Dis Markers. 2004;20(4-5):199–206. doi: 10.1155/2004/368680.
- Sahin IH, Akce M, Alese O, et al. Immune checkpoint inhibitors for the treatment of MSI-H/Mmr-D colorectal cancer and a perspective on resistance mechanisms. Br J Cancer. 2019;121(10):809–818. doi: 10.1038/s41416-019-0599-y.
- Walkowska J, Kallemose T, Jönsson G, et al. Immunoprofiles of colorectal cancer from lynch syndrome. Oncoimmunology. 2019;8(1):e1515612. doi: 10.1080/2162402X.2018.1515612.
- Toor SM, Sasidharan Nair V, Murshed K, et al. Tumor-Infiltrating lymphoid cells in colorectal cancer patients with varying disease stages and microsatellite Instability-High/stable tumors. Vaccines (Basel). 2021;9(1):64. doi: 10.3390/vaccines9010064.
- Gulubova MV, Chonov DC, Ivanova KV, et al. Intratumoural expression of Il-6/Stat3, Il-17 and Foxp3 immune cells in the immunosuppressive tumour microenvironment of colorectal cancer immune Cells-Positive for Il-6, Stat3, Il-17 and Foxp3 and colorectal cancer development. Biotech Biotech Equip. 2022;36(1):327–338. doi: 10.1080/13102818.2022.2072765.
- Vlaykova T, Mitkova A, Stancheva G, et al. Microsatellite instability and promoter hypermethylation of Mlh1 and Msh2 in patients with sporadic colorectal cancer. J Buon. 2011;16(2):265–273. PMID: 21766496.
- Kawakami H, Zaanan A, Sinicrope FA. Microsatellite instability testing and its role in the management of colorectal cancer. Curr Treat Options Oncol. 2015;16(7):30. doi: 10.1007/s11864-015-0348-2.
- Fujiyoshi K, Yamaguchi T, Kakuta M, et al. Predictive model for High-Frequency microsatellite instability in colorectal cancer patients over 50в years of age. Cancer Med. 2017;6(6):1255–1263. doi: 10.002/cam4.088.
- Ivanova K, Stoyanov S, Vlaykova T, et al. [Microsatellite instability and survival in patients with endometrial cancer.]. Akush Ginekol (Sofiia). 2016;55(5):21–28. Bulgarian. PMID: 29790711.
- Dahlin AM, Henriksson ML, Van Guelpen B, et al. Colorectal cancer prognosis depends on T-Cell infiltration and molecular characteristics of the tumor. Mod Pathol. 2011;24(5):671–682. doi: 10.1038/modpathol.2010.234.
- Soliman NA, Morsia DF, Helmy NAH. Immunohistochemical expression of MMR proteins with clinicopathological correlation in colorectal cancer in Egypt. Open Access Maced J Med Sci. 2019;7(10):1608–1617. doi: 10.3889/oamjms.2019.357.
- Gunnarsson U, Strigård K, Edin S, et al. Association between local immune cell infiltration, mismatch repair status and systemic inflammatory response in colorectal cancer. J Transl Med. 2020;18(1):178. doi: 10.1186/s12967-020-02336-6.
- Hillenbrand EE, Neville AM, Coventry BJ. Immunohistochemical localization of Cd1a-positive putative dendritic cells in human breast tumours. Br J Cancer. 1999;79(5-6):940–944. doi: 10.1038/sj.bjc.6690150.
- Sandel MH, Dadabayev AR, Menon AG, et al. Prognostic value of Tumor-Infiltrating dendritic cells in colorectal cancer: role of maturation status and intratumoral localization. Clin Cancer Res. 2005;11(7):2576–2582. doi: 10.1158/078-0432.CCR-04-1448.
- Yuan A, Steigen SE, Goll R, et al. Dendritic cell infiltration pattern along the colorectal adenoma-carcinoma sequence. APMIS. 2008;116(6):445–456. PMID: 18754318.
- Legitimo A, Consolini R, Failli A, et al. Dendritic cell defects in the colorectal cancer. Hum Vaccin Immunother. 2014;10(11):3224–3235. doi: 10.4161/hv.29857.
- Yoo HJ, Kim NY, Kim JH. Current understanding of the roles of Cd1a-Restricted T cells in the immune system. Mol Cells. 2021;44(5):310–317. doi: 10.14348/molcells.2021.0059.
- Chandra R, Karalis JD, Liu C, et al. The colorectal cancer tumor microenvironment and its impact on liver and lung metastasis. Cancers (Basel). 2021;13(24):6206. doi: 10.3390/cancers13246206.
- Goc J, Germain C, Vo-Bourgais TK, et al. Dendritic cells in tumor-associated tertiary lymphoid structures signal a Th1 cytotoxic immune contexture and license the positive prognostic value of infiltrating Cd8+ T cells. Cancer Res. 2014;74(3):705–715. doi: 10.1158/0008-5472.CAN-13-1342.
- Kießler M, Plesca I, Sommer U, et al. Tumor-Infiltrating plasmacytoid dendritic cells are associated with survival in human Colon cancer. J Immunother Cancer. 2021;9(3):e001813. doi: 10.1136/jitc-2020-001813.
- Subtil B, Cambi A, Tauriello DVF, et al. The therapeutic potential of tackling tumor-induced dendritic cell dysfunction in colorectal cancer. Front Immunol. 2021;12:724883. doi: 10.3389/fimmu.2021.724883.
- Nagorsen D, Voigt S, Berg E, et al. Tumor-Infiltrating macrophages and dendritic cells in human colorectal cancer: relation to local regulatory T cells, systemic T-cell response against tumor-associated antigens and survival. J Transl Med. 2007;5(1):62. doi: 10.1186/479-5876-5-62.
- Michielsen AJ, Hogan AE, Marry J, et al. Tumour tissue microenvironment can inhibit dendritic cell maturation in colorectal cancer. PLoS One. 2011;6(11):e27944. doi: 10.1371/journal.pone.0027944.
- Kashimura S, Saze Z, Terashima M, et al. Cd83(+) dendritic cells and Foxp3(+) regulatory T cells in primary lesions and regional lymph nodes are inversely correlated with prognosis of gastric cancer. Gastric Cancer. 2012;15(2):144–153. doi: 10.1007/s10120-011-0090-9.
- Inoue Y, Nakayama Y, Minagawa N, et al. Relationship between interleukin-12-expressing cells and antigen-presenting cells in patients with colorectal cancer. Anticancer Res. 2005;25(5):3541–3546. PMID: 16101177.
- Pryczynicz A, Cepowicz D, Zaręba K, et al. Dysfunctions in the mature dendritic cells are associated with the presence of metastases of colorectal cancer in the surrounding lymph nodes. Gastroenterol Res Pract. 2016;2016:2405435–2405437. doi: 10.1155/2016/2405437.
- Morrissey ME, Byrne R, Nulty C, et al. The tumour microenvironment of the upper and lower gastrointestinal tract differentially influences dendritic cell maturation. BMC Cancer. 2020;20(1):566. doi: 10.1186/s12885-020-07012-y.
- Lee H, Lee HJ, Song IH, et al. Cd11c-positive dendritic cells in triple-negative breast cancer. In Vivo. 2018;32(6):1561–1569. doi: 10.21873/invivo.11415.
- Gulubova M. Myeloid and plasmacytoid dendritic cells and cancer: new insights. Open Access Maced J Med Sci. 2019;7(19):3324–3340. doi: 10.889/oamjms.2019.735.
- Gessani S, Belardelli F. Immune dysfunctions and immunotherapy in colorectal cancer: the role of dendritic cells. Cancers (Basel). 2019;11(10):1491. doi: 10.3390/cancers11101491.
- Mathan TS, Figdor CG, Buschow SI. Human plasmacytoid dendritic cells: from molecules to intercellular communication network. Front Immunol. 2013;4:372. doi: 10.3389/fimmu.2013.00372.
- Cruickshank SM, English NR, Felsburg PJ, et al. Characterization of colonic dendritic cells in normal and colitic mice. World J Gastroenterol. 2005;11(40):6338–6347. doi: 10.3748/wjg.v11.i40.6338.
- Reschner A, Hubert P, Delvenne P, et al. Innate lymphocyte and dendritic cell cross-talk: a key factor in the regulation of the immune response. Clin Exp Immunol. 2008;152(2):219–226. doi: 10.1111/j.365-2249.008.03624.x.
- Perez L, Shurin MR, Collins B, et al. Comparative analysis of Cd1a, S-100, Cd83, and Cd11c human dendritic cells in normal, premalignant, and malignant tissues. Histol Histopathol. 2005;20(4):1165–1172. doi: 10.14670/HH-20.1165.
- Håkansson L, Adell G, Boeryd B, et al. Infiltration of mononuclear inflammatory cells into primary colorectal carcinomas: an immunohistological analysis. Br J Cancer. 1997;75(3):374–380. doi: 10.1038/bjc.997.61.
- Gai XD, Li C, Song Y, et al. In situ analysis of Foxp3(+) regulatory T cells and myeloid dendritic cells in human colorectal cancer tissue and Tumor-Draining lymph node. Biomed Rep. 2013;1(2):207–212. doi: 10.3892/br.2012.35.
- Shurin GV, Ma Y, Shurin MR. Immunosuppressive mechanisms of regulatory dendritic cells in cancer. Cancer Microenviron. 2013;6(2):159–167. doi: 10.1007/s12307-013-0133-3.
- Maby P, Tougeron D, Hamieh M, et al. Correlation between density of Cd8+ T-Cell infiltrate in microsatellite unstable colorectal cancers and frameshift mutations: a rationale for personalized immunotherapy. Cancer Res. 2015;75(17):3446–3455. doi: 10.1158/0008-5472.CAN-14-3051.
- Shia J. Immunohistochemistry versus microsatellite instability testing for screening colorectal cancer patients at risk for hereditary nonpolyposis colorectal cancer syndrome. Part I. The utility of immunohistochemistry. J Mol Diagn. 2008;10(4):293–300. doi: 10.2353/jmoldx.008.080031.
- Kim JH, Kang GH. Molecular and prognostic heterogeneity of microsatellite-unstable colorectal cancer. World J Gastroenterol. 2014;20(15):4230–4243. doi: 10.3748/wjg.v20.i15.4230.
- Chang L, Chang M, Chang HM, et al. Expending role of microsatellite instability in diagnosis and treatment of colorectal cancers. J Gastrointest Cancer. 2017;48(4):305–313. doi: 10.1007/s12029-017-9991-0.
- Bai Z, Zhou Y, Ye Z, et al. Tumor-infiltrating lymphocytes in colorectal cancer: the fundamental indication and application on immunotherapy. Front Immunol. 2021;12:808964. eCollection 2021. doi: 10.3389/fimmu.2021.808964.
- Kołos M, Wasążnik-Jędras A, Nasierowska-Guttmejer A. Can the histological type of colorectal cancer determine the carcinogenesis pathway? Pol J Pathol. 2015;66(2):109–120. doi: 10.5114/pjp.2015.53003.
- Shia J, Schultz N, Kuk D, et al. Morphological characterization of colorectal cancers in the cancer genome atlas reveals distinct morphology-molecular associations: clinical and biological implications. Mod Pathol. 2017;30(4):599–609. doi: 10.1038/modpathol.2016.198.
- Betge J, Schneider NI, Harbaum L, et al. Muc1, Muc2, Muc5ac, and Muc6 in colorectal cancer: expression profiles and clinical significance. Virchows Arch. 2016;469(3):255–265. doi: 10.1007/s00428-016-1970-5.
- Karahan B, Argon A, Yıldırım M, et al. Relationship between mlh-1, msh-2, pms-2,msh-6 expression and clinicopathological features in colorectal cancer. Int J Clin Exp Pathol. 2015;8(4):4044–4053.
- McMullen TP, Lai R, Dabbagh L, et al. Survival in rectal cancer is predicted by T cell infiltration of tumour-associated lymphoid nodules. Clin Exp Immunol. 2010;161(1):81–88. doi: 10.1111/j.365-2249.010.04147.x.
- Gulubova M, Aleksandrova E, Vlaykova T. Promoter polymorphisms in Tgfb1 and Il10 genes influence tumor dendritic cells infiltration, development and prognosis of colorectal cancer. J Gene Med. 2018;20(2–3):e3005. doi: 10.1002/jgm.3005.