
Abstract
Polygalacturonase inhibiting proteins (PGIPs) are typical leucine-rich repeat (LRR) proteins that inhibit the activity of polygalacturonase (PG) in pathogens, but their function in promoting to plant stem development has been less studied. In this study, the PGIP gene from Zea mays was cloned and heterologously expressed in Arabidopsis thaliana, and then the plant phenotypes were observed and a set of physiological and biochemical indicators were measured. The results indicate that the ZmPGIP1 protein is expressed both in the cell membrane and cell wall. Our research observed that the heterologous expression of ZmPGIP1 significantly increased the production of lignin, cellulose and hemicellulose in transgenic lines. The stems of transgenic plants also showed a thicker cortical tissue. The increase in lignin deposition observed during histochemical staining suggests that the ZmPGIP1 gene may improve plant mechanical strength. These were tightly associated with the upregulated expression of lignin/cellulose-synthesis genes (C4H, C3H, F5H, PAL1/3, CCR1, CAD1-3/9, CCOMT, MYB58, CESA1/10) to enhance plant cell wall strength in transgenic lines. Our findings provide new perspectives on the growth regulation mechanisms of PGIP proteins in plant cell walls and provide a potential candidate gene for breeding increased disease-resistance and higher cellulose production in plants.
Introduction
Plant cell walls, which are composed of lignin, cellulose, pectin and hemicellulose, are a main defense against biotic and abiotic stresses [Citation1–3]. Pathogenic bacteria have special strategies for circumventing cell walls. Invading bacteria secrete the enzyme polygalacturonase (PG) that cleaves the α-(1-4) linkage between the D-galacturonic acid residues of homogalacturonan polymers. As a result, the middle lamella are dissolved and the cell wall structure as a whole relaxes [Citation4,Citation5]. Many PGIPs, which occur in all plants, have been identified based on conserved protein domains and are encoded by multiple gene families. They also belong to the leucine-rich repeat (LRR) superfamily of proteins which are characterized by tandem repeats with a leucine-containing consensus motif [Citation6]. LRR proteins are ubiquitous in plants and provide a universal recognition surface for protein-protein interactions [Citation7,Citation8]. LRR proteins have been extensively studied for their involvement in plant immune responses [Citation9]. PGIPs typically contain a ten imperfect LRR (LxxLxNxXXLT/SGxIPxxLxxLxxLxxXxLxx) structure Kobe and Kajava [Citation45]. L is a hydrophobic residue (valine, isoleucine or phenylalanine) and X indicates any other amino acid [Citation10].
In a previous study, interactions between the Cynanchum komarovii gene product CkPGIP1 and the N-terminal B1-sheet of Botrytis cinerea PGs rapidly elicited a plant defense response [Citation11]. PGIPs have been identified as having important roles in plant defenses against many taxa of pathogens, including fungi, bacteria, nematodes and even insects [Citation12, Citation13]. Overexpression of AtPGIP1 and AtPGIP2 gene in Arabidopsis thaliana restricts Botrytis cinerea colonization and significantly reduces disease symptoms [Citation14]. Meanwhile, overexpression of PGIP in tomatoes (Lycopersicon esculentum) and tobacco (Nicotiana tabacum) has been shown to improve resistance to B. cinerea infection, and antisense PGIP expression in A. thaliana results in higher susceptibility to infection [Citation15–17]. Moreover, a small family of PGIP genes in rice (Oryza sativa) includes OsPGIP1, which inhibits PGs of Xanthomonas oryzae pv. Oryzicola [Citation18], and OsPGIP2, which shows a repressive effect on the response to PGs of Sclerotinia sclerotiorum [Citation19]. Given these observations, PGIPs are potentially primary factors in anti-pathogen responses. Furthermore, other PGIP genes have been widely identified and shown to be differentially regulated in response to abiotic stresses and floral organ development [Citation20,Citation21].
When resisting the invasion of pathogens, plant cell walls commonly respond at local points of contact between the pathogens and host plant, especially through changes in lignification and cell wall composition. The molecular mechanisms behind this is still unclear, but it may be related to many defense responses, including but not limited to changes in plant hormone metabolism, pathogenesis-related proteins (PRs), secondary metabolites, lignin deposition and cell wall metabolism [Citation1,Citation22,Citation23]. Many PGIP proteins have been reported to function in the plant cell wall, and no known plant species lacks PGIP activity [Citation4]. Therefore, the identification and functional characterization of PGIP genes are important goals for better understanding the molecular basis of plant defense responses and plant-pathogen interactions at the cellular level. Numerous studies have consistently demonstrated the remarkable conservation of the functionality of the PGIP gene throughout evolutionary processes. To further investigate this, we successfully introduced the PGIP gene into A. thaliana, a model organism known for its genetic manipulability and easily observable phenotypic traits.
In this study, we used the model species A. thaliana to examine the function of the ZmPGIP1 gene using cloning and heterologous expression. After biochemical analysis of cell wall composition and micro-observations, genes involved in lignin/cell wall synthesis were compared between wild-type (WT) A. thaliana and transgenic lines. We studied the role of ZmPGIP1 in modifying cell wall composition and structure, and identified it as a good candidate gene for further research on improving plant resistance to pathogens.
Materials and methods
Plant materials and growth conditions
Seeds of Arabidopsis (ecotype Columbia) were surface sterilized with 75% ethanol for 30 s, immersed in 84 Disinfectant Liquid (available chlorine 5.5-6.5%) for 3 min, and then washed in ddH2O four times. Finally, the seeds were laid onto 1% agar containing 0.5 × Murashige and Skoog (MS) medium after 2-day vernalization at 4 °C. The seedlings grown 10 days after planting were transferred to the pots (7-cm diameter × 8.5-cm depth) with soil substrate (peat: vermiculite: perlite, 3:3:1, v/v). Four plants were planted per pot. Control and experimental plants were grown at a stable temperature of 20 °C and with diurnal cycles of 16 h light and 8 h dark with light intensity of 100 µmol m−2 s−1 at the State Key Laboratory for Conservation and Utilization of Subtropical Agro-bioresources (Nangning, Guangxi, China).
Isolation and sequence analysis of ZmPGIP1 gene
Seeds of maize (Zea mays, inbred B73) were derived from our laboratory. In preliminary experiments, ZmPGIP1 (NM_001152797.1) was significantly upregulated in corn leaves at the stage of 5-leaf seedling (unpublished transcriptional data). Maize RNA was extracted from the leaves of corn plants grown 14 days after planting, using the RNAprep Pure Plant Total RNA Extraction Kit (Cat# DP432, TianGen, Beijing, China, https://www.tiangen.com/) following the manufacturer’s instructions. The total RNA was detected using 1% agarose gel electrophoresis (1 × TAE buffer, 120 V for 15 min). The PrimeScript RT reagent kit with gDNA Eraser (Cat# RR047A, TaKaRa, Dalian, China, https://www.takarabiomed.com.cn) was used to transfer the first strand of cDNA following the instruction. Specific primers were designed using the primer software version 5 (). The full-length fragments of ZmPGIP1 gene were amplified by PCR using PrimeSTAR GXL DNA polymerase (Cat# R050A, TaKaRa, Dalian, China, https://www.takarabiomed.com.cn). The PCR mixture contained 10 μL of 5 × PrimeSTAR GXL Buffer, 0.5 µL of each primer, 2 µL of cDNA template (100 ng·µL−1), 1 μL PrimeSTAR GXL DNA Polymerase, 4 µL dNTP Mixture and 32 μL of ddH2O. PCR amplification was cycled at 95 °C for 3 min, followed by 30 cycles of 95 °C for 10 s, 58 °C for 15 s, and 72 °C for 3 min (BioRad, Hercules, CA, USA). The PCR products were sent to Biobios (Shanghai Sangon Biotech Co., Ltd., Shanghai, China, https://www.sangon.com/) for sequencing. A phylogenetic tree of ZmPGIP1 with other known plant PGIPs was constructed by using MEGA9.
Table 1. Gene-specific Primers used for gene expression analysis by quantitative real-time PCR.
Plasmid construction and transformation of ZmPGIP1 in arabidopsis
The cDNA sequence of ZmPGIP1 was cloned to the downstream of the 35S promoter in the pCAMIBA2300 plasmid by digestion with KpnI/XbaI. The expression vector pCAMIBA2300-35S-ZmPGIP1 was verified by sequencing (Shanghai Sangon Biotech Co., Ltd., Shanghai, China, https://www.sangon.com/). Subsequently, this construct was transformed to Agrobacterium tumefaciens GV3101 (The GV3101 strain was preserved in the laboratory) and screened using 50 mg·mL−1 kanamycin/rifampicin at 28 °C. The expression vector pCAMIBA2300-35S-ZmPGIP1, along with the empty vector pCAMIBA2300-35S as a control, was then transformed into Arabidopsis through the floral dip method [Citation24]. The plants were cultured until the plants were mature (T0). T0 seeds of transgenic lines were screened on 0.5 × MS medium containing 50 mg·L−1 kanamycin. Finally, three independent homozygous (T3) transgenic plants were generated after the successive screening of T1/T2 plants. T3 homozygous plants were used for experiments.
PCR and sequencing analysis
Total genomic DNA was extracted from fresh leaves of WT and transgenic plants using the Plant Genomic DNA Kit (Cat# CW0553, CWBIO, Beijing, China). Verifications of ZmPGIP1 in putative transgenic plants were performed by polymerase chain reaction (PCR) using the primers PGIP1-322-Kpnl-F: GGGGTACCATGGCGTCCACCACCCTCCTCG and PGIP1-322-Xbal-R: GCTCTAGATCACTCACTCCACTCCAGGTCCTGGC. The reaction mixture was prepared with 25 μL of 2 × Flash PCR Master Mix (Cat# CW3009M, CWBIO, Beijing, China), 2 µL of each primer, 2 µL of DNA template (500 ng·µL−1) and 19 μL of ddH2O. PCRs were run at 98 °C for 10 s, 55 °C for 5 s, and 72 °C for 30 s for 35 cycles. We used 1.0% (w/v) agarose gels (1 × TAE buffer, 110 V for 25 min) to visualize PCR products and also used Sanger sequencing to confirm the integration of ZmPGIP1 into the genome (Shanghai Sangon Biotech Co., Ltd., Shanghai, China, https://www.sangon.com/). DNA ladders used were DL 2,000 DNA Marker (Cat# 3427Q, TaKaRa, Dalian, China, https://www.takarabiomed.com.cn).
Subcellular localization of the ZmPGIP1 protein
We investigated the subcellular localization of ZmPGIP1 in onion epidermal cells by cloning the complete open reading frame of ZmPGIP1 into a green fluorescent protein (eGFP) expression vector pCAMIBA2300-35S-ZmPGIP1-eGFP, and examining its expression in onions. The transformation vector was introduced into Agrobacterium tumefaciens strain LBA4404 (The LBA4404 strain was preserved in the laboratory) with the freeze-thaw method. Onion leaf epidermises were sterilized by exposing to 75% ethanol for 1 min, followed by 3% NaClO for 5 min, and then rinsed with ddH2O three times. The onion epidermal cells were incubated with a culture of Agrobacterium carrying the 35S-ZmPGIP1-eGFP plasmid for 20 min (OD 600 = 0.6). Acetosyringone (150 μmol L−1) was added to enhance the transformation efficiency. Then onion leaf epidermis was plated for plasmolysis using an MS medium with a high permeation culture concentration and incubated in LD (16 h light/8 h dark) for 16-24 h. Laser confocal microscope (LEICA-TCS-SP8MP, Germany) was used to observe fluorescence.
Stem slice staining and scanning electron microscope observations
Stems from transgenic A. thaliana lines were sliced with blades and then exposed to 5% phenol-phenyl-falion for 1 min for lignin acidification [Citation25]. Lignin of sample surface was stained with HCl-phloroglucinol staining solution (2% phloroglucinol in absolute ethanol, mixed with equal volume of HCl before use), and then the sample surfaces were washed with the distilled water to clear the staining solution, after which the samples were observed with an EOS camera (750D, Canon, Japan).
For paraffin section experiments, stem samples were fixed in FAA solution (60% ethanol: formaldehyde: glacial acetic acid, 18:1:1). The samples were then dehydrated through an ethanol series using 60% ethanol for 4 h, followed by 75% ethanol for 4 h, 85% ethanol for 2 h, 90% ethanol for 2 h, 95% ethanol for 1 h, and finally anhydrous ethanol for 20 min. Subsequently, the samples were immersed in alcohol-benzene for 30 min, xylene for 1 h and paraffin for 4 h. The samples embedded in paraffin were subsequently sectioned at 10 µm thickness using a microtome. The sections were floated in warm water at 45 °C for 10 min, then baked at 55 °C for 30 min to adhere to slides. After baking, the sections were dewaxed in xylene twice for 10 min each, rehydrated in anhydrous ethanol twice for 5 min each, followed by 75% ethanol for 5 min, and then rinsed in running water. The rehydrated sections were briefly dipped into 50%, 70% and 80% ethanol for 8 s each, stained with saffron for 3 h, and finally examined and imaged using a microscope (OLYMPUS, SZ61, Japan).
Fresh stem samples from the A. thaliana were embedded into agar and cut into slices of 0.5 cm sections, and then fixed on a cold bench, quickly placed in a scanning electron microscope (SEM, Thermo FEI Quattro S, Waltham, MA, USA) with an accelerating voltage of 15 Kv for observation.
Ultra performance liquid chromatography (UPLC)
The S/G ratio of each extracted A. thaliana stem tissue was obtained via nitro-benzene oxidation following [Citation26] with a slight modification. For each plant tissue, 10 g was ground in liquid N2. One gram of sample pellets was suspended in 35 mL of 50 mmol L−1 NaCl in 80% ethanol, acetone and methanol and sonicated for 30 min. Samples were then centrifuged at 1920 g for 2 min. We removed the solvent and dried the extract-free A. thaliana material by oven-drying at 50 °C until the sample moisture content was stabilized. Then, 0.02 g of dried samples were loaded into a 50 mL digestion tube and mixed with the addition of NaOH aqueous solution (3 mL; 2 mol·L−1) and nitrobenzene (0.5 mL). The mixture was heated at 180 °C for 1 h in an MARS6 (CEM, USA). After sample cooling and centrifuging at 2400 g for 2 min, the water phase was collected, and it was re-extracted with another 4 mL of ethyl acetate and concentrated with a RV10 basic (IKA, Germany) evaporator at 40 °C. The residue was re-suspended in 1.0 mL of methanol, filtered and analyzed using Ultra Performance Liquid Chromatography (UPLC). UPLC was performed on a Thermo Fisher Syncronis aQ column (50 mm × 2.1 mm, 1.7 μm) and maintained at 40 °C. Vanillin and syringaldehyde were quantified at 280 nm with appropriate standards.
Physiological and biochemical testing
Cellulose content was determined by following the manufacturer’s instructions (Suzhou Grace Biotech Co., Ltd. Cat# G0715W48, Suzhou, China, http://geruisi-bio.com/pro?searchType=1&title1=&title=%E7%BA%A4%E7%BB%B4%E7%B4%A0&sort=hitsorder). In brief, the samples were, respectively, collected from six different plants (Arabidopsis inflorescence stalks), dried under sunlight, and then powdered. A total of 0.02 g of the dry powdered samples were weighted and placed into 10 mL tubes with addition of 0.2 mL extract solution (mixed), and then incubated in water bath at 30 °C for 1 h. After sealing, the mixture was added 5.6 mL ddH2O and placed at 110 °C for 1 h. Cooled samples were centrifuged at 2400 g for 10 min, and the supernatant was taken and placed on ice for testing. The supernatant was diluted 30 times. A volume of 125 µL was extracted from the experimental group, and an equivalent volume of ddH2O was added to the control tube. After that, 250 µL of Reagent 1 was added to both tubes. The mixtures were put in a boiling water bath for 5 min. The absorbance was measured at 620 nm (BioTek™ Epoch Microplate Spectrophotometer; BioTek Instruments, Winooski, VT, USA) after a cooling period.
Measurements of hemicellulose were performed using a Plant Hemicellulose assay kit (Cat# G0716W48, Suzhou Grace Biotech Co., Ltd. Suzhou, China, http://geruisi-bio.com/pro?searchType=1&title1=&title=%E7%BA%A4%E7%BB%B4%E7%B4%A0&sort=hitsorder) according to the manufacturer’s protocol. After centrifuging as previously described, the supernatant was diluted 3 times, 60 µL of diluted supernatant was taken from the experimental group, 60 µL ddH2O was added to the control tube, and 300 µL of Reagent1 was added to both tubes. The supernatant was mixed with 300 µL of the reagent and then boiled in a boiling water bath for 8 min, and the absorbance value was measured at 460 nm after cooling.
Lignin content was detected using acetyl bromide. Dry powered samples (0.5 g) were used to determine lignin content based on the absorption peak of 280 nm after the acetylation of the phenolic hydroxyl group as described by Lin and Dence (2012) [Citation46]. Briefly, 0.5 g of the dry sample was thoroughly ground in the presence of liquid nitrogen. The ground sample was then subjected to a series of washes with 2 mL of anhydrous ethanol, 95% ethanol, 75% ethanol and ddH2O in sequence to remove impurities. The sample was then centrifuged at 6200 g for 5 min. The pellet was placed in an oven at 56 °C for drying. Following drying, the sample was treated with 2 mL of acetyl bromide solution (25% v/v acetyl bromide in glacial acetic acid) and incubated in a water bath at 70 °C for 30 min. The reaction was quenched by adding 1 mL of 2 mol L−1 NaOH, 3 mL of acetic acid and 100 µL of 7.5 mol L−1 hydroxylamine hydrochloride. The mixture was then centrifuged at 2400 g for 10 min. The absorbance of the resulting supernatant was measured at 280 nm.
PG enzyme activity was tested using the Biocat MS2624 Test Kit (Cat# MS2624, Shanghai, China, https://www.shsolarbio.com/shsolarbio-Products-30853457/). The pulp homogenate was prepared by homogenizing 100 mg of plant tissue in a solution composed of Tris-HCl (20 mmol L−1, pH 7.0), cysteine-HCl (20 mmol L−1), EDTA (20 mmol L−1), and Triton X-100 (0.05%) to achieve a concentration of 10% (w/v). The homogenate was centrifuged at 12400 g for 10 min at 4 °C, and the supernatant was used for enzyme assays. Briefly, a 50 µL of supernatant was added to a 96-well plate with a 150 µL of standard reagent and incubated for 2 h at 40 °C. A second standard reagent (250 µL) was then added to all wells, followed by a 5 min incubation at 95 °C. Absorbance was recorded at 540 nm using an Epoch Microplate Spectrophotometer (BioTek Instruments, Winooski, VT, USA). Enzyme activity was defined as the decomposition of polygalacturonic acid per gram of sample per hour at 40 °C, pH 6.0, to produce 1 μmol of galacturonic acid. Each sample was set up in three independent biological replicates.
RNA isolation and quantitative real-time PCR
Total RNA was extracted from about 100 mg of A. thaliana leaves tissues using the Ominiplant RNA Kit (Cat# CW2598S, CWBIO, Beijing, China) following the manufacturer’s protocol. Reverse transcription PCR (RT-PCR) and RT-qPCR analyses were performed as the product manual described. These were performed using total RNA extracted from leaves. RT-qPCR was performed using chamQ Universal SYBR qPCR Master Mix (Cat# Q131-02, Vazyme, China) and a StepOne Real-time PCR System (Applied Biosystems, California, USA). The PCR assay was prepared with a mixture comprising 10 μL of chamQ Universal SYBR qPCR Master Mix (Without ROX), 0.4 μL of each primer, 2 μL of cDNA template (10 ng·µL−1), and 7.2 μL of ddH2O. The PCR protocol was initiated with a pre-denaturation phase at 95 °C for 30 s, succeeded by 40 cycles of denaturation at 95 °C for 10 s, annealing at 60 °C for 30 s, and extension at 72 °C for 30 s. AtACTIN2 was employed as an internal reference for the analysis of specific gene expression. The relative quantification of gene expression was computed utilizing the 2−ΔΔCT method. Three replicates were performed. Primer sequences are provided in .
Statistical analysis
Three independent replications were conducted for all data points. Data were analyzed for significance using one-way analysis of variance (ANOVA) with Tukey tests. Differences were considered statistically significant at the levels of *p < 0.05, **p < 0.01, ***p < 0.001. Statistical analyses were performed using GraphPad Prism version 8.3.
Results
Cloning, phylogenic and expression analysis of ZmPGIP1 in A. thaliana (ecotype columbia)
In preliminary experiments, ZmPGIP1 was identified from transcriptional sequencing of maize leaf meristem tissues (unpublished data). The full-length cDNA sequence of ZmPGIP1 was amplified from inbred line B73, with a total of 999 bp fragments containing an open reading frame (). It encodes a protein that is composed of 332 amino acids and belongs to the LRR protein superfamily. A molecular phylogenetic tree was constructed based on the predicted ZmPGIP1 amino acid sequence and 13 plant PGIP family protein sequences collected from a public database (https://www.ncbi.nlm.nih.gov/), revealing a close relationship with SbPGIP1 (from Sorghum bicolor; Supplemental Figure S1). ZmPGIP1 protein sequences had low similarity with AtPGIP1 (37.57%) (Supplemental Figure S2).
Figure 1. Constitutive expression of ZmPGIP1 in Arabidopsis.
(A) Amplification of the Zea mays PGIP1 gene (ZmPGIP1). M: DL marker 2,000. (B) Structure of the pCAMBIA2300 binary vector harboring ZmPGIP1 under the control of the 35S promoter. 35S, CaMV 35S promoter; KpnI and XbaI indicate restriction sites; KanR, kanamycin resistance gene; LacZa, LacZa expression cassette for blue-white spot screening. (C) PCR identification of T2 transgenic Arabidopsis. M: DL marker 2,000; the other lanes are the transgenic lines #2, #5, #10, #11, #12, #15 (T2 generation). (D) Expression of ZmPGIP1 mRNA in the control and transgenic Arabidopsis lines #2, #11 and #12 (homozygous transgenic lines, T3 generation). The mRNA abundance of ZmPGIP1 in the control line (empty vector) with ACTIN2 as the internal control was set to 1. ACTIN2 is used as a control for normalization. Data are average values ± SD from three independent experiments. Independent-Samples T Test, *P < 0.05.
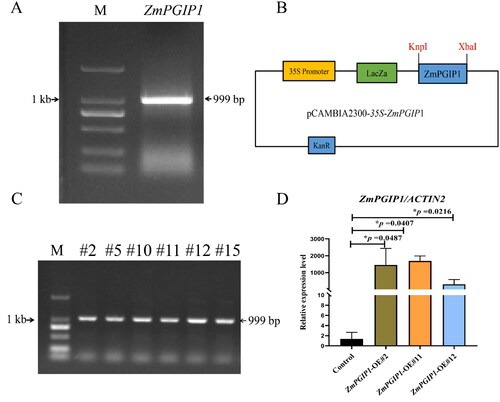
The expression vector of pCAMBIA2300-35S-ZmPGIP1 was constructed () and transformed into A. thaliana inflorescence by Agrobacterium-infected floral dip method. Positive mutants were of a similar growth phenotype and further confirmed via PCR and DNA sequencing (). The transcripts of ZmPGIP1 were confirmed by RT-qPCR amplification in transgenic lines (). T2 plants (#2, #11 and #12) were used for further analysis.
Subcellular localization of ZmPGIP1 protein
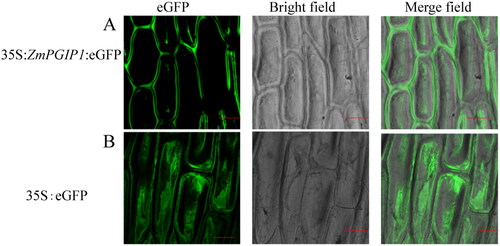
To determine the localization of ZmPGIP1 protein in tissues, the transient expression vector pCAMBIA2300-35S-ZmPGIP1-eGFP was constructed and introduced into the onion epidermal cells. After 16 h of agroinfiltration, a fluorescence signal was clearly observed to be localized at the plasma membrane via transient expression in onion epidermal cells (), while the empty vector of pCAMBIA2300-eGFP was present in all epidermal cells (). These results showed that ZmPGIP1 is localized both in the cell membrane and cell wall.
Figure 2. Subcellular localization of ZmPGIP1 in onion epidermal cells.
(A) Transient expression of 35S:ZmPGIP1:eGFP. (B) Transient expression of 35S:eGFP in onion epidermal cells. eGFP, GFP fluorescence; Merged, merged image of eGFP and bright field. Scale bars = 100 μm. 35S:eGFP as a control.
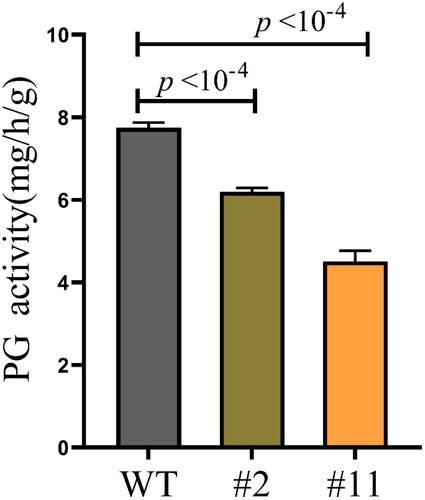
The influence of ZmPGIP1 on PG enzyme activity
PG activity was determined using spectrophotometry for quantitative analyses in WT and transgenic A. thaliana (). Compared to WT plants, PG activity had a decrease by 20% in transgenic line #2 and 37% in transgenic line #11, respectively.
Figure 3. Specific PG enzyme activities of wild-type (WT) and transgenic Arabidopsis.
The seedlings were cultured for 8 weeks. WT, wild type; #2 and #11, ZmPGIP1 overexpression lines; PG, polygalacturonase. Data are means ± SD (n = 10). ***P < 0.001, independent-samples t-test.
Overexpression of ZmPGIP1 increased lignification levels of stem tissues
Lignin deposit was dyed deep-red color using phloroglucinol staining. Overall, brighter staining of cortical cell region and vascular cells was found in transgenic A. thaliana lines (). Large amounts of lignin were deposited in the endodermis of stems (deep-red appearance), and the intensity of staining was considerably higher in transgenic plants than WT plants (). Compared to WT plants, a stronger deep-red staining was observed in the longitudinal profile of transgenic plants, and wider and deeper pigmentation were also observed (). In further observation of the saffron staining of stem tissues, the results of staining were consistent with those of the phloroglucinol staining (). With saffron staining, a positive reaction (pink appearance) in cortical and vascular sclerenchyma cells of controls was observed, and did not occur in controls plants (). This suggests that transgenic plants had a higher lignification level. To further evaluate the impact of lignin composition, the lignin monomers in stem tissues were assayed by liquid chromatography (). A significantly larger amount of guaiacyl (G) and syringyl (S) monomers were released in transgenic plants than in WT plants (). Compared with WT plants, the S/G ratio was increased in transgenic plants, indicating the crucial role of ZmPGIP1 in S/G-lignin biosynthesis.
Figure 4. Microscopic observation of wild-type (WT) and ZmPGIP1-overexpressing Arabidopsis.
(A, D) Phloroglucinol staining in cross-sections of WT and ZmPGIP1-transgenic Arabidopsis. (B, E) Phloroglucinol staining in longitudinal sections of WT and ZmPGIP1-transgenic Arabidopsis. (C) Saffron staining in longitudinal paraffin-embedded sections of wild-type Arabidopsis. (F) Saffron staining in longitudinal paraffin-embedded sections of transgenic Arabidopsis. WT, wild type; Scale bar is 100 µm.
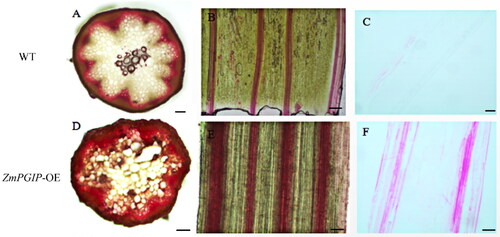
Table 2. Determination of the main G and S monomers released by the lignin of stems of transgenic Arabidopsis.
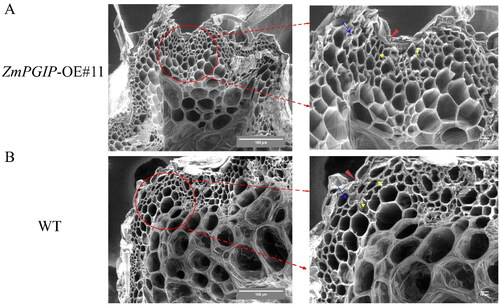
Evidence of stem lignification in ZmPGIP1 lines by scanning electron microscope
To study the effect of ZmPGIP1 on plant xylem at the ultrastructural level, stem cross sections were cut for the observation of scanning electron microscope. The multi-layered parenchyma cells (yellow arrow) and thick cortical tissue (blue arrow) were different around the cortex in transgenic line #11 and WT plants. The primary stem xylem structure also was larger in transgenic line #11 ().
Figure 5. Ultrastructural analysis of wild-type (WT) and transgenic Arabidopsis stems.
(A) Ultrastructural morphology of cell wall of ZmPGIP1 transgenic seedlings. (B) Ultrastructural morphology of cell wall of WT seedlings. Scanning electron microscope images of 8-week-old WT and #11 Arabidopsis stems were used to obverse. #11, ZmPGIP1 overexpression lines. Red arrow, blue arrow and yellow arrow represent cuticle, cortex and parenchyma cells, respectively. Scar bars are 100 µm and 10 µm.
Analysis of cell wall composition and expression of lignin/cellulose synthesis-related genes
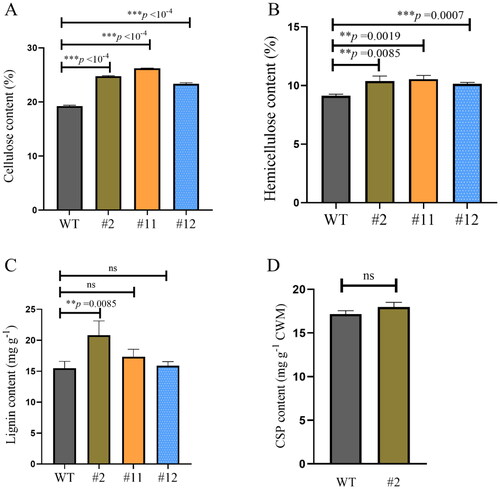
There was 18% cellulose content in WT A. thaliana, and it was increased by 33% in transgenic line #2, 50% in line #12 and 27.8% in line #11 (). Similarly, the hemicellulose content was 9% in WT, and increased by 11.2% to 21.2% in the transgenic lines (). The lignin content was significantly higher in transgenic line #2, but not in lines #11 or #12. The lignin deposition increase was more pronounced in line #2 than in #11 or #12 (). A slightly high accumulation of chelator soluble pectin was observed in line #2, but there was non-significant difference between WT and transgenic line #2 ().
Figure 6. Effect of cell wall components in the wild-type (WT) and heterologous expression ZmPGIP1 transgenic Arabidopsis plants.
(A) Cellulose content in the inflorescence stems from the WT and transgenic Arabidopsis. (B) Hemicellulose content in the inflorescence stems from the WT and transgenic Arabidopsis. (C) Lignin content in the inflorescence stems from the WT and transgenic Arabidopsis. (D) Covalently bonded pectin content in the inflorescence stems from the WT and transgenic Arabidopsis. 5-week-old T3 generation transgenic Arabidopsis plants heterologously expressing the ZmPGIP1 gene were used for analysis. Results represent at least three independent biological repetitions. WT, wild type; #2, #11 and #12, ZmPGIP1 overexpression lines; CSP, covalently bonded pectin. Independent-Samples T Test, *P < 0.05, **P < 0.01, ***P < 0.001, ns represents no significance at P > 0.05.
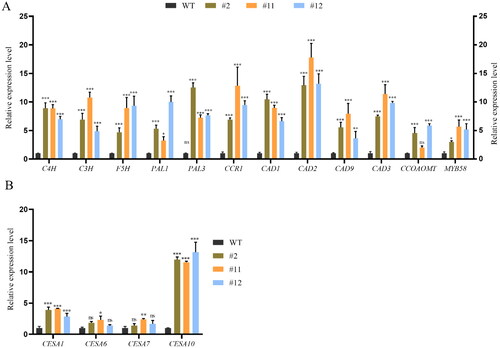
Genes involved in lignin formation were upregulated by 3-20 fold in transgenic plants, including AtC4H (cinnamate 4-hydroxylase), AtCCR1 (cinnamoyl CoA reductase), AtF5H (ferulate 5-hydroxylase), AtPAL1 (phenylalanine ammonia-lyase 1), AtPAL3, AtCCOAOMT (caffeoyl CoA 3-O-methyltransferase), AtC3H (p-coumaroyl shikmate 3-hydroxylase), AtMYB58, AtCAD1 (cinnamyl alcohol dehydrogenase), AtCAD2, AtCAD9 and AtCAD3 (). Meanwhile, genes involved in the cellulose synthesis were associated with secondary cell wall biosynthesis, including AtCESA1, AtCESA10, AtCESA6 and AtCESA7 (). There were no significant differences in expression of AtCESA6 (cellulose synthase A genes) and AtCESA7 between transgenic lines and WT plants, whereas AtCESA1 and AtCESA10 were significantly up-regulated in transgenic lines ().
Figure 7. Quantitative real time RT-PCR to assess core genes involved in lignin and cellulose synthesized-related genes in ZmPGIP1 transgenic Arabidopsis.
(A) Relative transcript levels of lignin synthesized-related genes in WT and transgenic Arabidopsis seedlings. (B) Relative transcript levels cellulose synthesized-related genes in WT and transgenic Arabidopsis seedlings. C4H: Cinnamate 4-hydroxylase, CCR: Cinnamic acylcoenzymea, CAD: Cinnamoyl alcohol dehydrogenase, F5H: Ferulic acid-5-hydroxylation, PAL: Phenylalanine ammonia-lyase, CCOAOMT: Coffee-phthalocyanine coenzyme A-O-methyltransferase, C3H: P-coumaroyl shikimate 3’-hydroxylase, MYB: V-myb avian myeloblastosis viral oncogene homolog, CESA: Cellulose synthases. The expression of the ACTIN2 gene was used as an internal control. Results represent at least three independent biological repetitions. Error bars indicate ± SD. Student’s t-test was used to compare the measurements of OE lines with those from wild type (WT). *P < 0.05, **P < 0.01, ***P < 0.001, ns represents no significance at P > 0.05.
Discussion
Although the orthologues of PGIPs genes play a critical role in plant defenses against pathogens in plant species, such as Nicotiana tabacum, Oryza sativa, Hypericum perforatum and Vitis vinifera [Citation12,Citation27–29], the function of ZmPGIP1 in the regulation of lignification is less well-known in A. thaliana. Here, ZmPGIP1 was cloned from Zea mays and the function of ZmPGIP1 in inhibiting PG activity and regulating the lignification of the cell wall was also identified in A. thaliana.
Characteristic and subcellular localization analysis of ZmPGIP1
A total of 11 genes encoding PGIPs have been reported in corn (https://pubmed.ncbi.nlm.nih.gov/), and the function of ZmPGIP3 has been shown to confer resistance to rice sheath blight by heterologous expression [Citation13]. Sequence analysis showed that ZmPGIP1 shares low similarity with ZmPGIP3 proteins. Phylogenetic analysis suggests ZmPGIP1 is homologous to OsFOR1, a gene that regulates floral organ number in rice [Citation44]. Here, we demonstrated that ZmPGIP1 can substantially alter relevant cell wall components in the absence of pathogenic bacteria in A. thaliana. Like other PGIPs, ZmPGIP1 has a putative signal peptide sequence in the N-terminal region for secretion (http://smart.embl-heidelberg.de/). ZmPGIP1 is composed of a LRRNT-2 domain and many LRR domains. The LRR domains of ZmPIPG1 suggest an indirect signaling role in plant defense against microbial pathogens.
The GFP signal in epidermal onion cells identified ZmPGIP1 as localized to the plasma membrane and cell wall (). Previous studies on transient subcellular localization reported that CkPGIP1 [Citation11] and ZmPGIP3 [Citation13] proteins were also localized to the cell wall or plasma membrane. The subcellular localization of ZmPGIP1 on the plasma membrane further supports it as having a role in defense responses, as many pathogens use the cell surface as an initial recognition and attachment receptor and their toxicity depends on the expression of PG. In addition, the cell wall localization of ZmPGIP1 might also help resist pathogen invasion by activating basal defense responses, such as the accumulation of oligogalacturonides (OGs) due to the PGIP-PG interaction. OGs are general elicitors of plant defense responses [Citation4,Citation30,Citation31].
ZmPGIP1 heterologous expression results in subtle remodeling of A. thaliana cell walls
Previous studies have shown that PGIPs directly interact with pathogen PGs, thereby limiting pathogen growth by inhibiting enzymatic activity and leading to OG accumulation [Citation30]. The molecular mechanisms involved in raspberry fruit ripening, particularly the RiPG interaction with RiPGIP and substrate, were investigated with a structural approach [Citation32]. The present study showed a decrease in PG enzyme activity of stem tissue in transgenic lines, and this was confirmed for ZmPGIP1 line #2 (-20%) and line #11 (-37%, ) using quantifications. This further suggests that ZmPGIP1 probably interacts with PG to inhibit secretion of PG enzymes during pathogenic bacteria invasion.
Cell wall lignification is thought to be a response to pathogenic bacteria [Citation33–35]. Histochemical staining of stems allowed us to examine changes in lignin deposition at the cellular level (). Heterologous expression of the ZmPGIP1 gene in A. thaliana was evident in strong red phloroglucinol-HCl staining in both xylem and interfascicular fiber cells, indicating that significant concentrations of lignin were deposited in these cells. Large differences between transgenic and WT plants were mainly detected in mechanical tissues, such as epidermal sclerenchyma cells (). The sclerenchyma cell wall in the transgenic tissue was thicker than that of WT plants, especially for cells under the epidermal layer. This morphological alteration can be interpreted through two primary hypotheses. Firstly, the thick sclerenchyma cell wall may promote lignification. Secondly, the thick sclerenchyma cell wall might impart increased mechanical strength in the cell wall. These properties of lignin indicate its primary role in alleviating attacks by pathogens. Thus, the increased lignified deposition staining in the transgenic tissues suggests that the secondary cell walls might have increased mechanical strength due to upregulated lignin biosynthesis.
We also observed a range of differences in lignin content and lignin monomer composition between transgenic and WT lines (). Analyses indicated that the total lignin concentrations of the transgenic lines ZmPGIP1-OE#11 and ZmPGIP1-OE#12 were not significantly different, possibly indicating differences in transcriptional levels. This is consistent with the reports of Alexandersson et al. [27], which indicated that Vvipgip1 expression induced the up-regulation of CAD genes, but the differences in total leaf lignin content were not significant. Although the ZmPGIP1-OE#11 and ZmPGIP1-OE#12 transgenic lines did differ significantly in total lignin content, there were significant differences in lignin S monomers content (). Indeed, previous studies have reported that the high levels of S units have been linked to higher resistance to pathogen attacks [Citation23,Citation36]. The increased content of S monomers provides further support for the enhancement of disease resistance in plants by the overexpression of ZmPGIP1.
Plant cell walls are foundations for resisting pathogen infection [Citation37]. Previous work showed that AtPGIP1/2 gene overexpression in A. thaliana significantly limited the symptoms of infection by B. bacillus [Citation14]. PGIP1 overexpression results in subtle cell wall remodeling and alters the accessibility of the arabino-xyloglucan-cellulose network without affecting general cell wall biosynthesis and turnover [Citation16,Citation38]. Our analysis of the cell wall components of transgenic A. thaliana tissues in the absence of threats by pathogens showed that heterologous expression of the ZmPGIP1 affect the composition of secondary cell walls, particularly with the changes in cellulose and hemicellulose. We found that all transgenic lines maintained high cellulose and hemicellulose content compared to the WT plants (). Based on the different appearance of cell wall cellulose and hemicellulose contents in transgenic tissues, it can be assumed that ZmPGIP1 has a positive effect on the development of secondary cell wall.
Cell composition most likely leads to alterations through lignin/cellulose synthesized-related genes
In this study, the heterologous expression of ZmPGIP1 gene in A. thaliana led to the upregulated expression of lignin synthesis-related genes, including AtCCR1, AtPAL1/3, AtCAD1/2/3/9 and AtC4H (). The CAD genes have been demonstrated to be the primary genes involved in lignin biosynthesis, acting as essential components of the defence against virulent and avirulent strains of the bacterial pathogen P. syringae pv. tomato [Citation39]. The related genes of lignin monomer synthesis, including AtCAD, AtF5H and AtCCOAOMT, encode proteins that can catalyze the formation of S monomers, resulting in an increase of S monolignols biosynthsis. Increasing the number of S monomers also implies a promotion of resistance to pathogens [Citation36]. The phenylpropanoid pathway provides precursors for various secondary metabolites, such as the formation of lignin, which are believed to be responsible for an important part of plant defense mechanisms [Citation40,Citation41]. Phenylalanine ammonia lyase (PAL) is a core enzyme in the phenylpropanoid pathway and plays a role in plant disease resistance by regulating lignin biosynthesis [Citation42]. We observed that heterologous ZmPGIP1 led to increased expression of endogenous AtPAL1 and AtPAL3 genes. These findings illustrate that the potentiated activation of the PAL gene in transgenic lines could further enhance the induction of lignin biosynthesis to increase disease resistance. It has been suggested that AtMYB58 transcription factors modulate lignin biosynthesis by binding to specific promoters, thereby enhancing the expression of multiple lignin-related genes. In our study, the AtMYB58 genes were specifically up-regulated in the transgenic lines, indicating that ZmPGIP1 both directly or indirectly affects the synthesis of cell wall lignin and can lead to changes in the metabolism of cell wall components.
Cellulose synthases are involved in the synthesis of primary and secondary cell wall cellulose [Citation43]. Interestingly, 5-15 fold increases in expression of AtCESA1 and AtCESA10 was detected in ZmPGIP1-heterologous plants (). These results suggest that the cell wall structural changes associated with ZmPGIP1 heterologous expression may be due to increased expression of endogenous cell wall remodeling genes. From these patterns, we can infer that ZmPGIP1 may be involved in regulating the growth of plant cell structures and thus mediating related stress response activities. Although ZmPGIP1 could induce extensive changes in the expression of lignin/cellulose synthesis-related genes, these changes are not necessarily involved in ZmPGIP1-mediated antibacterial defense. Future work on the gene family should seek to specifically define the underlying molecular mechanisms that ZmPGIP1 employs in pathogen defense.
Conclusions
ZmPGIP1 has been characterized for the first time in this study. Overexpression of ZmPGIP1 enhanced the accumulation of lignin, cellulose and hemicellulose through up-regulating lignin/cellulose-related genes, and increased the strength of cell wall in transgenic A. thaliana plants. These results suggest that ZmPGIP1 probably plays a vital role in the resistance to pathogen invasion. Therefore, it may be a potential candidate gene for plant pathogen-resistance breeding.
Author contributions
Xian-Wei Fan designed the study, revised the manuscript and acquired funding. You-Zhi Li supervised the project. Juan-juan Xu drafted the manuscript. Jia Zhou, Zheng Cai, and Jin-Liang Sun performed the experiments. Jia Zhou and Juan-juan Xu performed the statistical analyses. All the authors have read and approved the manuscript.
Competing interests
The authors declare that they have no conflicts of interest.
Supplemental Material
Download PDF (518.1 KB)Acknowledgements
We thank Shanghai Sangon Biotech Co., Ltd. for their technical support in Sequencing service.
Disclosure statement
No potential conflict of interest was reported by the authors.
Data availability statement
The data that support the findings of this study are available from the corresponding authors Xian-wei Fan upon reasonable request.
Additional information
Funding
References
- Bacete L, Mélida H, Miedes E, et al. Plant cell wall-mediated immunity: cell wall changes trigger disease resistance responses. Plant J. 2018;93(4):1–14.
- Liu C, Yu H, Voxeur A, et al. FERONIA and wall-associated kinases coordinate defense induced by lignin modification in plant cell walls. Sci Adv. 2023;9(10):eadf7714. doi:10.1126/sciadv.adf7714.
- Wolf S. Cell wall signaling in plant development and defense. Annu Rev Plant Biol. 2022;73(1):323–353. doi:10.1146/annurev-arplant-102820-095312.
- Kalunke RM, Tundo S, Benedetti M, et al. An update on polygalacturonase-inhibiting protein (PGIP), aleucine-rich repeat protein that protects crop plants against pathogens. Front Plant Sci. 2015;6(MAR):146. doi:10.3389/fpls.2015.00146.
- Wang D, Yeats TH, Uluisik S, et al. Fruit softening: revisiting the role of pectin. Trends Plant Sci. 2018;23(4):302–310. doi:10.1016/j.tplants.2018.01.006.
- Cho H, Lee J, Oh E. Leucine-rich repeat receptor-like proteins in plants: structure, function, and signaling. J Plant Biol. 2023;66(2):99–107. doi:10.1007/s12374-022-09374-1.
- D’Ovidio R, Mattei B, Roberti S, et al. Polygalacturonases, polygalacturonase-inhibiting proteins and pectic oligomers in plant-pathogen interactions. Biochimica et Biophysica Acta. 2004;1696(2):237–244.
- Man J, Harrington TA, Lally K, et al. Asymmetric evolution of protein domains in the leucine-Rich repeat receptor-like kinase family of plant signaling proteins. Mol Biol Evol. 2023;40(10):1–16. doi:10.1093/molbev/msad220.
- Chen C, Zhao Y, Tabor G, et al. A leucine-rich repeat receptor kinase gene confers quantitative susceptibility to maize southern leaf blight. New Phytol. 2023;238(3):1182–1197. doi:10.1111/nph.18781.
- Kobe B, Deisenhofer J. The leucine-rich repeat: a versatile binding motif. Trends Biochem Sci. 1994;19(10):415–421. doi:10.1016/0968-0004(94)90090-6.
- Liu N, Ma X, Zhou S, et al. Molecular and functional characterization of a polygalacturonase-inhibiting protein from cynanchum komarovii that confers fungal resistance in Arabidopsis. PLoS ONE. 2016;11(1):e0146959. doi:10.1371/journal.pone.0146959.
- Hou W, Kumar Singh R, Zhao P, et al. Overexpression of polygalacturonase-inhibiting protein (PGIP) gene from hypericum perforatum alters expression of multiple defense-related genes and modulates recalcitrance to Agrobacterium tumefaciens in tobacco. J Plant Physiol. 2020;253(August):153268. doi:10.1016/j.jplph.2020.153268.
- Zhu G, Liang E, Lan X, et al. ZmPGIP3 gene encodes a polygalacturonase-inhibiting protein that enhances resistance to sheath blight in rice. Phytopathology. 2019;109(10):1732–1740.
- Ferrari S, Vairo D, Ausubel FM, et al. Tandemly duplicated arabidopsis genes that encode polygalacturonase-inhibiting proteins are regulated coordinately by different signal transduction pathways in response to fungal infection. Plant Cell. 2003;15(1):93–106. doi:10.1105/tpc.005165.
- Ferrari S, Galletti R, Vairo D, et al. Antisense expression of the Arabidopsis thaliana AtPGIP1 gene reduces polygalacturonase-inhibiting protein accumulation and enhances susceptibility to Botrytis cinerea. Mol Plant Microbe Interact. 2006;19(8):931–936. doi:10.1094/MPMI-19-0931.
- Joubert DA, Slaughter AR, Kemp G, et al. The grapevine polygalacturonase-inhibiting protein (VvPGIP1) reduces Botrytis cinerea susceptibility in transgenic tobacco and differentially inhibits fungal polygalacturonases. Transgenic Res. 2006;15(6):687–702. doi:10.1007/s11248-006-9019-1.
- Powell AL, van Kan J, ten Have A, et al. Transgenic expression of pear PGIP in tomato limits fungal colonization. Mol Plant Microbe Interact. 2000;13(9):942–950. doi:10.1094/MPMI.2000.13.9.942.
- Wu T, Peng C, Li B, et al. OsPGIP1-mediated resistance to bacterial leaf streak in rice is beyond responsive to the polygalacturonase of Xanthomonas oryzae Pv. Oryzicola. Rice (N Y). 2019;12(1):90. doi:10.1186/s12284-019-0352-4.
- Wang Z, Wan L, Xin Q, et al. Overexpression of OsPGIP2 confers Sclerotinia sclerotiorum resistance in Brassica napus through increased activation of defense mechanisms. J Exp Bot. 2018;69(12):3141–3155. doi:10.1093/jxb/ery138.
- Wei Y, Mao Y, Gao Y, et al. The polygalacturonase-inhibiting protein PpPGIP1, positively regulates vacuolar invertase activity via a protein-protein interaction with PpVIN2 in peach fruit. Sci Horticult. 2023;320:112209. doi:10.1016/j.scienta.2023.112209.
- Zhang G, Hou X, Wang L, et al. Photo-sensitive leaf rolling 1 encodes a polygalacturonase that modifies cell wall structure and drought tolerance in rice. New Phytol. 2021;229(2):890–901. doi:10.1111/nph.16899.
- Gholamnezhad J. Plants defense mechanisms against pathogens. 2017;6(2):24–32. doi:10.29252/pps.6.2.24.
- Ma Q, Zhu H, Qiao M. Contribution of both lignin content and sinapyl monomer to disease resistance in tobacco. Plant Pathology. 2018;67(3):642–650. doi:10.1111/ppa.12767.
- Clough SJ, Bent AF. Floral dip: a simplified method for agrobacterium-mediated transformation of Arabidopsis thaliana. Plant Journal. 1998;16(6):735–743.
- Feng X, Xu Y, Peng L, et al. TaEXPB7-B, a β-Expansin gene involved in low-temperature stress and abscisic acid responses, promotes growth and cold resistance in Arabidopsis thaliana. J Plant Physiol. 2019;240:153004. doi:10.1016/j.jplph.2019.153004.
- Zheng M, Gu S, Chen J, et al. Development and validation of a sensitive UPLC-MS/MS instrumentation and alkaline nitrobenzene oxidation method for the determination of lignin monomers in wheat straw. J Chromatogr B Analyt Technol Biomed Life Sci. 2017;1055-1056:178–184. doi:10.1016/j.jchromb.2017.04.034.
- Alexandersson E, Becker JVW, Jacobson D, et al. Constitutive expression of a grapevine polygalacturonase-Inhibiting protein affects gene expression and cell wall properties in uninfected tobacco. BMC Res Notes. 2011;4(1):493. doi:10.1186/1756-0500-4-493.
- Chen X, Chen Y, Zhang L, et al. Amino acid substitutions in a polygalacturonase inhibiting protein (OsPGIP2) increases sheath blight resistance in rice. Rice. 2019;12(1):1–12. doi:10.1186/s12284-019-0318-6.
- Zhang C, Feng C, Wang J, et al. Cloning, expression analysis and recombinant expression of a gene encoding a polygalacturonase-inhibiting protein from tobacco, Nicotiana tabacum. Heliyon. 2016;2(5):e00110. doi:10.1016/j.heliyon.2016.e00110.
- Benedetti M, Pontiggia D, Raggi S, et al. Plant immunity triggered by engineered in vivo release of Oligogalacturonides, damage-associated molecular patterns. Proc Natl Acad Sci U S A. 2015;112(17):5533–5538. doi:10.1073/pnas.1504154112.
- Ferrari S, Savatin DV, Sicilia F, et al. Oligogalacturonides: plant damage-associated molecular patterns and regulators of growth and development. Front Plant Sci. 2013;4:49. (doi: 10.3389/fpls.2013.00049.
- Morales-Quintana L, Monsalve L, Bernales M, et al. Molecular dynamics simulation of the interaction of a raspberry polygalacturonase (RiPG) with a PG inhibiting protein (RiPGIP) isolated from ripening raspberry (Rubus idaeus Cv. Heritage) Fruit as a model to understand proteins interaction during fruit softening. J Mol Graph Model. 2023;122(April):108502. doi:10.1016/j.jmgm.2023.108502.
- Dushnicky LG, Ballance GM, Sumner MJ, et al. The role of lignification as a resistance mechanism in wheat to a toxin-producing isolate of pyrenophora tritici-repentis. Canadian Journal of Plant Pathology. 1998;20(1):35–47. doi:10.1080/07060669809500443.
- Li Q, Qin X, Qi J, et al. CsPrx25, a class III peroxidase in citrus sinensis, confers resistance to citrus bacterial canker through the maintenance of ROS homeostasis and cell wall lignification. Hortic Res. 2020;7(1):192. doi:10.1038/s41438-020-00415-9.
- Takashima T, Komori N, Uechi K, et al. Characterization of an antifungal β-1,3-glucanase from ficus microcarpa latex and comparison of plant and bacterial β-1,3-glucanases for fungal cell wall β-Glucan degradation. Planta. 2023;258(6):116. doi:10.1007/s00425-023-04271-4.
- Cesarino I. Structural features and regulation of lignin deposited upon biotic and abiotic stresses. Curr Opin Biotechnol. 2019;56:209–214. doi:10.1016/j.copbio.2018.12.012.
- Protsenko MA, Buza NL, Krinitsyna AA, et al. Polygalacturonase-inhibiting protein is a structural component of plant cell wall. Biochem Biokhimiia. 2008;73(10):1053–1062.
- Nguema-Ona E, Moore JP, Fagerström AD, et al. Overexpression of the grapevine PGIP1 in tobacco results in compositional changes in the leaf arabinoxyloglucan network in the absence of fungal infection. BMC Plant Biol. 2013;13(1):46. doi:10.1186/1471-2229-13-46.
- Tronchet M, BalaguÉ C, Kroj T, et al. Cinnamyl alcohol dehydrogenases-C and D, key enzymes in lignin biosynthesis, play an essential role in disease resistance in Arabidopsis. Molecular Plant Pathology. 2010;11(1):83–92. doi:10.1111/j.1364-3703.2009.00578.x.
- Hoffmann L, Besseau S, Geoffroy P, et al. Silencing of hydroxycinnamoyl-coenzyme a shikimate/quinate hydroxycinnamoyltransferase affects phenylpropanoid biosynthesis. Plant Cell. 2004;16(6):1446–1465. doi:10.1105/tpc.020297.
- Liu J, Osbourn A, Ma P. MYB transcription factors as regulators of phenylpropanoid metabolism in plants. Mol Plant. 2015;8(5):689–708. doi:10.1016/j.molp.2015.03.012.
- Bate NJ, Orr J, Ni W, et al. Quantitative relationship between phenylalanine ammonia-lyase levels and phenylpropanoid accumulation in transgenic tobacco identifies a rate-determining step in natural product synthesis. Proc Natl Acad Sci U S A. 1994;91(16):7608–7612. doi:10.1073/pnas.91.16.7608.
- Mendu V, Stork J, Harris D, et al. Cellulose synthesis in two secondary cell wall processes in a single cell type. Plant Signal Behav. 2011;6(11):1638–1643. doi:10.4161/psb.6.11.17709.
- Jang S, Lee B, Kim C, et al. The OsFOR1 gene encodes a polygalacturonase-inhibiting protein (PGIP) that regulates floral organ number in rice. Plant Mol Biol. 2003;53(3):357–369. doi:10.1023/b:plan.0000006940.89955.f1.
- Kobe B, Kajava AV. The leucine-Rich repeat as a protein recognition motif. Curr Opin Struct Biol. 2001;11(6):725–732. doi:10.1016/s0959-440x(01)00266-4.
- Wheeler, E.A. (1993). Methods in Lignin Chemistry. S.Y. Lin ‘C.W. Dence (eds.), 578 pp., illus., 1992. Springer Series in Wood Science. Springer Verlag, Berlin, Heidelberg, etc. ISBN 3-540-50295-5. Price DM 480.00 (hardcover).