
Abstract
Dropout is an inevitable event in the RNA sequencing process and it is sometimes mistaken with gene inactivity. Here we compare three sequencing protocols, SMARTer, Smart-Seq and Tang, in terms of their dropout rate using 33 datasets that contain 689 million gene abundance reads. We found that SMARTer has the lowest dropout rate with 64.51% across all its gene abundance reads. Smart-Seq comes next with 72.59% and lastly Tang with 79.90%. Thus, SMARTer has the highest reliability when it comes to detecting gene abundance. Furthermore, the dropout rate among all three sequencing protocols increases ascendingly as the sequencing protocol proceeds further in scanning gene abundance. This suggests that the ability to detect gene abundance drops as the sequencing protocol advances thus reliability decreases.
Introduction
Single-cell RNA sequencing (scRNA-seq) [Citation1–8] is a technique used to detect gene expression at the level of individual cells, contrary to the traditional sequencing method where gene abundance is measured at the level of samples. This allows for a high resolution for measuring abundance which indicates the activation of genes as well as highlights variations among individual cells from the same organism. At first, individual cells are isolated, their nucleic acids are extracted, and amplified, and then a sequencing library is constructed to allow for sequencing and data read afterwards. The quality of this process is affected by the loss and contamination which reflects negatively on the integrity of data.
The importance of scRNA-seq, and RNA sequencing in general, can be viewed in its real-life application such as in gene expression analysis [Citation9–11], where the expression levels of genes are analyzed for new knowledge and abundance quantification; differential expression analysis [Citation12–14], where the level of expression is analyzed for statistically significant differences; profiling of non-coding RNAs [Citation15–17], to identify segments of genes that have no role in the polypeptide production process; diseases research and biomarker identification [Citation18,Citation19], specifically, in detecting cancerous cells [Citation20–23] where an active cell in a cancerous tissue is compared to its counterpair in a healthy tissue. This is related to the association between genotype and phenotype and has an impact on choosing the appropriate treatment for the type of cancer. Moreover, the RNA sequencing procedure does not depend on the species.
Dropout [Citation24–27] in scRNA-seq happens when the sequencing method cannot detect amplified gene abundance so reads are denoted as zeros in the abundance matrix. The cause of the dropout event may be due to three possible reasons: either the gene is truly inactive, the abundance is too low for the sequencing method to read or the method is unstable [Citation28–30]. Regardless of the reason, the reliability of the sequencing method is put into question with the existence of zero reads in the abundance matrix. Thus, the integrity of generated data and data analysis is questionable. Some methods have been introduced to reduce dropout misreading [Citation26,Citation31], although they only improve the quality but do not completely avoid this issue. Some of these methods and tools are used to only distinguish between ‘real’ zeros, where there is no abundance at all, and true dropout.
In this article, we compare three methods [Citation32] that are commonly used for scRNA-seq. These methods are as follows: SMARTer [Citation33]/SMARTer C1 [Citation34], SMART-Seq [Citation35,Citation36]/Smart-Seq2 [Citation37–39] (switching mechanism at the end of the 5′-end of the RNA transcript sequencing) and Tang [Citation40]/Tang2010 [Citation41,Citation42].
Tang is the first method to sequence an RNA of a single cell. The method uses SOLiD [Citation43–45] (Sequencing by Oligonucleotide Ligation and Detection) next-generation DNA sequencing and can generate a massive number (millions) of reads in one run. In all scRNA-seq methods, cells are isolated and their DNA amplified. However, the amplification and library preparation steps are different across all these methods.
The fact that the cause of dropout cannot be precisely identified allows for speculation as to whether the gene of interest is active or not or whether the sequencing method is unstable. As a result, the integrity of the data produced is questionable.
In this article, we will analyze dropout in 33 datasets that include 689 million gene abundance reads from different organisms, different cell types and three different scRNA-seq methods; SMARTer/SMARTer C1, SMART-Seq/Smart-Seq2 and Tang/Tang2010.
Materials and methods
Datasets
The datasets used in this research were imported from the project conquer (Consistent Quantification of External RNA-seq data) repository [Citation46]. These datasets can be found at: https://github.com/markrobinsonuzh/conquer. The project contains single-cell RNA-seq datasets that are consistently analyzed by researchers. includes the selected datasets from the conquer repository.
Table 1. List of selected datasets along with their IDs, organisms where the cells were taken from, a brief description, cell counts and sequencing protocols used as they appear in the conquer repository.
Samples in the datasets were collected from three organisms: Homo sapiens, Danio rerio (zebra fish) and Mus musculus (mouse). The number of cells in the Samples varies; the lowest is 17 and the highest is 3584. The cells were in different stages of development and three sequencing protocols were used: SMARTer, Smart-Seq and Tang.
Each dataset includes an object of two levels: gene and transcript abundance. The gene experiment includes four components: TPM (transcripts per million abundance for each gene), count (gene read counts), count lstpm (length-scaled TPMs) and avetxlength (the average length of the transcripts expressed in each sample). The transcript abundance experiment includes three components: TPM (transcripts per million abundance for each transcript), count (transcript read counts) and efflength (effective transcript lengths).
Some datasets in the original list of conquer were excluded from our test for being either two large to process, such as GSE84465, and causing ‘Error: vector memory exhausted (limit reached?)’, or for not containing TMP (transcripts per million abundance estimates for each gene). In addition, GSE66053-GPL18573 was excluded because it is the only dataset that was obtained using a different protocol (Fluidigm C1 Auto prep protocol).
Method
To access information within the datasets, we first download their MultiAssayExperiment directly from conquer. Using R programming language, we loaded the Summarized-Experiment and MultiAssayExperiment packages (using suppressPackageStartupMessages(library(SummarizedExperiment))) to read the RDS file of each datatset. The file has an ExperimentsList of length two; gene and tx. We chose the gene experiment because it contains TPMs. is an example of a dataframe that represents gene abundance in the EMTAB2805 dataset.
Table 2. EMTAB2805 Dataframe (rows represent genes and columns represent samples).
There were 33 datasets in our experiment. The number of genes in these datasets ranged from 32342 to 65218. The number of samples ranged from 17 to 1529 samples. There was a total of nearly 689 million (671546296) gene abundance reads in the entire datasets combined. These gene abundance reads contain zeros and non-zero reads. The zeros are what we are interested in since they may be a result of dropout events.
Having downloaded all required datasets, we programmatically iterated on the 33 datasets to read their .rds files and obtained experiments(dataset)[[”gene”]], followed by assays()[[”TPM”]] which gave us complete access to the gene abundance reads and allowed to create dataframes containing TPM. We then programmatically scanned all reads to calculate the dropout percentage (the percentage of zero reads out of the total number of reads) in each dataset ().
Table 3. Results of scanning gene abundance reads across all datasets.
The code for processing the datasets, obtaining TMP, and reproducing results has been uploaded into the author’s GitHub account: https://github.com/Omar-Alaqeeli/Dropout-rate.
Results
The results in contain the number of total entries, the number of zeros among the total number of entries, the percentage of zeros out of the total number, and the protocol used. For the datasets with the SMARTer protocol, the percentages of zeros range from 34.61% to 90.15% with a mean of 72.71%. The total number of entries in all these datasets is 340024834, while the number of zeros among these entries is 219353245. That is a 64.51% dropout. For the datasets with the Smart-Seq protocol, the percentages of zeros range from 41.14% to 91.65% with a mean of 79.2%. The total number of entries in all these datasets is 306685312 and the number of zeros among them is 222613550. Thus, the dropout percentage is 72.59%. Lastly, the datasets with the Tang protocol have percentages ranging from 62.01% to 82.15%, with a mean of 68.88%. The total number of all entries in the datasets is 24836150 and the total number of zeros among these entries is 19842965. Therefore, the dropout percentage is 79.90%.
For better visualization, we used Heatmaps to holistically visualize the contrast of expression in genes that were detected by the sequencing protocols ().
Figure 1. Heatmaps for 18 datasets obtained using the SMARTer protocol. The title of each heatmap represents the dataset’s ID, the y-axis denotes samples and the x-axis denotes genes.
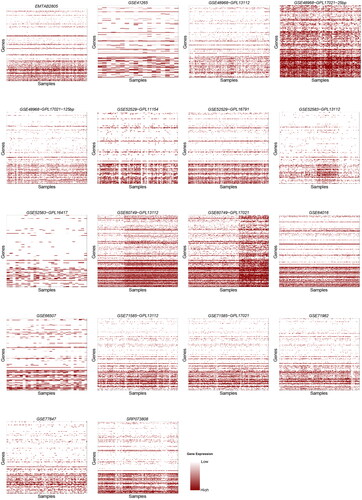
Figure 2. Heatmaps for 11 datasets obtained using the Smart-seq protocol. The title of each heatmap represents the dataset’s ID, the y-axis denotes samples and the x-axis denotes genes. A solid white represents dropout or inactivity of genes.
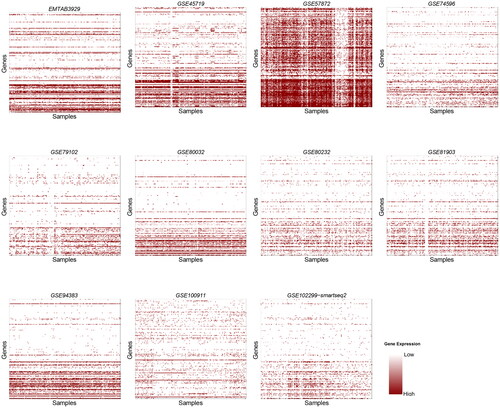
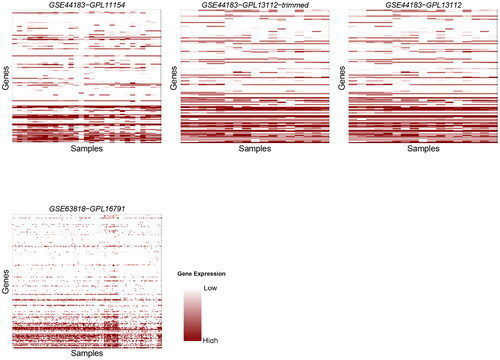
Figure 3. Heatmaps for four datasets obtained using the Tang protocol. The title of each heatmap represents the dataset’s ID, the y-axis denotes samples and the x-axis denotes genes. A solid white represents dropout or inactivity of genes.
Discussion
There are 18 datasets obtained using the SMATRer protocol and 11 using the Smart-Seq protocol. The total abundance reads in all datasets for each protocol is almost the same; SMATRer is 34 million, and Samrt-seq is 30 million. As for Tang, we had four datasets in our experiment with a total number of abundance reads of 24 million. Considering all reads across all datasets and from the results obtained, the SMARTer protocol has the lowest percentage of dropout rate with 64.51% across all its datasets combined. The second lowest dropout rate is that of the Smart-Seq protocol, with 72.59% across all its datasets. The last is Tang, with 79.90%. These results indicate that SMARTer could be considered the most reliable protocol for detecting gene abundance.
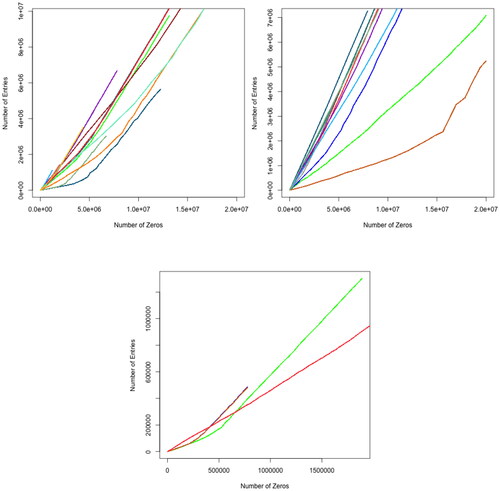
All dropout percentages in the results are above 50%. This is probably because of the fact that only a few genes are active at a time in samples. The synthesis of a certain polypeptide or protein does not necessarily require a large sequence of the DNA to be active. Thus, few genes will show molecular activity and their expression can then be detected. A noticeable observation is that the number of zero counts (dropout rate) increases ascendingly (the rate in which the dropout counts increases becomes larger as we go down in the dataframe of genes-samples abundance). This is shown clearly in all Heatmap plots, as the shades of color are darker at the beginning of the y-axis, which represents genes, and lighter at later stages of the axis. It is not possible that all genes in the samples are active at the beginning and not active at the end. To clarify this observation, we plotted the relation between the number of genes in the samples and the number of zero counts (dropout rate) (). In almost all datasets, the number of zeros increased slightly (since datasets vary greatly in size, the plots were trimmed to fit all results into one plot). This suggests that in all of the three protocols, the ability to detect gene abundance decreases as the sequencing advances and accordingly the reliability decreases.
Figure 4. Plots represent the relation between the number of genes in each sample and the dropout rate. SMARTer protocol (left panel), Smart-Seq (Middle panel) and Tang (right panel). Each line in these plots represents a dropout in a dataset.
Measuring the dropout rate among protocols is difficult due to the fact that the level of gene abundance may be related to the type of cell or the cell’s development stage. A gene may be inactive at one stage but may be activated at a later stage. If the number of samples and the number of genes in these samples are similar across all datasets and the production of all these datasets is divided evenly on all of the three sequencing protocols, then the results will be more accurate but the availability of such perfect distribution is rare. However, the decrease in the ability to detect gene abundance (the increment in dropout events) is noticeable in all datasets regardless of the diversity of datasets.
Conclusions
On the basis on the findings reported in this study, we suggest that the SMARTer protocol could be considered the most reliable for RNA sequencing. Smart-Seq protocol comes next and then, the Tang protocol. The results from this analysis can help researchers in evaluating their genomics data as well as in choosing the appropriate sequencing protocol for their patient samples. This study is the first step for benchmarking sequencing methods to standardize their usage and contribute to the quality of their raw data.
Authors’ contribution
The author has contributed to the conceptualization, design, analysis, implementation and writing of this manuscript.
Disclosure statement
No conflict of interest in this research.
Data availability statement
The author confirms that the data supporting the findings of this study are available within the article. The datasets used in this study are imported from the project conquer that is available at https://github.com/markrobinsonuzh/conquer.
Additional information
Funding
References
- Luecken MD, Theis FJ. Current best practices in single-cell RNA-seq analysis: a tutorial. Mol Syst Biol. 2019;15(6):e8746. doi: 10.15252/msb.20188746.
- Andrews TS, Kiselev VY, McCarthy D, et al. Tutorial: guidelines for the computational analysis of single-cell RNA sequencing data. Nat Protoc. 2021;16(1):1–9. doi: 10.1038/s41596-020-00409-w.
- Angerer P, Simon L, Tritschler S, et al. Single cells make big data: new challenges and opportunities in transcriptomics. Curr Opin Syst Biol. 2017;4:85–91. doi: 10.1016/j.coisb.2017.07.004.
- Jovic D, Liang X, Zeng H, et al. Single-cell RNA sequencing technologies and applications: a brief overview. Clinical and Translational Medicine. 2022;12(3):e694.
- Heumos L, Schaar AC, Lance C, Single cell Best Practices Consortium, et al. Best practices for single-cell analysis across modalities. Nat Rev Genet. 2023;24(8):550–572. doi: 10.1038/s41576-023-00586-w.
- Alaqeeli O, Xing L, Zhang X. Software benchmark—classification tree algorithms for cell atlases annotation using single-cell rna-sequencing data. Microbiol Res. 2021;12(2):317–334. doi: 10.3390/microbiolres12020022.
- Alaqeeli O, Alturki R. Evaluating the performance of the generalized linear model (GLM) R package using single-cell RNA-sequencing data. Appl Sci. 2023;13(20):11512. doi: 10.3390/app132011512.
- Liang J, Cai W, Sun Z. Single-cell sequencing technologies: current and future. J Genet Genomics. 2014;41(10):513–528. doi: 10.1016/j.jgg.2014.09.005.
- VanGuilder HD, Vrana KE, Freeman WM. Twenty-five years of quantitative pcr for gene expression analysis. Biotechniques. 2008;44(5):619–626. doi: 10.2144/000112776.
- Brazma A, Vilo J. Gene expression data analysis. FEBS Lett. 2000;480(1):17–24. doi: 10.1016/s0014-5793(00)01772-5.
- Hamadeh HK, Bushel PR, Jayadev S, et al. Gene expression analysis reveals chemical-specific profiles. Toxicol Sci. 2002;67(2):219–231. doi: 10.1093/toxsci/67.2.219.
- Anders S, Huber W. Differential expression analysis for sequence count data. Nat Prec. 2010;11(10):R106. doi: 10.1038/npre.2010.4282.2.
- Zhang ZH, Jhaveri DJ, Marshall VM, et al. A comparative study of techniques for differential expression analysis on rna-seq data. PLoS One. 2014;9(8):e103207. doi: 10.1371/journal.pone.0103207.
- Rapaport F, Khanin R, Liang Y, et al. Comprehensive evaluation of differential gene expression analysis methods for RNA-seq data. Genome Biol. 2013;14(9):R95. doi: 10.1186/gb-2013-14-9-r95.
- Hombach S, Kretz M. Non-coding RNAs: classification, biology and functioning. Cham: Springer International Publishing; 2016. p. 3–17.
- Taft RJ, Pang KC, Mercer TR, et al. Non-coding RNAs: regulators of disease. J Pathol. 2010;220(2):126–139. doi: 10.1002/path.2638.
- Mattick JS, Amaral PP, Carninci P, et al. Long non-coding RNAs: definitions, functions, challenges and recommendations. Nat Rev Mol Cell Biol. 2023;24(6):430–447. doi: 10.1038/s41580-022-00566-8.
- Aebersold R, Anderson L, Caprioli R, et al. Perspective: a program to improve protein biomarker discovery for cancer. J Proteome Res. 2005;4(4):1104–1109. doi: 10.1021/pr050027n.
- Ding Y, Fu M, Luo P, et al. Network learning for biomarker discovery. IJNDI. 2023;2(1):51–65. doi: 10.53941/ijndi0201004.
- Philips AV, Cooper TA. RNA processing and human disease. Cell Mol Life Sci. 2000;57(2):235–249. doi: 10.1007/PL00000687.
- Adams BD, Parsons C, Walker L, et al. Targeting noncoding RNAs in disease. J Clin Invest. 2017;127(3):761–771. doi: 10.1172/JCI84424.
- Hong M, Tao S, Zhang L, et al. RNA sequencing: new technologies and applications in cancer research. J Hematol Oncol. 2020;13(1):166. doi: 10.1186/s13045-020-01005-x.
- Haleem JI, Waybright TJ, Veenstra TD. Cancer biomarker discovery: opportunities and pitfalls in analytical methods. Electrophoresis. 2011;32(9):967–975.
- Xu J, Cui L, Zhuang J, et al. Evaluating the performance of dropout imputation and clustering methods for single-cell RNA sequencing data. Comput Biol Med. 2022;146:105697. doi: 10.1016/j.compbiomed.2022.105697.
- Tracy S, Yuan G-C, Dries R. Rescue: imputing dropout events in single-cell RNA-sequencing data. BMC Bioinformatics. 2019;20(1):388. doi: 10.1186/s12859-019-2977-0.
- Jeong H, Liu Z. PRIME: a probabilistic imputation method to reduce dropout effects in single-cell RNA sequencing. Bioinformatics. 2020;36(13):4021–4029. doi: 10.1093/bioinformatics/btaa278.
- Dvořáková E, Kumar S, Kléma J, et al. Evaluating model-free directional dependency methods on single-cell RNA sequencing data with severe dropout. ICBRA ‘19: Proceedings of the 6th International Conference on Bioinformatics Research and Applications; 2019 Dec 19–21; Seoul Republic of Korea. New York, NY: Association for Computing Machinery; 2020. p. 55–62.
- Kim TH, Zhou X, Chen M. Demystifying “drop-outs” in single-cell UMI data. Genome Biol. 2020;21(1):196. doi: 10.1186/s13059-020-02096-y.
- Choi K, Chen Y, Skelly DA, et al. Bayesian model selection reveals biological origins of zero inflation in single-cell transcriptomics. Genome Biol. 2020;21(1):183. doi: 10.1186/s13059-020-02103-2.
- Bhargava V, Head SR, Ordoukhanian P, et al. Technical variations in low-input RNA-seq methodologies. Sci Rep. 2014;4(1):3678. doi: 10.1038/srep03678.
- Gong W, Kwak I-Y, Pota P, et al. Drimpute: imputing dropout events in single cell RNA sequencing data. BMC Bioinformatics. 2018;19(1):220. doi: 10.1186/s12859-018-2226-y.
- Picelli S. Single-cell rna-sequencing: the future of genome biology is now. RNA Biol. 2017;14(5):637–650. doi: 10.1080/15476286.2016.1201618.
- Verboom K, Everaert C, Bolduc N, et al. SMARTer single cell total RNA sequencing. Nucleic Acids Res. 2019;47(16):e93–e93–e93. doi: 10.1093/nar/gkz535.
- Palomares M-A, Dalmasso C, Bonnet E, et al. Systematic analysis of TruSeq, SMARTer and SMARTer ultra-low RNA-seq kits for standard, low and ultra-low quantity samples. Sci Rep. 2019;9(1):7550. doi: 10.1038/s41598-019-43983-0.
- Goetz JJ, Trimarchi JM. Transcriptome sequencing of single cells with Smart-Seq. Nat Biotechnol. 2012;30(8):763–765. doi: 10.1038/nbt.2325.
- Wang J, Rieder SA, Wu J, et al. Evaluation of ultra-low input RNA sequencing for the study of human T cell transcriptome. Sci Rep. 2019;9(1):8445. doi: 10.1038/s41598-019-44902-z.
- Picelli S, Faridani OR, Björklund AK, et al. Full-length RNA-seq from single cells using Smart-Seq2. Nat Protoc. 2014;9(1):171–181. doi: 10.1038/nprot.2014.006.
- Hagemann-Jensen M, Ziegenhain C, Chen P, et al. Single-cell RNA counting at allele and isoform resolution using Smart-Seq3. Nat Biotechnol. 2020;38(6):708–714. doi: 10.1038/s41587-020-0497-0.
- Durruthy-Durruthy R, Ray M. Using Fluidigm C1 to generate single-cell full-length cDNA libraries for mRNA sequencing. Methods Mol Biol. 2018;1706:199–221.
- Tang F, Barbacioru C, Wang Y, et al. mRNA-Seq whole-transcriptome analysis of a single cell. Nat Methods. 2009;6(5):377–382. doi: 10.1038/nmeth.1315.
- Tang F, Barbacioru C, Nordman E, et al. RNA-Seq analysis to capture the transcriptome landscape of a single cell. Nat Protoc. 2010;5(3):516–535. doi: 10.1038/nprot.2009.236.
- Tang G. Plant microRNAs: an insight into their gene structures and evolution. Semin Cell Dev Biol. 2010;21(8):782–789. doi: 10.1016/j.semcdb.2010.07.009.
- Garrido-Cardenas J, Garcia-Maroto F, Alvarez-Bermejo J, et al. DNA sequencing sensors: an overview. Sensors. 2017;17(3):588. doi: 10.3390/s17030588.
- Mardis ER. Next-generation DNA sequencing methods. Annu Rev Genomics Hum Genet. 2008;9(1):387–402. doi: 10.1146/annurev.genom.9.081307.164359.
- Stone GG, Oberst RD, Hays MP, et al. Combined PCR-oligonucleotide ligation assay for rapid detection of Salmonella serovars. J Clin Microbiol. 1995;33(11):2888–2893. doi: 10.1128/jcm.33.11.2888-2893.1995.
- Soneson C, Robinson MD. Bias, robustness and scalability in single-cell differential expression analysis. Nat Methods. 2018;15(4):255–261. doi: 10.1038/nmeth.4612.