
Abstract
The current study was carried out as part of the CITYCOP project exploring fear of crime, risk perception and feelings of security and insecurity. Participants (n = 272) from 11 European countries answered a questionnaire exploring measures of risk perception, fear of crime, anxiety, trust in police and related behaviours. A seven-factor structure is proposed incorporating ‘Signs of Social and Physical Disorder’, ‘Trust in Police’, ‘Trait Anxiety’, ‘Collective Efficacy’, ‘Perceived Risk of Victimisation’, ‘Fear of Personal Harm’ and ‘Fear of Property Theft’. Overall findings suggest that the measures associated with feelings of insecurity are negatively related to the measures associated with feelings of security. Efforts should be made to reduce feelings of insecurity through encouraging trust in law enforcement and community interaction and reducing signs of social and physical disorder.
Introduction
Fear of crime and feelings of insecurity regarding one’s environment are argued to impact adversely on the quality of life of citizens, especially when feelings of fear become excessive with dysfunctional or unproductive consequences (Warr, Citation2000), which may lead to impaired physical and mental health (McCabe & Raine, Citation1997; Perkins & Taylor, Citation1996; Robinson & Keithley, Citation2000). Furthermore, in reaction to the threat of victimisation people are prone to engage in behaviours including avoiding certain places or people. These behaviours impair quality of life through limiting daily activities, increasing social isolation (Pain & Townshend, Citation2002; Rader & Haynes, Citation2014). This lower frequency of social activities weakens informal social controls, which can enhance community decline (Skogan, Citation1990).
In contrast, formal social control encompasses the activities of law enforcement agencies (LEAs), including community policing approaches, which can be used to increase feelings of security amongst citizens. Community policing connects police to citizens and facilitates the improvement of traditional policing practice, enhancing innovative, proactive, collaborative and strategic approaches to crime prevention (Scheider, Chapman, & Schapiro, Citation2009). In particular, community policing approaches focus on working with local residents and stakeholders as a partnership to be active in tackling crime. Examining the factors that alleviate fear of crime and feelings of insecurity is crucial to community policing approaches and ensuring greater community resilience against perceived and actual crime.
Generally, fear of crime can be defined as an emotional response to a danger or threat of an actual or potential criminal incident, whereas perceived risk may be seen as a cognitive response resulting from an assessment of the likelihood of being victimised (Henson & Reyns, Citation2015). However, these concepts share a considerable overlap, and the relationship between fear of crime and perceived risk has been suggested to be causal as well as reciprocal (Hicks & Brown, Citation2013). Additionally, fear of crime may be related to crime-specific worry as well as anxiety in general, and the different types of fear have different effects on citizens’ behaviours and general well-being (Gray, Jackson, & Farrall, Citation2011; Jackson & Gray, Citation2010, Karakus, McGarrell, & Basibuyuk, Citation2010). Fear of crime may thus be divided into two basic ‘types’: an incident-specific fear that is related to an explicit cue, and anxiety that is caused by a threatening environment and building up over time (Gabriel & Greve, Citation2003). The role of anxiety as a personality trait may also have a role to play in fear of crime and feelings of insecurity (Ellis & Renouf, Citation2017) but this has remained largely unexplored in the context of fear of crime research. Fear of crime is only salient when there is a cognitive perception of being threatened, a feeling of fear and a motive to respond to the situation. Situations that evoke fear of crime are argued to be complex and are combinations of a range of factors that feedback into each other. For example, they may combine a cognitive evaluation with a response to the situation based upon prior expectations, current awareness, appraisals, attributions and evaluations (Gabriel & Greve, Citation2003).
Feelings of security and insecurity are related to risk perception, and these feelings and cognitions have an effect on behaviour. However, recent research has suggested that security and insecurity should not be considered as being at opposite ends of the same dimension; rather they are argued to be different factors. What makes citizens feel more secure in their environment may be difficult to identify – for example, increased surveillance has led to some citizens feeling more insecure. The relationship between feeling insecure in the presence of surveillance and feeling happy or unhappy with surveillance has been found to be significantly stronger than the link between feelings of security in the presence of surveillance and feeling happy or unhappy with surveillance (Brockdorff & Appleby-Arnold, Citation2015). As part of the EU-funded SMART project, citizens’ associations of personal safety were explored, with the most common associations being related to personal responsibility and self-defence (Appleby-Arnold, Brockdorff, & Mezzana, Citation2014). Within the context of risk perception and fear of crime, this would then suggest that citizens will engage in behaviours that will increase their personal safety and increase feelings of security.
Insecurity has predominantly been described as a feeling that is caused by a perceived lack of control combined with an individual’s perceived risk of victimisation (Farrall, Gray, & Jackson, Citation2007). Insecurity has further been used as a synonym for the perceived risk of victimisation itself, or fear of crime has been defined as a ‘type’ of insecurity. This conceptual vagueness is reflected by the fact that insecurity has rarely been measured directly – unless defined as a perceived lack of personal or environmental safety (Valera & Guàrdia, Citation2014). However, insecurity can also be understood as a concept that comprises both components – fear of crime and perceived risk of victimisation – rather than being subsumed under one or the other. This integrative definition provides the most adequate conceptualisation, which places the factors that will lower citizens’ perceptions of insecurity at the centre of attention. The following sections explore a number of concepts related to citizens’ perception of risk, trait anxiety and social and environmental factors that are argued to be relevant for citizens’ feelings of security and insecurity.
Review of factors related to security/insecurity
Perceived risk of victimisation
Research examining crime-related risk has ranged from the perception of how safe it is being alone at night, the perceived likelihood of becoming a victim in general or of specified individual offences, or perceptions of an increase of crime, to a perceived neighbourhood criminality (Hicks & Brown, Citation2013). It is increasingly accepted that measuring perceived risk requires a careful definition of who is perceived to be at risk (i.e. does the respondent consider himself or others to be at risk), and what specific risk is perceived (i.e. a distinction between different types of crime). Additionally, asking for a perceived risk of victimisation that is projected to a point or period of time in the future (e.g. the next 12 months) helps to separate perceived risk from feelings of fear, given that generally feelings of fear either are reported retrospectively or relate to the present.
Trait anxiety
Whilst prior research has focused upon community and demographic factors as predictors of fear of crime (Ellis & Renouf, Citation2017), the current research examines the impact of anxiety on fear of crime. Ellis and Renouf (Citation2017) argue that higher levels of emotionality and lower levels of humility and honesty are more predictive of fear of crime than prior victimisation, suggesting that personality factors play a role in fear of crime. General anxiety is further argued to be significantly related to fear of crime, with those individuals who have greater levels of anxiety having greater levels of fear of crime (Ellis & Renouf, Citation2017).
Signs of social and physical disorder
Contextual-level theories of fear of crime focus on environmental factors that might affect fear of crime (Henson & Reyns, Citation2015). Social disorder and incivilities have a link with fear of crime and can be both physical and social – for example, physical factors including litter and broken windows are argued to increase fear of crime (Henson & Reyns, Citation2015; Hicks & Brown, Citation2013; Scarborough, Like-Haislip, Novak, Lucas, & Alarid, Citation2010). Areas with high levels of crime are further argued to also have an effect on the levels of fear of crime of the citizens living within them (Breetzke & Pearson, Citation2014). However, neighbourhoods are fluid and flexible, and citizens experience and define neighbourhoods differently to one another; therefore an understanding of citizens’ perceptions of the areas in which they live is required (Breetzke & Pearson, Citation2014).
Collective efficacy
Social efficacy, shared social values and community heterogeneity alongside informal social control are argued to reduce the perception of levels of crime (Brunton-Smith, Jackson, & Sutherland, Citation2014). Social integration can help inhibit fear of crime (Henson & Reyns, Citation2015; Karakus et al., Citation2010), and individuals with greater community cohesion are also less likely to tolerate crime (Scarborough et al., Citation2010), although Brunton-Smith et al. (Citation2014) argue that the effect of collective efficacy on reducing the perceptions of levels of crime in a neighbourhood will differ according to the unique make-up of the neighbourhood. There is weaker collective efficacy in disadvantaged neighbourhoods, in more urban areas and where there are vacant properties, whilst collective efficacy is greater with diverse neighbourhoods, with younger populations and where there is a high adult-to-child ratio (Brunton-Smith et al., Citation2014). Areas with weaker collective efficacy have greater disorder than those with stronger efficacy (Brunton-Smith et al., Citation2014), alongside a greater fear of crime (Breetzke & Pearson, Citation2014).
Trust in police
Community policing approaches are aimed at enhancing interactions between citizens and the police and reducing feelings of insecurity and fear of crime. For such actions to be effective there needs to be trust between the community and the police force; without trust in the police there may be widespread anxiety and fear of crime. Trust in the police extends beyond universal singular judgements and incorporates wider variables affecting judgement (Jackson & Bradford, Citation2010). Trust in the police is embedded in social relationships, and the expectations that citizens have of others are key to this, though treating citizens fairly and with dignity are stronger predictors of trust in the police than perceived effectiveness (Jackson & Bradford, Citation2010). Public confidence in the police is constructed from perceptions of police effectiveness, fairness of personal treatment, the level of police engagement with the community and concerns about local disorder (Stanko & Bradford, Citation2009). Satisfaction in the police and the relationship to fear of crime has a complex relationship, with some research suggesting that there is no relationship (Scarborough et al., Citation2010), whilst others finding that satisfaction with the police reduces fear of crime (Bennett, Citation1991; Skogan, Citation1990, Citation2009).
In the present study, and in contrast to previous research, we included a variety of measures related to security/insecurity, aiming to examine their relationship with one of the major personality traits: anxiety. We administered a questionnaire that included these measures in a number of European Union countries in an attempt to cover a culturally more variable sample. This enabled us to explore how these measures combine to examine citizens’ feelings of security and insecurity. The current analysis aimed to develop and refine a model of security and insecurity related to crime through examining: (a) whether the measures used form adequate constructs; (b) whether the measures are conceptually different from one another; and (c) how these measures combine to produce an enhanced understanding of how feelings of security and insecurity relate to crime.
Method
Participants
An opportunity snowballing sampling technique was used to recruit participants from 11 European countries where our project partners were based: Romania, Serbia, Spain, the United Kingdom, Austria, France, Bulgaria, Germany, Italy, Malta and Norway. A total of 625 people were invited to take part in the research, and 272 participants completed the questionnaire on the Internet (Mage = 42.09 years; SD = 15.19, see ).
Table 1. Sample demographics.
Materials
The following sub-sections describe the measures used in the questionnaire and are all drawn from the published literature. In its overall structure the questionnaire follows a logic that goes from the general (i.e. non-crime-related) to the specific (crime-related) questions, and from questions about past experiences to questions that ask about future expectations. The measures used in the questionnaire are outlined below.
Personality traits
A measure based on the eight-item neuroticism versus emotional stability measure of the Big Five Inventory (BFI; John, Donahue, & Kentle, Citation1991) was used. Whilst this measure does not exclusively target trait anxiety, neuroticism as a personality dimension includes facets such as anxiety, depression and vulnerability, which have an effect on crime-related anxiety.
Fear of crime
Fear of crime was measured using two different approaches. One measure consisted of items based on the typology of crimes developed by May, Rader, and Goodrum (Citation2010) for perceived risk of victimisation. The number of items applied in the present study was reduced to five, from the seven used for the original measure developed by May et al. Similar measures were used by Gainey, Alper, and Chappell (Citation2011) and Jackson (Citation2009), who specifically focused on the frequency of worry about crime. The second measure of fear of crime consisted of items based on the Rader and Haynes (Citation2014) measure of fear for others, reduced from three to two items, which is considered as acceptable given that the removed item asked about fear for spouses or significant others, which can be seen to be subsumed under family members. Fear of crime for both self and others was measured on a 5-point scale (adapted from the 4-point frequency scale of Johnson, Citation2009).
Signs of social and physical disorder
Signs of social and physical disorder have long been identified as having a strong influence on both citizens’ risk perception and fear of crime (see e.g. Brunton-Smith et al., Citation2014; Gainey et al., Citation2011; Gray et al., Citation2011; Lorenc et al., Citation2013; Valera & Guàrdia, Citation2014), with most measures ranging between five and 10 items. The measure for the purpose of this study was based on the 10-item measure of Gainey et al. (Citation2011) reduced to six items. All items were measured on a 4-point scale.
Collective efficacy
Whilst signs of social and physical disorder have a strong enhancing effect on fear of crime, previous research has found collective efficacy to be a strong mitigating factor (see e.g. Brunton-Smith et al., Citation2014; Gainey et al., Citation2011; May et al., Citation2010; Scarborough et al., Citation2010). Generally, collective efficacy has been defined as consisting of three main components: social cohesion, informal social control and trust in one’s neighbourhood. The measure used in this study is based on the six-item measure of Gray et al. (Citation2011) and Brunton-Smith et al. (Citation2014), reduced to five items. An additional measure was added, which, rather than exploring the respondents’ perceptions, looks into their general feelings about their neighbourhood: ‘I am happy living in the area where I live’. For all items related to the measurement of collective efficacy a 5-point Likert scale was used.
Trust in police
Trust in police is a concept that has, so far, mostly been researched in parallel to fear of crime, but not together. One of the exceptions is the work of Jackson and Bradford (Citation2010) who, based on established measures from the Metropolitan Police Public Attitudes Survey (MPS) Model of Confidence in Policing, explored the relationships between the findings about citizens’ trust in police and confidence in policing with worry about crime. However, in order to limit the total number of questions, the MPS measure for police effectiveness was reduced from eight to three items, the measure for police fairness was reduced from four items to one item, and police community engagement was reduced from four to two items (original MPS measures in Stanko & Bradford, Citation2009). The measure for confidence in police used here is based on the overall confidence measure of the British Public Service Agreement survey (PSA23).
Perceived risk of victimisation
Perceived risk of victimisation takes into consideration all the aspects mentioned above. It is based on the same typology of crimes as the items in the fear of crime measure (seven-item measure by May et al., Citation2010, reduced by two items), but investigates the respondents’ perceived likelihood to be victimised within the next 12 months rather than having worried in the past three months.
Procedure
Following the opportunity snowballing sampling and agreement to participate in the research, respondents were sent email invitations, which provided them with a brief introduction to the study and a link to the web page hosting the questionnaire (SurveyMonkey for a period of 3 months). The questionnaire was available in the nine languages used in the countries of residence of the participants. Ethical approval was granted by the University of Malta’s Research Ethics Committee. Once respondents had read the introduction to the research and given their consent on the first page of the website, they were invited to continue with the rest of the questionnaire. All participants completed the web questionnaire in the same order.
Data analysis
Principal components analysis (PCA) with oblimin rotation was selected as the differing scales correlate with one another. Following the initial PCA, the items ‘I see myself as emotionally stable, not easily upset’, ‘I see myself as someone who is depressed, blue’, ‘I see myself as someone who can be moody’ and ‘How often do you encounter or see the following problems in the area where you live: Drug dealing (or activities that look like drug dealing)’ were removed. For the PCA, correlations below .35 were suppressed.
Results
Principal components analysis
A principal components factor analysis was conducted on the correlations of the 35 items with oblique rotation (direct oblimin). The Kaiser–Meyer–Olkin (KMO) measure verified the sampling adequacy for the analysis, KMO = .84 (‘meritorious’ according to Hutcheson & Sofroniou, Citation1999), while Bartlett’s test of sphericity was significant, χ2(595) = 2492.31, p < .001. An initial analysis was run to obtain eigenvalues for each factor in the data (see ) where factors with eigenvalues of greater than 1 were extracted, with loadings of less than .35 being suppressed. Seven factors had eigenvalues over Kaiser’s criteria of 1 and in combination explained 69.75% of the variance. shows the factor loadings after rotation. The items that cluster on the same factor suggest that Factor 1 represents Signs of Social and Physical Disorder (five items), Factor 2 represents Trust in Police (seven items), Factor 3 represents Trait Anxiety (five items), Factor 4 represents Collective Efficacy (six items), Factor 5 represents Perceived Risk of Victimisation (five items), Factor 6 represents Fear of Personal Harm (four items), and Factor 7 represents Fear of Property Harm (three items).
Figure 1. Scree plot of the items related to security and insecurity.
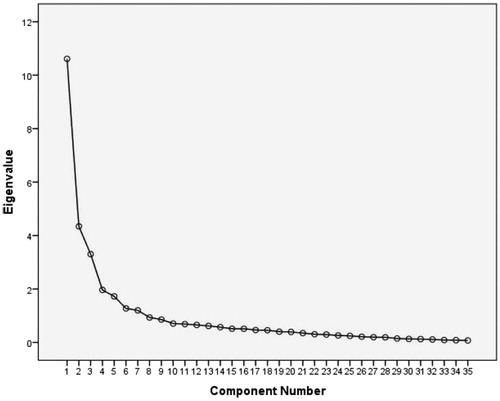
Table 2. Structure matrix of the measures.
Analysis of key demographics
A multivariate analysis of variance (ANOVA) was conducted to examine gender differences, the perception of neighbourhood crime rate and the perception of neighbourhood ethnic diversity across the different measures. Using Pillai’s trace there was no significant effect of gender across the measures, V = 0.13, F(7, 97) = 1.99, p = .06. However, separate univariate ANOVAs on the outcome variables revealed a significant effect of gender on Trait Anxiety, F(1, 103) = 5.06, p = .027, with females (M = 13.9, SD = 3.46) having greater Trait Anxiety than males (M = 12.3, SD = 3.63).
Using Pillai’s trace there was a significant effect of perception of living in an area with a high crime rate across the measures, V = 0.48, F(14, 194) = 4.33, p < .001. Separate univariate ANOVAs on the outcome variables revealed a significant effect of living in an area with a high crime rate on Signs of Social and Physical Disorder, F(2, 102) = 5.45, p = .006, Trust in Police, F(2, 102) = 5.05, p = .008, Collective Efficacy, F(2, 102) = 12.14, p < .001, Perceived Risk of Victimisation, F(2, 102) = 17.68, p < .001, Fear of Personal Harm, F(2, 102) = 4.02, p = .021 and Fear of Property Theft, F(2, 102) = 7.22, p = .001.
Perceived crime rate and signs of social and physical disorder
Those participants who felt they lived in an area with a high crime rate (M = 11.89, SD = 3.34) or were not sure (M = 11.57, SD = 3.34) reported a greater number of Signs of Social and Physical Disorder than those participants who did not live in an area with a high crime rate (M = 9.42, SD = 3.33).
Perceived crime rate and trust in police
Those participants who felt they lived in an area with a high crime rate (M = 19, SD = 6.57) or were not sure (M = 18.35, SD = 5.47) had a lower Trust in Police than those participants who did not feel they lived in an area with a high crime rate (M = 22.88, SD = 6.23).
Perceived crime rate and collective efficacy
Those participants who felt they lived in an area with a high crime rate (M = 16.50, SD = 4.78) had a lower level of Collective Efficacy than those participants who did not feel they lived in an area with a high crime rate (M = 22.05, SD = 4.33) or were not sure (M = 20.43, SD = 3.34).
Perceived crime rate and perceived risk of victimisation
Those participants who felt they lived in an area with a high crime rate (M = 15.61, SD = 4.23) or were not sure (M = 13.14, SD = 4.09) had a greater Perceived Risk of Victimisation than those participants who did not feel they lived in an area with a high crime rate (M = 9.86, SD = 3.75).
Perceived crime rate and fear of personal harm
Those participants who felt they lived in an area with a high crime rate (M = 8.22, SD = 3.64) or were not sure (M = 7.64, SD = 2.65) had a greater Fear of Personal Harm than those participants who do not feel they live in an area with a high crime rate (M = 6.29, SD = 2.67).
Perceived crime rate and fear of property theft
Those participants who felt they lived in an area with a high crime rate (M = 7.39, SD = 2.25) had a greater Fear of Property Theft than those participants who did not feel they lived in an area with a high crime rate (M = 5.22, SD = 2.16) or were not sure (M = 5.43, SD = 2.21). There was no significant effect on living in an area with a high crime rate and Trait Anxiety, F(2, 102) = 1.19, p = .309.
Perceived ethnic diversity findings
Using Pillai’s trace there was no significant effect of living in an ethnically diverse neighbourhood across the measures, V = 0.16, F(14, 194) = 1.2, p = .278. However, separate univariate ANOVAs on the outcome variables did reveal a significant effect of ethnic diversity on Signs of Social and Physical Disorder, F(2, 102) = 4.00, p = .021, on Trust in Police, F(2, 102) = 2.94, p = .05, and on Collective Efficacy, F(2, 102) = 3.47, p = .035.
Perceived ethnic diversity and signs of social and physical disorder
Those participants who perceived they lived in an ethnically diverse area (M = 11.13, SD = 3.77) saw more signs of social and physical disorder than those who did not (M = 9.41, SD) or were not sure (M = 8.63, SD = 3.16).
Perceived ethnic diversity and trust in police
Those participants who felt they lived in an ethnically diverse neighbourhood had a lower level of trust in police (M = 20.1, SD = 7.38), than those participants who did not feel they lived in an ethnically diverse neighbourhood (M = 22.7, SD = 5.32) and those participants who were not sure whether they lived in an ethnically diverse neighbourhood (M = 24.5, SD = 4.75).
Perceived ethnic diversity and collective efficacy
Those participants who perceived they lived in an ethnically diverse area (M = 19.64, SD = 4.64) or were not sure (M = 20.75, SD = 4.53) had lower levels of collective efficacy than those who did not (M = 22.12, SD = 4.63).
Correlational analysis
The majority of correlations between the different measures related to feelings of security and insecurity were significant, with relationships between all scales apart from Trait Anxiety and Collective Efficacy, and Trust in Police and Fear of Property Theft (see , ). Participant’s age was also examined through a series of Spearman’s correlations, which resulted in one statistically significant negative correlation between age and trait anxiety (rs = −.25, p < .001), where younger participants had higher levels of trait anxiety. All other correlations between age and the measures were non-significant.
Based on the obtained results we provide a possible model of interaction among studied factors.
Figure 2. Model of security and insecurity in the context of crime, showing the obtained correlation among the factors extracted from the principal components analysis (PCA). *is significance level p < 05 and **is p < 005.
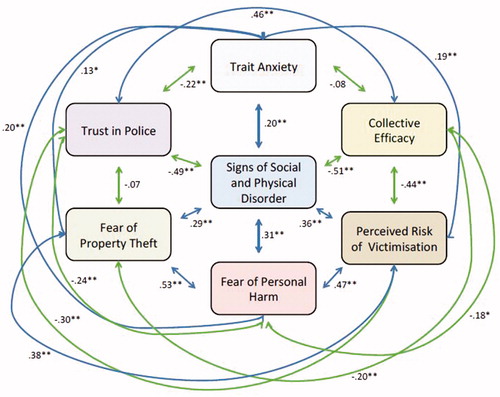
Table 3. Spearman’s correlations between predictors.
Discussion
This study aimed to examine the factor structure of a new approach to measuring fear of crime, risk perception, trait anxiety and signs of social and physical disorder, collective efficacy and trust in police from a perspective of security and insecurity related to crime. The removal of four items from the original 39-item measure led to a 35-item measure with seven distinct factors. The majority of the factors reflected the initial scales used in the research with the exception of the Fear of Crime scale, which, following the PCA, was split into two separate scales: Fear of Personal Harm and Fear of Property Theft. It is interesting that though the scales ‘Fear of Crime’ and ‘Perceived Risk of Victimisation’ both use exactly the same items, one asks about the past experiences and another about the future expectations. The Perceived Risk of Victimisation scale delivered only one dimension, whilst the initial Fear of Crime measure had two dimensions that were broken down into two separate scales for the analysis. Participants seem to have different experiences of fear for personal harm compared to fear for property that happened in the past. However, they do not distinguish between the two when thinking about potential future victimisation. Potential explanations for this finding may be related to the concept of episodic future thinking where individuals base their future thinking from specific autobiographical experiences (Schacter, Benoit, & Szpunar, Citation2017). Participants’ ability to think about future events is argued to be sometimes distorted due to its reliance on these autobiographic experiences, which are subject to influence from biases (Schacter et al., Citation2017), suggesting that even though the same items were used for the initial fear of crime and perceived risk of victimisation scales, the events that lead to feelings of fear for personal harm and feelings of fear of property theft are not salient when participants are asked to think about future events.
Previous research that explored gender differences and anxiety, via implicit and explicit methods, has consistently found that women show higher levels of anxiety than men (e.g. Asher, Asnaani, & Aderka, Citation2017; Schwibbe & Beauducel, Citation2016; Vianello, Schnabel, Sriram, & Nosek, Citation2013), and the current findings support this. Younger people were also found to have higher levels of trait anxiety than older people, which support previous findings across different countries, where anxiety is found to decrease over the lifespan (Donnellan & Lucas, Citation2008, Wortman, Lucas, & Donnellan, Citation2012).
Perceived high-crime-rate neighbourhoods were related to greater Signs of Social and Physical Disorder, Perceived Risk of Victimisation, Fear of Personal Harm and Fear of Property Theft. These findings are consistent with previous research, which found that areas with actual or perceived high crime rates have higher rates of fear of crime (Sampson & Raudenbush, Citation2004; Skogan, Citation1990) and higher signs of social and physical disorder (Scarborough et al., Citation2010; Skogan, Citation1990). The relationship between perceived crime rate leading to a greater perceived risk of victimisation further reflects past research (Chiricos, McEntire, & Gertz, Citation2001; Rader, May, & Goodrum, Citation2007). Perceived low-crime-rate neighbourhoods were related to greater Trust in Police and Collective Efficacy. These findings suggest that participants who think they live in areas with lower crime rates where they feel safe are found to express more positive attitudes towards the police than do those who live in areas where there are higher crime rates where they do not feel safe (Cheng, Citation2015; Hwang, McGarrell, & Benson, Citation2005; Skogan, Citation2005). Areas with perceived low crime rates are associated with greater collective efficacy, where participants have a greater social cohesion and level of interaction with their neighbours, which is consistent with the findings of previous research (Hicks & Brown, Citation2013).
We found that those who feel they live in ethnically diverse neighbourhoods see more Signs of Social and Physical Disorder and have lower Collective Efficacy and Trust in Police. The link between feeling that one lives in an ethnically diverse neighbourhood and a perceived reduced collective efficacy may be explained by the lack of a common language amongst neighbours (Benier & Wickes, Citation2016). There are many potential explanations for the link between the perception of living in an ethnically diverse neighbourhood and low trust in police but it has been suggested that this may be related to perceptions of unfair or discriminatory treatment by police forces (Sivasubramaniam & Goodman-Delahunty, Citation2008; Van Craen, Citation2012). Another potential explanation for this finding is related to the fact that neighbourhoods with greater levels of ethnic diversity often have lower socioeconomic status, which, in turn, has been linked to a reduced trust in police (Schuck, Rosenbaum, & Hawkins, Citation2008). However, other research suggests that ethnic diversity actually leads to higher trust in police, with immigrants having a greater trust in police than the native population (Bradford, Sargeant, Murphy, & Jackson, Citation2017).
Limitations
The current research used participants from a variety of European countries in an attempt to understand how individuals from different cultures perceived feelings of security and insecurity. However, the response rate from some countries was low, suggesting that some of the findings may not be generalisable to every country. Due to the limited response rate from some of the countries the samples may not be representative of the countries as a whole. The opportunity snowballing technique used for participant recruitment may have also affected the results where respondents may have come from backgrounds that do not represent the greater populations in their country. Further research using the refined measures is needed in these countries to gain a further understanding of how citizens perceive security and insecurity in relation to crime, and whether the measures are stable in other countries as well. Additionally, further research and a greater number of respondents will also enable comparisons to be conducted between different countries.
The current study used PCA with oblimin rotation to develop the seven factors related to perceptions of security and insecurity in relation to crime; however, given the large number of items across the different measures, there was not a large enough sample size to conduct confirmatory factor analysis (CFA). Further research is required with a larger sample size in order to be able to conduct CFA and to examine the structure of the proposed model of perceptions of security and insecurity in relation to crime.
Conclusions
The measures associated with feelings of insecurity (Signs of Social and Physical Disorder, Trait Anxiety, Perceived Risk of Victimisation, Fear of Personal Harm and Fear of Property Theft) are negatively related to Trust in Police and Collective Efficacy. This suggests that for community policing efforts to be successful in decreasing feelings of insecurity they should focus on approaches that increase people’s trust in law enforcement agencies, on efforts that help to encourage greater community interaction and on clearing up signs of social and physical disorder such as graffiti.
Ethical standards
Declaration of conflicts of interest
Iain Reid has declared no conflicts of interest
Sandra Appleby-Arnold has declared no conflicts of interest
Noellie Brockdorff has declared no conflicts of interest
Ivana Jakovljev has declared no conflicts of interest
Sunčica Zdravković has declared no conflicts of interest
Ethical approval
All procedures performed in studies involving human participants were in accordance with the ethical standards of the institutional and/or national research committee and with the 1964 Helsinki declaration and its later amendments or comparable ethical standards.
Informed consent
Informed consent was obtained from all individual participants included in the study
Acknowledgements
Authors would like to thank: the coordinators of the CITYCoP project, Jeanne Pia Mifsud Bonnici and Joseph A. Cannataci of the University of Groningen; Jelena Radanović (who worked at the University of Novi Sad) for her assistance with the literature review about fear of crime for the CITYCoP project; the Department of Information Policy and Governance of the University of Malta for help with the coordination of the collection of data; and all CITYCoP partners who were involved in the recruitment of participants.
Additional information
Funding
References
- Appleby-Arnold, S., Brockdorff, N., & Mezzana, D. (2014). From password to pepperspray. associations in the context of surveillance. Surveillance Ambiguities & Assymetries. Proceedings of the 6th international Survebillance & Society Conference, Barcelona.
- Asher, M., Asnaani, A., & Aderka, I.M. (2017). Gender differences in social anxiety disorder: A review. Clinical Psychology Review, 56, 1–12. doi:https://doi.org/10.1016/j.cpr.2017.05.004
- Benier, K., & Wickes, R. (2016). The effect of ethnic diversity on collective efficacy in Australia. Journal of Sociology, 52(4), 856–873. doi:https://doi.org/10.1177/1440783315599595
- Bennett, T. (1991). The effectiveness of a police initiated fear-reduction strategy. The British Journal of Criminology, 31(1), 1–14. doi:https://doi.org/10.1093/oxfordjournals.bjc.a048075
- Bradford, B., Sargeant, E., Murphy, K., & Jackson, J. (2017). A leap of faith? Trust in the police among immigrants in England and Wales. British Journal of Criminology, 57, 381–401. doi:https://doi.org/10.1093/bjc/azv126
- Breetzke, G.B., & Pearson, A.L. (2014). The fear factor: Examining the spatial variability of recoded crime on fear of crime. Applied Geography, 46, 45–52. doi:https://doi.org/10.1016/j.apgeog.2013.10.009
- Brockdorff, N., & Appleby-Arnold, S. (2015). The citizens’ perspective: Awareness, feelings and acceptance of surveillance and surveillance systems for fighting crime. A quantitative study. RESPECT project (FP7 Grant Agreement No. 285582).
- Brunton-Smith, I., Jackson, J., & Sutherland, A. (2014). Bridging structure and perception: On the neighbourhood ecology of beliefs and worries about violent crime. British Journal of Criminology, 54(4), 503–526. doi:https://doi.org/10.1093/bjc/azu020
- Cheng, H. (2015). Factors influencing public satisfaction with the local police: A study in Saskatoon, Canada. Policing: An International Journal of Police Strategies & Management, 38, 690–704. doi:https://doi.org/10.1108/PIJPSM-11-2014-0125
- Chiricos, T., McEntire, R., & Gertz, M. (2001). Perceived racial and ethnic composition of neighbourhood and perceived risk of crime. Social Problems, 48(3), 322–340. doi:https://doi.org/10.1525/sp.2001.48.3.322
- Donnellan, M.B., & Lucas, R.E. (2008). Age differences in the big five across the life span: Evidence from two national samples. Psychology and Aging, 23(3), 558–566. doi:https://doi.org/10.1037/a0012897
- Ellis, D.A., & Renouf, K.J. (2017). Predicting fear of crime: Personality outperforms prior victimisation. The Journal of Forensic Psychiatry and Psychology, 29(3), 403–418. doi:https://doi.org/10.1080/14789949.2017.1410562
- Farrall, S., Gray, E., & Jackson, J. (2007). Theorising the fear of crime: The cultural and social significance of insecurities about crime. Retrieved from https://papers.ssrn.com/sol3/papers.cfm?abstract_id=1012393.
- Gabriel, E., & Greve, W. (2003). The psychology of fear of crime: Conceptual and methodological perspectives. British Journal of Criminology, 43(3), 600–614. doi:https://doi.org/10.1093/bjc/azg600
- Gainey, R., Alper, M., & Chappell, A.T. (2011). Fear of crime revisited: Examining the direct and indirect effects of disorder, risk perception, and social capital. American Journal of Criminal Justice, 36(2), 120–137. doi:https://doi.org/10.1007/s12103-010-9089-8
- Gray, E., Jackson, J., & Farrall, S. (2011). Feelings and functions in the fear of crime: Applying a new approach to victimisation insecurity. British Journal of Criminology, 51(1), 75–94. doi:https://doi.org/10.1093/bjc/azq066
- Henson, B., Reyns, B.W. (2015). The only thing we have to fear is fear itself … and crime: The current state of the fear of crime literature and where it should go next. Sociology Compass, 9(2), 91–103. doi:https://doi.org/10.1111/soc4.12240
- Hicks, S., & Brown, S. (2013). Perceptions of risk: A review of the effects of individual and community-level variables on perceptions of risk. International Review of Victimology, 19(3), 249–267. doi:https://doi.org/10.1177/0269758013492753
- Hutcheson, G., & Sofroniou, N. (1999). The Multivariate Scientist. London: SAGE.
- Hwang, E.-G., McGarrell, E.F., & Benson, B.L. (2005). Public satisfaction with the South Korean Police: The effect of residential location in a rapidly industrializing nation. Journal of Criminal Justice, 33(6), 585–599. doi:https://doi.org/10.1016/j.jcrimjus.2005.08.007
- Jackson, J. (2009). A psychological perspective on vulnerability in the fear of crime. Psychology, Crime & Law, 15, 365–390. doi:https://doi.org/10.1080/10683160802275797
- Jackson, J., & Bradford, B. (2010). What is trust and confidence in the police? Policing, 4(3), 241–248. doi:https://doi.org/10.1093/police/paq020
- Jackson, J., & Gray, E. (2010). Functional fear and public insecurities about crime. British Journal of Criminology, 50(1), 1–22. doi:https://doi.org/10.1093/bjc/azp059
- John, O.P., Donahue, E.M., & Kentle, R.L. (1991). The Big Five Inventory–Versions 4a and 54. Berkeley, CA: University of California, Berkeley, Institute of Personality and Social Research.
- Johnson, D. (2009). Anger about crime and support for punitive criminal justice policies. Punishment & Society, 11, 51–66. doi:https://doi.org/10.1177/1462474508098132
- Karakus, O., McGarrell, E.F., & Basibuyuk, O. (2010). Fear of crime among citizens of Turkey. Journal of Criminal Justice, 38(2), 174–184. doi:https://doi.org/10.1016/j.jcrimjus.2010.02.006
- Lorenc, T., Petticrew, M., Whitehead, M., Neary, D., Clayton, S., Wright, K., … Renton, A. (2013). Environmental interventions to reduce fear of crime: Systematic review of effectiveness. Systematic Reviews, 2(1), 30. doi:https://doi.org/10.1186/2046-4053-2-30
- May, D.C., Rader, N.E., & Goodrum, S. (2010). A gendered assessment of the “Threat of Victimization”: Examining gender differences in fear of crime, perceived risk, avoidance, and defensive behaviors. Criminal Justice Review, 35(2), 159–182. doi:https://doi.org/10.1177/0734016809349166
- McCabe, A., & Raine, J. (1997). Framing the debate: The impact of crime on public health. Birmingham: Public Health Alliance.
- Pain, R., & Townshend, T. (2002). A safer city centre for all? Senses of community safety’ in Newcastle upon Tyne. Geoforum, 33(1), 105–119. doi:https://doi.org/10.1016/S0016-7185(01)00025-2
- Perkins, D.D., & Taylor, R.B. (1996). Ecological assessments of community disorder: Their relationship to fear of crime and theoretical implications. American Journal of Community Psychology, 24(1), 63–107. doi:https://doi.org/10.1007/BF02511883
- Rader, N.E., & Haynes, S.H. (2014). Avoidance, protective, and weapons behaviors: An examination of constrained behaviors and their impact on concerns about crime. Journal of Crime and Justice, 37(2), 197–213. doi:https://doi.org/10.1080/0735648X.2012.723358
- Rader, N.E., May, D.C., & Goodrum, S. (2007). An empirical assessment of the “threat of victimization:” Considering fear of crime, perceived risk, avoidance, and defensive behaviors. Sociological Spectrum, 27(5), 475–505. doi:https://doi.org/10.1080/02732170701434591
- Robinson, F., & Keithley, J. (2000). The impacts of crime on health and health services: A literature review. Health, Risk & Society, 2, 253–266.
- Sampson, R.J., & Raudenbush, S.W. (2004). Seeing disorder: Neighborhood stigma and the social construction of “Broken Windows”. Social Psychology Quarterly, 67(4), 319–342. doi:https://doi.org/10.1177/019027250406700401
- Scarborough, B.K., Like-Haislip, T.Z., Novak, K.J., Lucas, W.L., & Alarid, L.F. (2010). Assessing the relationship between individual characteristics, neighborhood context, and fear of crime. Journal of Criminal Justice, 38(4), 819–826. doi:https://doi.org/10.1016/j.jcrimjus.2010.05.010
- Schacter, D.L., Benoit, R.G., & Szpunar, K.K. (2017). Episodic future thinking: Mechanisms and functions. Current Opinion in Behavioral Sciences, 17, 41–50. doi:https://doi.org/10.1016/j.cobeha.2017.06.002
- Scheider, M.C., Chapman, R., & Schapiro, A. (2009). Towards the unification of policing innovations under community policing. Policing: An International Journal of Police Strategies & Management, 32, 694–718. doi:https://doi.org/10.1108/13639510911000777
- Schuck, A.M., Rosenbaum, D.P., & Hawkins, D.F. (2008). The influence of race/ethnicity, social class, and neighborhood context on residents’ attitudes towards the police. Police Quarterly, 11(4), 496–519. doi:https://doi.org/10.1177/1098611108318115
- Schwibbe, A., & Beauducel, A. (2016). The method of score estimation does not affect main results on gender differences in a Big Five short scale. Psychological Test and Assessment Modeling, 58, 439–454.
- Sivasubramaniam, D., & Goodman-Delahunty, J. (2008). Ethnicity and trust: Perceptions of police bias. International Journal of Police Science & Management, 10, 388–401. doi:https://doi.org/10.1350/ijps.2008.10.4.094
- Skogan, W.G. (1990). Disorder and decline: Crime and the spiral of decay in American neighborhoods. New York: The Free Press.
- Skogan, W.G. (2005). Citizen satisfaction with police encounters. Police Quarterly, 8(3), 298–321. doi:https://doi.org/10.1177/1098611104271086
- Skogan, W. (2009). Concern about crime and confidence in the police: Reassurance or accountability? Police Quarterly, 12(3), 301–318. doi:https://doi.org/10.1177/1098611109339893
- Stanko, E.A., & Bradford, B. (2009). Beyond measuring ‘How good a job’ police are doing: The MPS model of confidence in policing. Policing, 3(4), 322–330. doi:https://doi.org/10.1093/police/pap047
- Valera, S., & Guàrdia, J. (2014). Perceived insecurity and fear of crime in a city with low-crime rates. Journal of Environmental Psychology, 38, 195–205. doi:https://doi.org/10.1016/j.jenvp.2014.02.002
- Van Craen, M. (2012). Determinants of ethnic minority confidence in the police. Journal of Ethnic and Migration Studies, 38(7), 1029–1047. doi:https://doi.org/10.1080/1369183X.2012.681447
- Vianello, M., Schnabel, K., Sriram, N., & Nosek, B. (2013). Gender differences in implicit and explicit personality traits. Personality and Individual Differences, 55(8), 994–999. doi:https://doi.org/10.1016/j.paid.2013.08.008
- Warr, M. (2000). Fear of crime in the United States: Avenues for research and policy. Criminal Justice 2000, 4, 451–489.
- Wortman, J., Lucas, R.E., & Donnellan, M.B. (2012). Stability and change in the Big Five personality domains: Evidence from a longitudinal study of Australians. Psychology and Aging, 27(4), 867–874. doi:https://doi.org/10.1037/a0029322