
ABSTRACT
Ireland used to be a laggard in implementing modern fatherhood policies compared to its European neighbours. In 2016, it was one of the last EU countries to introduce paid paternity leave and three years later parental leave. These reforms indicate that Ireland is moving away from the US model of fatherhood to a social investment state closer to the Swedish model of shared parenthood. With the introduction of Paternity Benefit the Irish government aimed to achieve a take-up of about 46–61%, which is used as a yardstick to evaluate its success. First, this article assesses paternity leave take-up comprehensively through four different rates based on administrative and aggregate data. Overall, take-up had been increasing initially, but levelled already after four years at the lower government target. This is puzzling as countries with similar reforms reported a constant increase and higher take-up over time. Second, drivers for the low take-up are discussed. Specifically, occupational and class inequalities are key factors as only 55 percent of the male workforce have access to occupational top-ups in addition to the relatively low statutory benefit. Without increasing benefit generosity, take-up will stabilize at the rather modest levels in comparison to other European welfare states.
Ireland has been late in embracing modern fatherhood and shared caring roles. As a liberal – almost radical – welfare state within Europe, the Irish welfare state has a strong element of family-related benefits, relies on redistribution via income tax and housing wealth is a major element of welfare provision (NESC, Citation2020). Traditional social protection schemes are the backbone of the redistributive system, while social services remain underdeveloped. Up until the mid-2000s ‘patriarchal-familism perspectives’ (Rush, Citation2011, p. 52; Citation2015) and the ‘absent family breadwinner’ (Rush, Citation2005) dominated the domestic, US-influenced, discourse on fatherhood. The Irish family policy development was more concerned with moral policies (e.g. sexual reproduction, divorce) than with implementing income support schemes and gender equality (Fahey & Nixon, Citation2014). New egalitarian ideas of fatherhood hardly featured in public discourse and policy development. While most of Europe embraced and incorporated at least elements of the Scandinavian social investment agenda (Van Kersbergen & Hemerijck, Citation2012), Ireland remained a laggard. Free early childhood education (2009) and labour market activation (2012) had been adopted late (Köppe & MacCarthaigh, Citation2019). In particular the introduction of early childhood education was a crucial departure from Ireland’s maximum private responsibility model of childcare, which had relied primarily on stay-at-home mothers, unregulated and informal childminders and for-profit private providers (Rush, Citation2006).
Within this context of adopting some social investment policies around the financial crisis, Ireland lacked any paid parental or paternity leave until September 2016. Since then fathers have access to a statutory paid paternity leave for two weeks, which constitutes initial steps toward the Swedish model of fatherhood in the Irish policy context (Rush, Citation2011).
With a focus on the new Irish paid parental leave, called Paternity Benefit, this article makes two contributions to the literature on take-up of family leave policies. First, how many fathers are taking leave in Ireland? The take-up of Paternity Benefit is measured comprehensively by four different rates between 2016 and 2020. Throughout the analysis the political goal of 30–40,000 claimants is used as a benchmark to evaluate take-up nationally. Second, the analysis points out the socio-demographic inequalities that are associated with take-up of paid paternity leave, in particular the occupational segregation of employer top-ups.
Within the literature, paternity and parental leave are often used interchangeably, with most studies focussing on parental leave and the associated father quotas (inter alia Moss et al., Citation2019). Parental and paternity leave, although similar, differ considerably and take-up rates cannot be compared. In the Irish context, fathers also have the option to take paid parental leave since 2019, but the empirical analysis focuses on the Paternity Benefit (paternity leave) and will discuss the potential implications for the more recent Parents’ Leave and Benefit (parental leave) in the conclusion.
The following section briefly discusses the data, indicators and methods used. The three empirical sections discuss first the policy design, including the emerging occupational inequalities. The policy aims stated by key policy-makers are used as the yardstick for the subsequent policy evaluation of benefit take-up. The findings of take-up and inequalities are then discussed in light of the policy design and what general lessons can be learned from the Irish case in the conclusion.
Data and methods
For the policy description and associated policy aims I refer to government publications and press releases. In addition, the overview about the occupational benefit schemes is based on company surveys from the Irish Business and Employers Confederation (Ibec Research Unit, Citation2016, Citation2020b).
In the literature, four different take-up rates can be identified (Bruning & Plantenga, Citation1999; Lohmann et al., Citation2009; Whitehouse et al., Citation2007) and each of the rates has specific shortcomings and advantages. Therefore, all four rates are used in the empirical analysis to gain a more comprehensive understanding of the take-up patterns. In the following each rate used, (1) crude rate, (2) adjusted rate, (3) eligibility rate and (4) gender rate, is described in brief and further technical details are provided in the appendix (A.1).
First, the crude rate measures the number of fathers taking leave divided by the number of births. This rate is used by the majority of studies and is based on the assumption that paternity leave is universal and all fathers would take the leave. In countries without paid leave the recorded uptake is very low (below 0.5%, Zagorsky, Citation2017), while countries with low statutory benefits report considerably higher, albeit still low, take-up (25% South Korea, Kramer et al., Citation2019). More generous schemes report take-up rates between 40 and 75 percent (Escot et al., Citation2014; Koslowski & Kadar-Satat, Citation2019; O’Brien & Koslowski, Citation2017; Sjögren Lindquist & Wadensjö, Citation2006, p. 217). Over time, studies have shown that take-up increases with maturity (Escot et al., Citation2014) and when generosity is increased (Mayer & Le Bourdais, Citation2019).
Second, Bruning and Plantenga (Citation1999) proposed to calculate user rates, which is the average number of paternity leave claimants divided by the average number of working parents with children. This user rate approximates eligibility through the work status of fathers, but does not accurately measure eligibility, because previous contribution periods are not considered. While Bruning and Plantenga (Citation1999) were suggesting their metric for microdata, it is often difficult to identify working fathers with aggregate labour force survey data. Therefore, I am suggesting an adjusted rate for aggregate data, which modifies the crude rate to take into account the employment rate of men most likely being in the age group of fathers with small children (for details see A.1).
Third, Lohmann et al. (Citation2009, p. 38) advocate for an eligibility rate based on national labour surveys to identify employed parents with sufficient social insurance contributions with a child under the age of one as the denominator to calculate the rate of leave takers. This is the most data-demanding rate and is increasingly used to measure leave take-up in surveys (inter alia Drew & Watters, Citation2014; Whitehouse et al., Citation2007), but less in the context of administrative data. In the analysis, I use the official Central Statistics Office (CSO) eligibility rate, which is reported annually and is only available for 2017 and 2018.
Finally, a fourth rate used in the literature focusses on gender equality of take-up, which I label the gender rate. Daly and Rush (Citation2018) define the gender rate as the percentage of paternity claimants by maternity claimants. Compared to the previously discussed rates, the gender rate is not using fathers as the denominator, but mothers taking leave. Fathers and mothers experience very different employment histories, labour force participation rates or care norms and, therefore, take-up of paternity and maternity leave is shaped differently. Yet, in contrasting the total claimants by mother and fathers, the rate emphasizes relative gender differences in take-up and provides additional insights to understand overall take-up pattern of fathers.
Despite attempts to collate paternity leave take-up (Koslowski et al., Citation2020) there is no international database on paternity leave take-up nor a consistent reporting standard. Yet, Koslowski et al. (Citation2020) list take-up rates for 13 out of 28 EU countries. Although the reference years vary considerably, on average a crude rate of 68 percent and an eligibility rate of 78 percent is reported (own calculation). Furthermore, compared to other jurisdictions with regular and high-quality survey data on paternity take-up (Koslowski & Kadar-Satat, Citation2019; Stropnik et al., Citation2019), Ireland lacks a survey with sufficient sample size to estimate take-up across the population of fathers. Also, register data is not accessible as in most Scandinavian countries (inter alia Naz, Citation2010).
Therefore, each rate is based on aggregate administrative data of benefit recipients. The indicators draw on combining official statistics from the CSO and the Department of Social Protection (DSP), which are further detailed in the appendix (A.1).
In comparison to the more detailed register data, there are limitations to identify the socio-economic profile of recipients. Yet, compared to surveys, the administrative data gives a more reliable and valid estimate of take-up across the population. Since only aggregate data is available, the analysis of the four rates is limited to descriptive statistics over time.
In sum, all four rates will be used to address the two aims of this study: (a) to measure take-up with administrative data to gain a comprehensive understanding of the take-up among fathers in Ireland, and (b) to disaggregate take-up by key socio-demographic characteristics to identify drivers for low and unequal take-up.
Paternity Benefit policy
The Paternity Benefit was introduced in September 2016 (DSP, Citation2015). The rate and eligibility criteria are the same as for the maternity benefit and are summarized in .
Table 1. Paternity benefit policy.
In general, employees require 39 weeks of social contributions, while self-employed are eligible after 52 weeks of contributions and both have to be in employment when applying for Paternity Benefit (for details see Government of Ireland, Citation2016). Fathers are entitled to 10 working days of paid Paternity Benefit, which equals two working weeks. There is some flexibility when to take leave: Paternity Benefit can be taken up to 6 months after the child’s birth, but it has to be taken in 2 consecutive weeks. If the welfare offices are notified, the benefit can also be received while staying abroad. The original statutory rate in September 2016 had been €230 per week, which increased in subsequent years with other welfare payments as part of general adjustments in the annual budget (; Daly & Rush, Citation2018; Daly & Szelewa, Citation2020). According to standardized replacement measures, the flat rate covers about 36% of the net average wage in 2015 (Parental Leave Benefit Dataset (PLB), Nelson et al., Citation2020). Microdata estimates indicate a slightly higher actual compensation rate of 41% in 2009 for maternity claimants, which still places Ireland at the bottom quarter of the EU (Bártová & Emery, Citation2018). Although the replacement rate is very low in international comparison (Koslowski et al., Citation2020), the current weekly rate of €245 (2021) is only slightly lower than the state pension (€248.30) and considerably higher than other contribution-based statutory welfare benefits like sick leave or unemployment benefit, which are capped at €203 per week.
Similar to the United Kingdom (Wiß & Greve, Citation2020) some employers top up the flat-rate statutory benefit, often at the full salary, but with considerable differences between public and private sector employees.
For the private sector, the Irish Business and Employers Confederation (Ibec) conducts regular surveys among their members on the occupational benefits that are offered. The 2016 and 2020 surveys are not fully representative nationally, but give the most accurate insights into the occupational paternity schemes offered to date (Ibec Research Unit, Citation2016, Citation2020b). For instance, the number of companies in foreign ownership increased from 41% to 61% between both surveys, although foreign companies only made up 1% of all companies in 2016 (CSO, Citation2018b). Yet, foreign-owned enterprises accounted for 20% of employees and for a turnover of more than 50% in the Irish economy. Hence, the oversampling of foreign-owned companies gives a more accurate picture of their influence on the Irish economy, although it is not a representative share of employees in Ireland. Hence, changes over time in have to be interpreted with care.
Table 2. Percentage of private companies offering occupational top-ups.
Between 2016 and 2020, the share of companies paying over and above the statutory paternity benefit increased from 37 to 52 percent (). Yet, there is a large variation among employers and sectors. Overall, larger and foreign-owned companies in the urban centres are more likely to offer top-ups. Moreover, about 61% of financial service and 75% of telecom companies offer a top-up, compared to only 27% of retail companies in 2016. Within four years, small (<100 employees) and Irish-owned companies are offering more top-ups. Although overall occupational coverage has increased, sectoral and regional variations remained at similar levels.
In 2020, those companies that provide a top-up, most pay the top-up for the full statutory period (84%), which increased from 68% in 2016. Furthermore, most companies replace the full wage. This increased from 67% to 72% between 2016 and 2020. Other companies offer lower replacement rates or shorter duration (mostly less than a week). Eligibility criteria vary also considerably in 2020: 42% of companies require a statutory period of 9 months or less, 47% require a longer period and 11% have not stated the requirement. This means accessing occupational benefits requires a slightly longer contribution period than the statutory benefit.
As pointed out earlier, the 2016 Ibec report is not representative and results are not weighted. Nevertheless, the disaggregation by company size gives some indication of the share of employees in the private sector who have access to Paternity Benefit top-ups. For instance, the report states that only 24% of companies with less than 50 employees offer a top-up and their share in the survey is slightly below 6 percent. However, about 49% of employees work for such small companies in 2016. I extrapolated this for all employees (see A.2, CSO, Citation2018b) and estimate that 40% of employees in the private sector could access top-ups in 2016.
There is also variation within the public sector. All civil servants are entitled to full pay during the two weeks leave, which also extends to large public sector employers like universities and semi-state bodies. Ireland also has a large voluntary sector that depends on public funds and would be counted as public sector employees, but there is no information about leave entitlements in the voluntary sector available. Given these limitations, public sector workers, who represent about 15–17% of the total workforce (see A.3; CSO, Citation2017), would have access to a generous top-up that covers 100% of their salary.
In sum, considering the share of public and private employees in the Irish economy, about 55% of all working fathers would have access to occupational benefit top-ups (own calculation, 2020), leaving a large share of fathers, including the self-employed, only with the statutory flat-rate benefit.
Since November 2019, each parent is also entitled to non-transferable paid parental leave (Parent’s Leave and Benefit) for the duration of 2 weeks (Daly & Szelewa, Citation2020). Since April 2021 the paid parental leave has been increased to 5 weeks. The rate and eligibility criteria are the same for paternity and parental leave, but far less private employers provide top-ups for paid parental leave (Ibec Research Unit, Citation2020a) and there is no provision for top-ups in the public sector (Human Resource Management in the Civil Service, Citation2021).
Since the introduction of paid parental leave with non-transferable quotas, fathers can avail of much more paid time off than at the introduction of Paternity Benefit in 2016. Yet, the additional parental leave is unlikely to influence paternity take-up, due to the non-transferable benefit of both schemes and the less common occupational top-ups for parental leave. Also, the extension of the paid parental leave was only announced in Autumn 2020 and enacted in April 2021, which is unlikely to have an effect on delaying a Paternity Benefit claim during the observation period up to December 2020.
Take-up benchmark
The introduction of the Paternity Benefit spanned two years under the auspices of two governments between 2014 and 2016. Over this period several vague policy aims were associated with the introduction of the Paternity Benefit (DSP, Citation2016), but the government formulated very specific aims regarding anticipated claimant figures. All three responsible government ministers referred to an internal DSP estimate of 30–40,000 claimants (Dáil Éireann, Citation2016a, Citation2016b; Seanad Éireann, Citation2016). The upper threshold also matches the budget estimation of €20 million per annum, although 40,000 claims would only cost €18.4 million for two full weeks. The source and basis of this estimation are not revealed in public documents, but it features in different press releases and public speeches as a benchmark. Assuming these estimates are based on birth rates in 2015 – the period of policy design – this would resemble a crude take-up rate of about 46–61% among all fathers.
Although this estimate is cited widely, ministers also acknowledge its limitations. A written parliamentary answer by the Minister for Social Protection, Leo Varadkar, asserts ‘it is very difficult to estimate the numbers that will take up paternity leave’ (Dáil Éireann, Citation2016b). A couple of weeks later the Minister of State at the Department of Justice and Equality, David Stanton, confirms that ‘it is very difficult to estimate accurately what the actual take up will be’ (Seanad Éireann, Citation2016). In the same vein, the deputy prime minister, Frances Fitzgerald, states ‘there has varying take-up in other countries […]. In the UK, for example, there was a 50% take-up, so it will be very interesting to see what the actual take-up of this new benefit will be in Ireland’ (Dáil Éireann, Citation2016a).
Despite these acknowledged limitations by the policy-makers, the take-up rate of 46–61% is a suitable policy benchmark to assess the actual take-up. Also, it has to be noted that the cited total number is sensitive to changes in the birth rate. Between 2009 and 2020 the birth rate has been declining continuously. Therefore, the rate is based on births in 2015 when the budget vote occurred and civil servants most likely estimated take-up. Throughout the empirical analysis this government benchmark is used to evaluate take-up in the Irish context.
Results: sluggish take-up
depicts the four different take-up rates (crude, adjusted, eligibility and gender), which are discussed in turn.
Figure 1. Paternity Benefit take-up rates by quarter.
Source: (CSO, Citation2019; Citation2020, table 5; DEASP, Citation2018; DSP, Citation2021; Eurostat, Citation2021). Notes: own calculations see A.1. Crude rate = claimants / number of births. Adjusted rate = claimants / (employment rate * number of births). Eligibility rate = eligible fathers are the reversed non-take-up rate. Target population are male workers with sufficient social insurance record aged 15-44. Gender rate = paternity claimants / maternity claimants. *Q4 2016 includes September claimants. ^ rate refers to annual data.
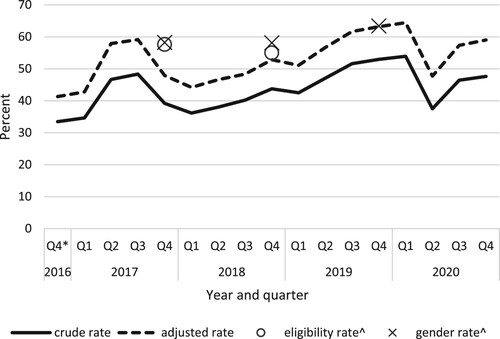
First, the crude claimant rate per number of births shows an overall increase until mid-2017, reaching almost a 50 percent take-up rate. Since then the rate dropped to nearly the starting figure in the first quarter of 2018 and gradually recovering up to early 2020. When the Covid-19 pandemic hit in the second quarter of 2020, the claimant rate drops again significantly and recovers slowly, although not reaching pre-pandemic levels.
Second, the adjusted rate takes the employment level of the typical fathers into account and shows overall the same trend, albeit 9.6 percentage points higher on average (see also , 20- to 49-year-olds). The advantage of the adjusted rate is that it considers better the eligibility criterium of being in work. Between 2016 and 2020 the average take-up rate stands at 44 percent for the crude and 53 percent for the adjusted rate.
Third, the eligibility rate can be regarded as the most reliable and valid (CSO, Citation2020) and overall, confirms the estimates of the previous rates. Moreover, the eligibility rates show a slight decline between 2017 and 2018 which is also evident in the quarterly figures.
Fourth, the gender rate was at 58% in 2017 and increased slightly to 63% in 2019 (Daly & Rush, Citation2018). Compared to the previous rates, the gender rate captures overall eligibility in the context of the female take-up and provides a very good estimate for gender inequality. Despite the slight increase in take-up according to this measure, 40% of fathers are not taking leave compared to mothers.
In sum, across the observation period the absolute take-up is consistently below the lower policy target of 30,000 claimants annually. Despite the observed quarterly fluctuations, the crude rate has increased continuously, meeting the lower government target of 46% since 2019. The other rates confirm this overall trend and also indicate reaching policy maturity as growth rates seem to have levelled. While take-up plummeted with the onset of the coronavirus pandemic, it has not fully recovered to pre-pandemic levels.
Discussion
Rates compared
How do the four rates of take-up contribute to our general understanding of benefit take up? Pre-reform, about 51% of fathers, who had been eligible for fully paid paternity leave of mostly 3 days through their employer, took the occupational leave (Drew & Watters, Citation2014). The longer statutory scheme achieves a higher eligibility rate, although not all fathers will receive full pay as in the Drew and Watters (Citation2014) sample. Still, the take-up only reaches the lower government target.
Second, the average rates reported in Koslowski et al. (Citation2020) provide a reference point for comparisons across EU countries, although the duration and benefit level for these reported rates varies considerably (see above). In a nutshell, it means Ireland’s take-up rate is considerably below the EU average (68% crude rate, 78% eligibility rate).
Koslowski et al. (Citation2020) also point out that substantial increases of take-up – ranging between 10 and 40 percentage points – occurred, when the duration and replacement level had been increased. In the absence of any plans to increase generosity in Ireland, steep increases of take-up are unlikely. The current trend rather suggests a maturity around the lower take-up benchmark predicted by the Department of Social Protection.
The comparison across the four rates also allows to draw some wider conclusions for future data collection and reporting practices. First, the quarterly crude and adjusted rates are earlier available through standard vital statistics and surveys of most national statistics offices. Second, these rates are also relatively easy to calculate as most administrations report claimants and certainly vital birth statistics. And finally, the quarterly data enables to plot a more fine-grained time series and facilitates to identify the effects of key events early on, such as the decline of claims at the beginning of the Covid-19 pandemic.
Second, although the eligibility rate is most accurate, the gender and adjusted rate provide robust estimates without the same demanding and costly data requirements. Of course, the most valid measure remains the eligibility rate as it takes into account key benefit eligibility criteria and matches it across administrative databases that provide accurate and precise information about social insurance contributions and changes in family status. Congruently, the gender rate estimates are very close to the eligibility rate without much less data requirements and estimation efforts. At least for paternity and maternity claims, this works very accurately as take-up of maternity benefits is mandatory for working mothers in most advanced economies for the first three months after childbirth. In contrast, take-up of parental leave is voluntary for working mothers and lacks the benchmark of almost universal take-up among eligible mothers, so that the eligibility rate would remain the gold standard to measure parental leave uptake among both parents. Also, the adjusted rate is close to the eligibility rate, but underestimates take-up by 6–7 percentage points during the observation period.
Finally, any discrepancy between the crude and eligibility rate is insightful in comparative studies to identify access issues for disadvantaged groups. A large difference between both rates would indicate that a large number of fathers cannot claim the benefit due to eligibility issues. Of course, differences between the two rates are closely related to policy design and eligibility criteria. For quasi universal paternity leave, the crude rate is a very appropriate measure. For instance, the Icelandic paternity leave covers unemployed and students, albeit on a lower flat rate than employed fathers (Sigurdardottir & Garðarsdóttir, Citation2018). Hence, the crude rate is a very accurate measurement for the Icelandic universal benefit to identify barriers to benefit take-up. In contrast, the eligibility rate would be the more accurate rate for the Irish case, due to the more restrictive eligibility criteria related to social contributions and employment status.
Thus, all rates contribute to a comprehensive understanding of take-up among fathers. Each rate has strengths and weaknesses, which have to be considered critically when referring to headline figures. Certainly, any of these rates is far more informative than reporting total claimant figures, which lack any contextual information and cannot be compared across welfare states.
Drivers of take-up
Taking these findings together this section discusses four key structural drivers that are associated with low take-up in the literature and for which disaggregated data is available. As in the previous section, the analysis relies on descriptive statistics and critically reflects on the statutory and occupational policy features as context variables.
First, from other countries we know that fathers are more likely to take their leave during summer and Christmas holidays (inter alia Ekberg et al., Citation2013). Although the overall quarterly trend shows some variation, this cannot be attributed to holiday seasons. The monthly take-up in 2017 and 2018 does not reveal any seasonal pattern (see A.4). Sigurdardottir and Garðarsdóttir (Citation2018) have shown for Iceland how take-up of paternity leave has decreased after the economic crash in 2008 and the Irish take-up data suggests a similar effect after Covid-19 lockdowns affected Ireland’s economy and labour market in the second quarter of 2020. Should fathers have postponed their benefit claim at the onset of the pandemic, one would expect an above-average rate in the fourth quarter of 2020. On the contrary, shows that overall take-up is considerably lower since the pandemic struck. Further analysis has to show how the economic shock of the pandemic interacted with altered working environments on take-up.
Second, although self-employed workers are eligible, they face stronger challenges to take time off from work. They might lose clients and contracts and would only receive the statutory benefit. Considering that Ireland has a relatively high self-employment rate of about 25% among male workers (own calculations, CSO, Citation2018b), this reduces the pool of fathers that can take leave without direct financial consequences.
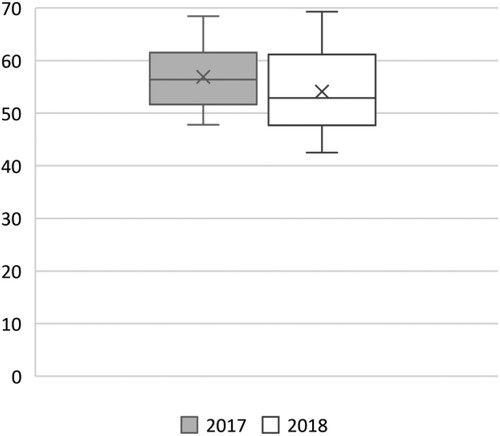
Third, the low flat-rate benefit is not attractive for medium- and high-income earners that have no occupational top-up as the statutory benefit only replaces about 36% of average net income (Nelson et al., Citation2020). CSO (Citation2020) analysis of the eligibility rate by industrial sector shows fathers in sectors with high occupational coverage like education, public administration, industry and finance report above-average take-up. Fathers in hospitality, construction and agriculture have the lowest uptake, representing sectors with lower likelihood to provide occupational top-ups. shows further analysis of the variation by industrial activity over time. The longer whiskers of the boxplots in 2018 suggest increasing sectoral segregation of take-up, which is driven by sectoral division of employer top-ups.
Figure 2. Variability of take-up by industrial activity, eligibility rate.
Source: own calculations, 14 sectors considered (CSO, Citation2020).
Fourth, age of fathers matters. compares the age of claimants and the age of all fathers in 2017 and the difference between both indicators is displayed as percentage points at the top of the bars. The claimant data is limited in its representativeness as it refers to current recipients on 31 December 2017. In other words, it only shows a fraction of claimants on a specific day and we have to assume that the father’s age is normally distributed across the year. Yet, this is the only official socio-demographic disaggregation of claimants provided by the Department.
Figure 3. Age distribution of claimants and fathers at birth of child, 2017.
Source: (CSO, Citation2018a; DEASP, Citation2018) Notes: Own calculation. Paternal age: Fathers age unknown not displayed (3%), N=62,053. Claimants: recipients on 31 Dec 2017, N=875, No claimants under 20 and 55+ reported. Value label shows percentage point difference between claimants and paternal age.
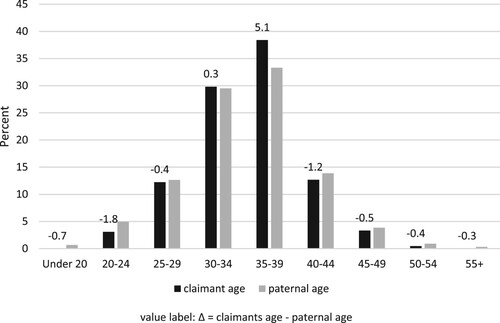
Despite these limitations, indicates that claimants are overrepresented in the 30–39 age group, and underrepresented in the younger and older age groups compared to the age brackets of all fathers. With the available data, we cannot prove the underlying reasons for the observed age effect, but two hypotheses can be constructed. First, older fathers might hold on to more traditional roles, while fathers in the middle age brackets seem to take on new caring roles. Second, younger fathers might not have built up sufficient social contributions to claim Paternity Benefit. However, the comparison of these aggregate figures only indicates a possible relationship and further microdata analysis would be required to assess if and how age is related to take-up.
Conclusions
The government’s aim was to achieve at least a take-up rate of 46 percent (crude rate). Although the take-up rate remained below the government target initially, the most recent quarterly figures suggest that this minimum target is met. Take-up ranges between 40–60 percent, depending on the used measure. The most accurate estimates suggest take-up above 50 percent (eligibility, adjusted rate). After about four years take-up is at a comparatively low level within the EU. For instance, Ireland shares a similar paternity leave policy design as the UK (Koslowski & Kadar-Satat, Citation2019), but has about 25 percentage points lower take-up (adjusted rate).
With regard to shortcomings in the policy design and future reforms, the current arrangement of statutory flat-rate benefits and occupational top-ups contributes to occupational and class inequalities. Employees in larger companies and the public sector, often associated with a higher qualified and well-paid workforce, benefit from these fringe benefits, while working-class employees and self-employed are left out. Moreover, the age profile revealed that older fathers seem to stick to traditional caring roles and younger fathers seem to be excluded due to insufficient social contributions. In particular, the latter group could benefit from eligibility criteria that also consider periods of full-time education.
In the wider context of welfare regime change, the findings reveal a discrepancy between far-reaching policy aims, implemented policy reforms and limited behavioural change. After a lengthy public discourse, the Irish welfare state caught up on the social investment agenda and Irish fathers are challenging traditional caring roles, at least for two weeks. In contrast to the US-American-influenced traditional Irish perceptions of fatherhood between 1970 and the mid-2000s (see Rush, Citation2011), Ireland began a restrained journey towards a Swedish ideal of gender equality and shared parenting.
Yet, while the policies are modernized, only half of Irish fathers complement their traditional breadwinning role with a caring role. The structural policy deficiencies (low replacement rate, occupational inequalities) create two worlds of fatherhood within Ireland. Following Rush’s (Citation2015) analogy, half of Irish fathers embrace the Swedish model for a short period of time, while the other half remains within the US frame of reference.
In addition, whilst social protection schemes are updated, social service provision still lags behind. Irish childcare is one of the most expensive in the OECD and enrolment rates for 0–3-year-olds remain below the Barcelona targets (EC, Citation2018). Limited child and elderly care services contribute to higher informal female care work and continued traditional roles for men. To fully embrace a more egalitarian culture of fatherhood further service investment would be needed.
So far, Ireland has introduced the basic leave policies for a Swedish world of fatherhood that can be further expanded in duration and better-paid leave with the aim to increase take-up. The new Work-life Balance Directive (Directive (EU), Citation2019/Citation1158, Citation2019) enshrines a non-transferable paid parental leave of 2 months at the rate of statutory sick pay into EU law, which Ireland had to implement by August 2022, but is still not enacted at the time of writing (October 2022; Oireachtas, Citation2022). Even though both paid leaves – paternity and parental – enable parents to share leave more equally and for a longer duration, rather modest statutory net replacement rates will deter fathers on medium to higher incomes without access to occupational top-ups.
This analysis has not only contributed to a critical assessment of paternity leave take-up, but also highlighted data gaps. The European directive requires member states to report ‘aggregated data on the take-up of leaves’ (Directive (EU), Citation2019/Citation1158, Citation2019, art. 18(1)), which might reduce some of the discussed limitations when comparing take-up rates. The analysis has shown that take-up of leave should be measured with multiple indicators. Each of the four rates used has strengths and shortcomings. Less data demanding measures like the crude and adjusted rate provide sufficiently accurate and rapid monitoring data, while the more data- and resource-demanding eligibility rate provides the most valid and reliable measures. In addition, the gender rate complements these base rates, in particular to monitor progress of the EU gender equality policy and wider policy reforms related to modern fatherhood.
As discussed, aggregate figures can give an indication of overall trends, but provide limited insights of socio-economic differences. Moreover, detailed survey microdata is not available in sufficient sample sizes to measure paternity leave take-up and occupational benefit policy information is scattered and often not available to the public. In order to fully assess the effects of paternity leave and benefit on changing caring roles and a better work-life balance, the available data infrastructure has to improve substantially.
Supplemental Material
Download PDF (207.3 KB)Acknowledgements
This article is dedicated to the late Dr Mick Rush, who was still advising with a sharp mind on an earlier draft, while already knowing these might be one of his last academic comments. Students in my course Policy-making, Implementation and Evaluation inspired some analytical steps, thanks for those excellent ideas in the 24-hour exam. Thanks to Geraldine Anderson (Head of Research at Ibec) for sharing data on occupational paternity leave. I am also grateful to Alison Koslowski and Hannah Zagel for their comments on earlier versions.
Disclosure statement
No potential conflict of interest was reported by the author.
Data availability statement
Almost all data used is publicly available and all sources and indicators are detailed in the supplementary data file. Moreover, the data table in A.1 contains the raw data and derived indicators for . The Ibec reports used are only accessible to members and to researchers on request and, therefore, the data cannot be shared.
References
- Bártová, A., & Emery, T. (2018). Measuring policy entitlements at the micro-level: Maternity and parental leave in Europe. Community, Work & Family, 21(1), 33–52. https://doi.org/10.1080/13668803.2016.1202196
- Bruning, G., & Plantenga, J. (1999). Parental leave and equal opportunities: Experiences in eight European countries. Journal of European Social Policy, 9(3), 195–209. https://doi.org/10.1177/095892879900900301
- CSO. (2017). EHQ10, Public Sector Employment and Earnings Central Statistics Office. https://www.cso.ie/en/releasesandpublications/ep/p-bii/businessinireland2018.
- CSO. (2018a). Births classified by age-group of father in Ireland, in 2017 (personal communication with vital statistics unit 23/11/2018). Central Statistics Office.
- CSO. (2018b). Business in Ireland 2016. https://www.cso.ie/en/releasesandpublications/ep/p-bii/businessinireland2018.
- CSO. (2019). Vital Statistics. VSQ04 Total Births, Deaths and Marriages Registered by Statistic and Quarter (1960Q1-2018Q1). Retrieved 11/03/2019 from https://data.cso.ie/table/VSQ04.
- CSO. (2020). Employment analysis of maternity and paternity benefits 2016-2019. Central Statistics Office. https://www.cso.ie/en/releasesandpublications/er/eampb/employmentanalysisofmaternityandpaternitybenefits2016-2019/.
- Dáil Éireann. (2016a). 32nd Dáil, Vol. 914 No. 4, Paternity Leave and Benefit Bill 2016: Second Stage.
- Dáil Éireann. (2016b). 32nd Dáil, Vol. 915 No. 2, question 241.
- Daly, M., & Rush, M. (2018). Ireland country note. In S. Blum, A. Koslowski, A. Macht, & P. Moss (Eds.), International review of leave policies and research 2018 (pp. 212–217). Available at: http://www.leavenetwork.org/lp_and_r_reports/.
- Daly, M., & Szelewa, D. (2020). Ireland country note. In A. Koslowski, S. Blum, I. Dobrotić, G. Kaufman, & P. Moss (Eds.), International review of leave policies and research 2020 (pp. 322–331). Available at: http://www.leavenetwork.org/lp_and_r_reports/.
- DEASP. (2018). Paternity benefit statistics 2016-2018. Department of Employment Affairs and Social Protection. Retrieved 11/03/2019 from https://www.welfare.ie/en/downloads/Paternity-Benefit-Statistics-2018.pdf.
- Directive (EU) 2019/1158. (2019). On work-life balance for parents and carers and repealing Council Directive 2010/18/EU. Official Journal, L 188, 79–93. http://data.europa.eu/eli/dir/2019/1158/oj.
- Drew, E., & Watters, A. (2014). ‘We’re not much use, but good for logistics’: An exploratory study of parenting leaves in Ireland. Journal of International and Comparative Social Policy, 30(3), 245–264. https://doi.org/10.1080/21699763.2014.964286
- DSP. (2015). Over €250 million in Social Protection measures in Budget 2016.
- DSP. (2016). Varadkar and Fitzgerald mark Father’s Day with publication of Paternity Bill.
- DSP. (2021). Quarter 1 2021. Quarterly Statistical Report, 1(1), www.gov.ie/dsp/statistics.
- EC, European Commision. (2018). Barcelona objectives. Publications Office of the European Union.
- Ekberg, J., Eriksson, R., & Friebel, G. (2013). Parental leave – A policy evaluation of the Swedish ‘Daddy-Month’ reform. Journal of Public Economics, 97, 131–143. https://doi.org/10.1016/j.jpubeco.2012.09.001
- Escot, L., Fernández-Cornejo, J. A., & Poza, C. (2014). Fathers’ use of childbirth leave in Spain. The effects of the 13-day paternity leave. Population Research and Policy Review, 33(3), 419–453. https://doi.org/10.1007/s11113-013-9304-7
- Eurostat. (2021). Employment rates by sex, age and educational attainment level (%) [lfsq_ergaed]. The Publications Office of the European Union. Retrieved 20.03.2019 from http://ec.europa.eu/eurostat.
- Fahey, T., & Nixon, E. (2014). Family policy in Ireland. In M. Robila (Ed.), Handbook of family policies across the globe (pp. 125–136). Springer. https://doi.org/10.1007/978-1-4614-6771-7_9.
- Government of Ireland. (2016). Act No. 11/2016 – paternity leave and benefit Act 2016. Irish Statute Book.
- Human Resource Management in the Civil Service. (2021). Leave. Department for Public Expenditure and Reform. Retrieved 29/07/2021 from https://hr.per.gov.ie/supports/leave/.
- Ibec Research Unit. (2016). Paternity Benefit Report 2016. Irish Business and Employers Confederation.
- Ibec Research Unit. (2020a). Parent’s Leave Report 2020. Irish Business and Employers Confederation.
- Ibec Research Unit. (2020b). Paternity Benefit Report 2020. Irish Business and Employers Confederation.
- Köppe, S., & MacCarthaigh, M. (2019). Public service integration in hard times: Merging unemployment benefit and labour activation measures. Administration, 67(2), 137–160. https://doi.org/10.2478/admin-2019-0017
- Koslowski, A., Blum, S., Dobrotić, I., Kaufman, G., & Moss, P. (2020). International review of Leave Policies and Related Research 2020. https://www.leavenetwork.org/annual-review-reports/review-2020/.
- Koslowski, A., & Kadar-Satat, G. (2019). Fathers at work: Explaining the gaps between entitlement to leave policies and uptake. Community, Work & Family, 22(2), 129–145. https://doi.org/10.1080/13668803.2018.1428174
- Kramer, K. Z., Bae, H., Huh, C., & Pak, S. (2019). The positive spillover and crossover of paternity leave use: A dyadic longitudinal analysis. Journal of Vocational Behavior, 115, 103310. https://doi.org/10.1016/j.jvb.2019.05.007
- Lohmann, H., Peter, F. H., Rostgaard, T., & Spiess, K. (2009). Towards a framework for assessing family policies in the EU. OECD Social, Employment and Migration Working Papers, 88. https://doi.org/10.1787/223883627348.
- Mayer, M., & Le Bourdais, C. (2019). Sharing parental leave among dual-earner couples in Canada: Does reserved paternity leave make a difference? Population Research and Policy Review, 38(2), 215–239. https://doi.org/10.1007/s11113-018-9497-x
- Moss, P., Duvander, A.-Z. E., & Koslowski, A. (2019). Parental leave and beyond: Recent international developments, current issues and future directions. Policy Press.
- Naz, G. (2010). Usage of parental leave by fathers in Norway. International Journal of Sociology and Social Policy, 30(5/6), 313–325. https://doi.org/10.1108/01443331011054262
- Nelson, K., Fredriksson, D., Korpi, T., Korpi, W., Palme, J., & Sjöberg, O. (2020). The social policy indicators (SPIN) database. International Journal of Social Welfare, 29(3), 285–289. https://doi.org/10.1111/ijsw.12418
- NESC. (2020). The future of the Irish social welfare system: Participation and protection. Research report 151. National Economic and Social Council.
- O’Brien, M., & Koslowski, A.. (2017). United Kingdom country note. In S. Blum, A. Koslowski, & P. Moss (Eds.), International review of leave policies and research 2017 (pp. 414–426). Available at: http://www.leavenetwork.org/lp_and_r_reports/.
- Oireachtas. (2022). Report on pre-legislative scrutiny of the General Scheme of a Work Life Balance and Miscellaneous Provisions Bill 2022. https://data.oireachtas.ie/ie/oireachtas/committee/dail/33/joint_committee_on_children_equality_disability_integration_and_youth/reports/2022/2022-06-09_report-on-pre-legislative-scrutiny-of-the-general-scheme-of-a-work-life-balance-and-miscellaneous-provisions-bill-2022_en.pdf.
- Rush, M. (2005). Fathers and family policy in Ireland. Studies: An Irish Quarterly Review, 94(374), 171–179. http://www.jstor.org/stable/30095743.
- Rush, M. (2006). The politics of care. In B. Fanning & M. Rush (Eds.), Care and social change in the Irish welfare economy (pp. 46–64). UCD Press.
- Rush, M. (2011). The two worlds of father politics in the republic of Ireland: Swedish versus American influences. Journal of Comparative Family Studies, 42(1), 37–57. https://doi.org/10.3138/jcfs.42.1.37
- Rush, M. (2015). Between two worlds of father politics. USA or Sweden? University Press.
- Seanad Éireann. (2016). 25th Seanad, Vol. 246 No. 15, Paternity Leave and Benefit Bill 2016: Second Stage.
- Sigurdardottir, H. M., & Garðarsdóttir, Ó. (2018). Backlash in gender equality? Fathers’ parental leave during a time of economic crisis. Journal of European Social Policy, 28(4), 342–356. https://doi.org/10.1177/0958928717739243
- Sjögren Lindquist, G., & Wadensjö, E. (2006). National social insurance – not the whole picture. Supplementary compensation in case of loss of income. Report for ESS, 2006:5. Fritzes.
- Stropnik, N., Humer, Ž, Kanjuo Mrčela, A., & Štebe, J. (2019). The problem is in practice: Policy support and employer support for fathers’ participation in childcare in Slovenia. Community, Work & Family, 22(1), 77–95. https://doi.org/10.1080/13668803.2018.1558175
- Van Kersbergen, K., & Hemerijck, A. (2012). Two decades of change in Europe: The emergence of the social investment state. Journal of Social Policy, 41(3), 475–492. https://doi.org/10.1017/S0047279412000050
- Whitehouse, G., Baird, M., Diamond, C., & Soloff, C. (2007). Parental leave in Australia: Beyond the statistical gap. Journal of Industrial Relations, 49(1), 103–112. https://doi.org/10.1177/0022185607072253
- Wiß, T., & Greve, B. (2020). A comparison of the interplay of public and occupational work‒family policies in Austria, Denmark, Italy and the United Kingdom. Journal of Comparative Policy Analysis: Research and Practice, 22(5), 440–457. https://doi.org/10.1080/13876988.2019.1582151
- Zagorsky, J. L. (2017). Divergent trends in US maternity and paternity leave, 1994–2015. American Journal of Public Health, 107(3), 460–465. https://doi.org/10.2105/AJPH.2016.303607