Abstract
The aim of this research is to gain new insights into the extent of economic cooperation between Croatia and countries in the region. We also aim to find out which countries and economic sectors cooperate the most and to establish whether there is a trend to their economic cooperation. The research methodology is based on the construction and implementation of a harmonised cooperation index (HCI), with data on economic cooperation in foreign trade, foreign direct investment and tourism among the countries in the region serving as a basis for index calculation. The article introduces a harmonised index of cooperation for post-transition countries, using a broader base than is traditionally found in the literature. Research results show that the greatest cooperation progress has been achieved in foreign trade, while the potential in two other sectors has not yet been sufficiently exploited.
1. Introduction
Whether economic cooperation among countries contributes to economic growth is the key issue in the area of economic trade and development, also representing one of the most intensely debated ones in economic science in general. Baldwin (Citation2004) and Cappelen et al. (Citation2003) argue that cooperation among countries is important for sustainable economic growth. It affects the creation of demand for domestic products and contributes to an increase in GDP. Although foreign trade is the most significant form of economic cooperation, foreign direct investments (FDI), especially in manufacturing, and tourism are also relevant forms of cooperation among the countries.
While Croatia became a full member of the EU in mid-2013, it continues to be traditionally, historically and economically tied to the countries in its region.Footnote1 In addition to trade links between Croatia and these countries, their relative geographical proximity, language similarity, existing relationships and common history allow for cooperation to be achieved through direct investment, encouraging the interchange of tourists for the same reasons.
The importance of monitoring foreign trade, FDIs and tourism in particular, especially in Croatia, can be found in the balance of payments. To start with, these are important elements of the current and capital account of Croatia’s balance of payments, and deficits or surpluses in those areas determine overall balance of payments developments. Croatia is a small, open economy which depends heavily on foreign currency flows, so researching the source of such flows enables an analysis of the sustainability of the current and capital account of the balance of payments. Also, Croatia is a country with a managed floating foreign exchange rate and a very high level of external debt, of both public and private sectors. It is of great importance for Croatia to improve its international position and improve the current account balance in order to stabilise the exchange rate and ensure timely servicing of its foreign liabilities. For that purpose, it is important to know the real extent of Croatia’s international economic cooperation, notably with neighbouring countries, and to what extent it manages to take advantage of the similarity among regional markets to improve its economic position.
Beside the importance of monitoring foreign trade, FDIs and tourism in the context of the balance of payments, their importance also comes from globalisation and integration processes, where cooperation between countries is an important factor for enhancing GDP growth.
Although the dramatic breakup of Yugoslavia slowed down economic cooperation among the countries in the region, their cooperation began to intensify again with the advance of the new millennium. The aim of this research is, therefore, to gain new insights into the extent of economic cooperation between Croatia and other countries in the region so as to find out which countries and particular economic sectors cooperate the most and also establish whether there is a trend to their economic cooperation.
We test a couple of hypotheses in this article. Our central hypothesis is that economic cooperation significantly increased during the analysed period and that it contributed to GDP developments in the analysed countries. Further, we assume that foreign trade is the most prominent part of regional cooperation, while FDIs and tourism still fail to reach foreign trade cooperation levels.
The research methodology is based on the construction and application of an HCI. The purpose of its calculation is to obtain a reasonable, consistent and comparable evaluation of the overall cooperation between Croatia and other countries in the region. Economic cooperation in foreign trade, direct investment and tourism among the analysed countries serves as the basis for the index calculation.
The contribution of this work is manifold. In addition to the construction of an HCI for post-transition countries for the first time to the best of our knowledge, this article also uses a broader base for index calculation than that traditionally found in the literature. In addition, there are no examples of analysis in the existing literature of foreign trade, direct investment and tourism cooperation among the countries in the region presented by a regional cooperation index, or of analysis of comparative advantages and trade specialisation of Croatian exports in the regional market. The research results provide new insights into the position of the Croatian economy in the region and suggest that the greatest cooperation progress has been achieved in foreign trade, while the potential in two other sectors remains insufficiently exploited as yet.
Following the introduction, the second section of the article discusses empirical studies of regional cooperation in the fields of foreign trade, direct investment and tourism. Part three analyses the trends and structural characteristics of these fields in the countries of the region. The fourth section deals with a presentation of the methodological basis, the calculation and interpretation of the HCI. The article closes with a conclusion.
2. Empirical studies of regional cooperation in the fields of foreign trade, direct investment and tourism
Regional economic cooperation in a narrow sense includes trade only. However, the development of regional economic cooperation shows that an efficient cooperation requires more than a mere elimination of tariffs and quotas, so regional cooperation encompasses other fields, including foreign direct investment and tourism cooperation as well (Schiff & Winters, Citation2003).
Theoretical and empirical studies show that economic cooperation among countries spurs their growth (Vamvakidis, Citation1998). However, most studies are aimed at finding a link between certain categories of cooperation and economic growth, while monitoring the development of economic cooperation through time using a cooperation index has not been covered to any great extent in the literature. Therefore, in this chapter we explore the scope of various analyses of regional cooperation by means of a cooperation index and the extent to which only the determinants of cooperation in the fields of foreign trade, FDI and tourism are analysed.
There has been no application of an analytical framework involving the construction of a cooperation index in recent studies of foreign trade cooperation among countries in the region. The economic transition of the analysed countries, as well as globalisation processes, prompted significant changes in economic relations among these countries. The very effects of these changes on cooperation and foreign trade relations have been the focus of research of most authors. Derado (Citation2006) points to the fact that market liberalisation has failed to foster a trade integration of the region’s countries or growth of their cross-sectoral trade. Similarly, an analysis of trade integration with the euro area shows that the region still lags behind Central European countries (Bussière, Fidrmuc, & Schnatz, Citation2005). Researchers have particularly centred their interest on the significance of the Central European Free Trade Agreement (CEFTA) and its role in the enhancement and development of foreign trade (Ćejanović, Hodžić, & Terzić, Citation2009; Družić, Penava, & Sekur, Citation2009; Kikerkova, Citation2009).
In addition, analysis of the effects of certain macroeconomic variables on foreign trade in the region is another inevitable topic of research. Applying the gravity model, Kersan-Škabić (Citation2011) proves the effects of GDP and distance on trade flows among countries of the region, but not the effects of FDI. Buturac (Citation2009) uses an analysis of trade patterns to prove complementary export structures of the countries in the region, indicating that there are possibilities of joint cooperation in international markets.
Since mid-2008, trade among countries in the region has largely been determined by the economic crisis. At the very beginning of the crisis, it was manifested in a decline of exports and, subsequently, in an import decline as domestic demand also weakened (Buturac & Teodorović, Citation2012). The effects of Croatia’s accession to the EU on trade with CEFTA countries are the topics of the latest research in this area (Ćudina & Sušić, Citation2013). Due to its EU entry, Croatia’s trade relations with third countries are determined by the application of the Common Customs Tariff. The most important foreign market for Croatia outside the EU, measured by the volume of trade, is the market of CEFTA countries. The paper by Ćudina and Sušić (Citation2013) is based on empirical research conducted by calculating the customs burden of Croatia in relations with certain CEFTA countries for groups of agricultural products and foodstuffs. The results indicate that Croatia’s accession to the EU would result in the greatest customs burden, and in turn an export decline in the tobacco, meat and confectionery industry.
Studies of FDIs are predominantly related to analysing the determinants of FDIFootnote2 and their impact on economic growth, employment, exports, productivity, industry development, technology transfer and poverty. While relations between regional cooperation and direct investments are complex, regional cooperation is considered an important stimulus not only to trade but to FDI as well (Brenton, Di Mauro, & Lücke, Citation1999; and te Velde & Bezemer, Citation2006). For example, the common EU market encouraged both mutual direct investment (Brenton, Citation1996) and investments into the countries of Central and Eastern Europe (CEE) due to their expected accession to the EU (Bevan & Estrin, Citation2004; Bevan, Estrin, & Grabbe, Citation2001; Kaminski, Citation2001). Ireland’s accession to the EU has contributed to an increase in FDI, notably from the US, as numerous multinational companies chose Ireland as a hub for their expansion into Europe (Dragusha & Bejleri, Citation2008). Studies on FDI into the countries of the region mainly include analyses of FDI trends in individual countries (Hunya, Citation2002; Vlahinić-Dizdarević & Blažić, Citation2005; Zakharov & Kušić, Citation2003), or determinants of FDI (Botrić & Škuflić, Citation2006; Demekas, Horvath, Ribakova, & Wu, Citation2005; Derado, Citation2013), while direct investment in the context of regional cooperation among the region’s countries has been examined only since all the countries concerned joined CEFTA (OECD, Citation2010).
While studies show that regional cooperation potentially enables a greater level of FDI, they frequently do not focus on analysing whether an increase in FDI comes from other countries in the region or from third countries.Footnote3 In the present study, therefore, we focus on the analysis of intra-regional FDI and, using a regional cooperation index, we monitor the development of regional cooperation through time. In the literature, a similar index can be found for ASEAN (Dennis & Yusof, Citation2003), while UNCTAD publishes FDI Attraction Index and FDI Potential Index for individual countries. To the best of our knowledge, the analysis of FDI cooperation among the countries of Croatia’s region presented by an index of regional cooperation has not been covered by the existing literature.
There are a number of papers which explore cross-border tourism and its impact on the economic growth of a tourist destination, as well as socio-economic impact of tourism on neighbouring countries or countries of the region (Aradhyula & Tronstad, Citation2003; Sofield, Citation2006; Timothy, Citation2001). Also, there are numerous studies of tourist enclaves, such as Cancun in Mexico, and their impact on economic development, environment and culture (Brenner & Aguilar, Citation2002; Britton, Citation1982; Mbaiwa, Citation2005; Shaw & Shaw, Citation1999; Torres & Momsen, Citation2005).
No index of regional cooperation in tourism, at least of the form studied here, can be found in the literature; typically, the most important tourism determinants are used as components of the index covering a wider cooperation area, such as economic growth or sustainability of a region, state or a smaller administrative unit. Accordingly, our index of tourism cooperation is unique in the literature, but still partly relies on studies in other fields. Castellani and Sala (Citation2010) calculated a Sustainable Performance Index of 13 Italian municipalities using, among others, two tourism variables. Their index is a tool designed for policymakers, primarily to help tailor local development measures while also defining a model of sustainable tourism activities in the region. Crabtree and Bayfield (Citation1998) presented a set of indicators to measure sustainability of the Scottish Highlands, using tourism indicators among others. The European Commission – Tourism Sustainability Group (Citation2007) analyses a large number of tourism sustainability determinants, including two indicators used in this article, i.e. the number of overnight stays and tourist spending.
In their review paper on tourism demand, Song and Li (Citation2008) cited no research exploring the region covered by this study, nor did they refer to any papers on regional cooperation in the tourism sector. Of all the countries in the region, only the studies involving Croatia were singled out. That is not surprising since the number of tourists in Croatia has historically been larger than in any other country of the region and globalisation processes started earlier than elsewhere (Bartlett, Citation2009), with the number of tourists on a rising trend after Croatia began accession negotiations with the EU (Coles & Hall, Citation2005).
Finally, there are two studies examining cooperation among some of the countries covered by this study, but using a different approach and objectives. Lagiewski and Revelas (Citation2004) explored barriers to cooperation among Croatia, Montenegro and Bosnia and Herzegovina, and tried to determine how tourism contributed to increased cooperation. In a similar way, Vodeb (Citation2010) examined the development potential of Slovenian and Croatian border areas, and recognised the tourist activity as one of the most important sectors in the development of border areas. Both these studies use qualitative data and surveys, while we opted for a quantitative approach in the form of an index of tourism cooperation which uses publicly available data, and is easy to calculate, present, interpret and apply.
3. Structural characteristics of foreign trade, direct investment and tourism of Croatia and countries in the region
3.1. Foreign trade
3.1.1. Main trends – exports, imports and foreign trade balance
Foreign trade recorded growth in the countries of the region in the between 2000 and 2012. At the same time, export growth outpaced import growth slightly in most countries.Footnote4 The only exceptions were Montenegro and Macedonia, where the compound annual import growth rate exceeded the export rate.
Foreign trade growth was more intense than GDP growth, resulting in a strong increase of the share of international trade in GDP (Table ). What characterised all countries was a considerably larger share of imports than exports in GDP. A greater openness and liberalisation of domestic markets, as well as economic growth, contributed significantly to the import expansion.
Table 1. Countries in the region – main trends in foreign trade.
Such trends marking international trade led to corresponding developments of the trade balance, which is negative in all countries of the region (with imports exceeding exports). Furthermore, these countries are characterised by a strong export concentration. Exports to the three most important export destinations accounted for 48.5% of their total exports in 2012.
Hereafter in this section, we focus on an analysis of the Croatian foreign trade with countries in the region. The analysis of the Croatian foreign trade shows that total Croatian merchandise exports to the countries of the region went through different phases in the period between 2001 and 2012 (Figure ). Exports grew strongly in the period between 2001 and 2008. During this period, exports to the countries of the region grew at an annual rate of 15.9% on average. By comparison, exports to the EU 27 grew at a rate of 6.5%, while total exports grew at a rate of 8%.
Figure 1. Croatian exports to countries in the region and the EU 27, 2001–2012.
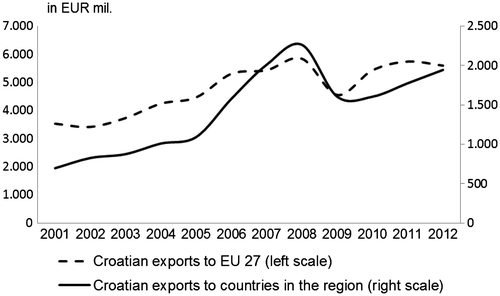
The recession onset in the second half of 2008 contributed to the weakening of demand in the countries of the region, as reflected in a drop of Croatian exports to that market. Since the countries explored here were more severely affected by the recession than Croatia’s most important export destinations in the EU, the decline in exports to the countries in the region was somewhat more pronounced than that in exports to the EU. After the negative trends came to a halt in 2009 and following the 2010 stagnation, a trend of export recovery and growth was established late in 2010. It should be noted that, in spite of the recovery, the value of Croatian exports to the countries in the region has yet to regain the level it had stood at before the recession.Footnote5
On the other hand, an analysis of import trends reveals that Croatian imports from the countries in the region grew considerably faster (13.6%) than did its imports from the EU (2.7%) in the period prior to the recession (2001–2008). Considerable weakening of Croatia’s domestic demand in 2008 and 2009 led to a decline in imports from the countries in the region. A decline in imports from the EU was somewhat more pronounced in the same period. It is obvious that the recession in Croatia, marked by rising unemployment and a real wage and disposable income decline, contributed to an increase in price preferences in relation to product quality. In such circumstances, it was easier for more reasonably priced imported products from the countries in the region to find their way to Croatian consumers. As a result, both the import recovery and the growth of imports from the countries in the region after 2009 by far outpaced the growth of imports from the EU.Footnote6
Before and during the recession, the analysed export and import trends between Croatia and countries in the region determined corresponding developments in the trade balance, where the trade balance with the countries in the region took quite the opposite course to the trade balance with the EU. While Croatia’s trade balance with the countries in the region improved, recording surplus growth in the period between 2001 and 2008, the overall trade balance and the one with the EU deteriorated (deficit growth). The recession period brought about improvements in Croatia’s overall foreign trade balance, as well as its balance with the EU 27. That, however, is not a result of the country’s growing export competitiveness, but of a larger decline in imports than exports in the recession period, and slower import than export growth after 2009.
By contrast, most of the recession period (2008–2011) was marked by declining surplus in trade with the countries in the region. Nevertheless, stronger growth of exports than imports in 2012 resulted in the growth of the trade surplus with all countries in the region (Figure ). Of all other countries in the region, Croatia records the largest surplus in trade with Bosnia and Herzegovina.
The overall structure of exports to countries in the region is dominated by agricultural products and foodstuffs. These are followed by oil derivatives, chemical products and the manufacture of non-metal mineral products. The share of high-value-added products, such as pharmaceutical products or computers and precision instruments, is almost negligible.
In addition to raw materials and semi-finished products, agricultural products and foodstuff prevail in total imports from countries in the region as well. Along with modest current capacities of countries in the region to produce higher value added products, declining domestic demand also contributed to such import structure. The development of price preferences among domestic consumers, which was ultimately reflected in demand for low value added products, was compounded by rising unemployment, a decline in real wages and pessimistic expectations.
To get a better insight into the characteristics of Croatian exports to the regional market, below we will analyse Croatia’s comparative advantages and trade specialisation compared to other countries in the region.
3.1.2. Comparative advantages and trade specialisation of Croatian exports in the regional market
The empirical analysis of comparative advantages and trade specialisation of Croatian exports in the region’s markets was conducted using the following indicators:
| • | Lafay Index (LI) for the analysis of comparative advantages and trade specialisation;Footnote7 | ||||
| • | Grubel-Loyd Index (GL) for the analysis of intra-industry trade;Footnote8 | ||||
| • | Indicator of Export Similarities (ES).Footnote9 | ||||
In addition to the level of technological development achieved and natural resources available, the development of Croatia’s comparative advantages and specialisation in the regional market have been helped considerably by the proximity of the market, a relatively good knowledge of consumer habits and tastes, existing trade relations, as well as a shared part of history with the majority of the analysed countries. Comparative advantages, aggregated for countries in the region, were most pronounced in the trade of foodstuffs and oil derivatives. However, a comparison of comparative advantage and trade specialisation indicators (LI) by individual countries and sectors shows some differences (Table ).
Table 2. LFI Index, GL index and the share of individual economic sectors in total Croatian exports (% EX) in 2012.
Comparative advantages and trade specialisation in the exchange of foodstuffs and oil derivatives are most evident in the market of Bosnia and Herzegovina. At the same time, Croatia does not have significant comparative advantages in the Serbian food market but rather in the chemical products, electrical equipment and oil derivatives trade. There are significant comparative advantages in the exports of chemical products to the Macedonian market and in oil derivatives exports to the markets of Albania and Montenegro.
Greater comparative advantage and trade specialisation in a smaller number of products is not only expected, but also justified in theory for a small country such as Croatia. However, the products concerned include mainly raw material intensive products and labour intensive products, through the exchange of which a lower export unit price is achieved.
Intra-industry trade analysed by the GL index, mostly involves products with a smaller share in total exports (% EX). This may indicate Croatia’s underdeveloped trade and manufacturing cooperation in the leading export sectors with countries in the region.
The potential of this cooperation is best demonstrated by empirical calculations of ES indicators. Specifically, it is evident that Croatia’s export structures are complementary to those of other countries in the region, rather than being competitive to them (Table ). To a certain extent, this indicates the possibility of developing various forms of economic cooperation, such as joint appearance in regional markets and association in purchasing and production chains.
Table 3. ES Indicator.
The biggest differences in export structures are precisely with countries with which Croatia has the largest trade cooperation (Bosnia and Herzegovina, Macedonia and Serbia).
3.2. Foreign direct investment
FDI is an important source of project funding in case of insufficient domestic savings. It can increase competitiveness, employment and exports and, hence, GDP. Interest to invest in the countries of the region is a result of their inadequate capital levels, enabling handsome returns on equity due to a high marginal profitability of capital. However, countries in the region attract considerably less FDI on average than the CEE countries.Footnote10 The total FDI stock in the countries of the region amounted to EUR 57.5 billion in 2011, against EUR 479.8 billion invested in the CEE region.Footnote11 The gap is somewhat smaller when looking at the stock of FDI per capita – it stands at EUR 2,770 in the region, and EUR 4,837 in the CEE region. The stock of FDI per capita exceeds the average of CEE countries only in Montenegro and Croatia (Figure ).
Figure 3. FDI inward stock per capita and total FDI inward stock, in 2011.
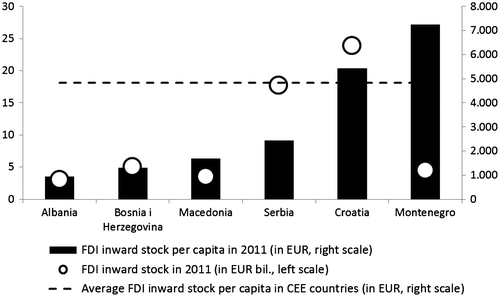
Montenegro has the largest FDI inflows and inward stock per capita mostly thanks to Russian investment into tourism, while Croatia, as the most developed regional economy, attracts relatively more FDI. On the other hand, Albania has the lowest inward stock of FDI per capita due to a later onset of FDI inflows.
Considerably lower levels of investment into the countries of the region compared to the CEE countries are a consequence of lower economic development levels, as well as corruption and less legal certainty (Bogdan, Citation2006). In addition, outdated land registers and cadastral records, slow dispute settlement, time-consuming process of obtaining necessary permits and absence of employment subsidies in most countries of the region hamper the arrival of foreign investors.
The most important FDI partners to the countries in the region come from the EU. In 2010, 64% of FDI stock was from the so-called old EU member states (EU 15) and an additional 15.9% from the new members. On the other hand, only a very small part of FDI refers to intra-regional investment, even though there is a discernible mild upward trend. Of the overall FDI into the region in 2006, only 2.6% (EUR 894 million) was intra-regional investment, while this share increased to 4.1% (EUR 2.2 billion) in 2010. The most important intra-regional investor is Croatia, accounting for 45.9% of the regional investment in 2010, followed by Serbia with 39.2%. Regional investment is of major importance to Bosnia and Herzegovina, where the share of regional FDI stock in total FDI stock stood a 32.1% in 2010. The most important investors in Bosnia and Herzegovina are Serbia, with an 18% share, and Croatia, with a 14.1% share. This is not surprising in view of their economic relations tradition and historical, ethnic and cultural association. On the other hand, regional FDI into Croatia is the lowest.
Regional investment cooperation is not, therefore, as significant as trade cooperation, with most direct investment cooperation taking place between neighbouring countries. The reason for weak intra-regional cooperation may lie in the fact that all the countries included in the analysis are net capital importers, investing only a small part of their domestic savings abroad. These are all relatively underdeveloped countries which need investment for further economic development and, understandably, more investment comes from developed economies than from within the region.
An analysis of FDI in Croatia shows almost negligible FDI from the region. Just 0.3% of total FDI stock in Croatia in 2012 was from the countries in the region, probably because these countries have even less capital than Croatia. The most significant regional investor in Croatia is Bosnia and Herzegovina, with a share of only 0.25% of all FDI in Croatia. Serbia and Macedonia account for virtually negligible 0.05% and 0.01% of total FDI in Croatia, respectively. Footnote12 The picture improves considerably when looking at the share of Croatian investment in the region, although the Croatian investment abroad accounts for just 14.3% of inward FDI in Croatia. Of the total Croatian investment abroad, 34.5% is invested in the region (Figure ). Bosnia and Herzegovina accounts for 48.9% of Croatia’s total investment in the region, Serbia for 40.3% and the remaining 10.8% is invested in Albania, Montenegro, Kosovo and Macedonia. A fairly strong interest of Croatian undertakings to expand in the region, especially in Bosnia and Herzegovina and Serbia, can be put down to a long tradition of Croatian products in the region, as well as to market proximity. Therefore, by expanding in the region, Croatian companies are trying to increase their product sales.
Figure 4. Croatian direct investment stock in the region in 2012, in %.
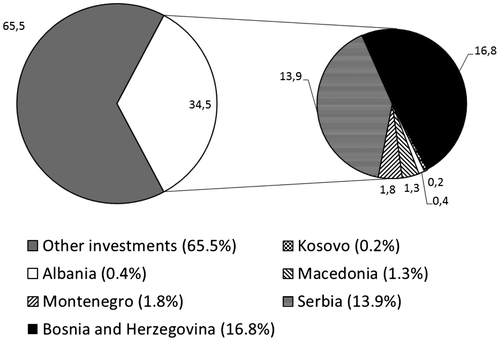
Bosnia and Herzegovina and Serbia have witnessed a considerable increase in Croatian direct investment in the past few years. These two countries are also Croatia’s most important regional trading partners and we can assume that, by increasing investment into these countries, Croatian companies are trying to reduce expected negative effects of leaving CEFTA. Still, despite Croatia’s increasing direct investment in the region since 2010, the largest inflow from Croatia into the region was in the pre-recession period, when the economy in both Croatia and the region grew at relatively high rates.
If there is no agreement between the EU and CEFTA regarding a preferential treatment of Croatian products, further Croatian investment in the region can be expected. Meanwhile, an increase in regional investment into Croatia will depend primarily on the developmental trajectory of regional economies and their desire to reach the entire EU market more easily through Croatia, as an EU member state.
3.3 Tourism
The region consisting of Croatia, Bosnia and Herzegovina, Montenegro, Serbia, Albania and Macedonia is certainly not the most important tourist region in Europe. Altogether, 16.6 million foreign tourists stayed in the area in 2012, recording approximately 73.7 million overnight stays.Footnote13 Although these figures are negligible at the European level, particularly in comparison with tourist powers such as Spain or France (Figure ), they are highly important for the region; while representing an opportunity for economic growth, they are also a challenge in defining the region’s countries as attractive tourist destinations. Figure also shows the number of arrivals corrected according to the size of the countryFootnote14, which leads us to the conclusion that these countries have the capacity to accept a larger number of tourists. Judging by developed tourist destinations, such as Greece or Spain, countries in the region could accept at least 50% more tourists than in 2012.
Figure 5. Tourist arrivals by country and/or region, and arrivals per capita, in 2012.
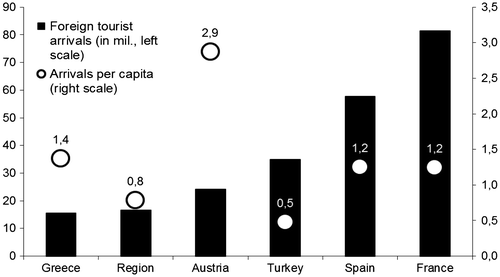
However, while tourism in some countries of the region is a significant industry in itself (Croatia), other countries are only beginning to realise its importance (Macedonia). By contrast, in other countries, such as Bosnia and Herzegovina, tourism is but a marginal activity. In comparison to the other countries of the region and according to the total number of foreign tourist arrivals, Croatia ranks first with 10.4 million arrivals in 2012, accounting for 62.6% of all tourists arriving in the region. It is followed by Albania and Montenegro with 3.4 and 1.3 million arrivals, respectively. Serbia recorded 800,000, Bosnia and Herzegovina 400,000, and Macedonia 300,000 arrivals.
Although the number of tourists visiting the region is small (in absolute terms), high arrival growth rates indicate that the region’s tourism development is definitely accelerating. With Croatia in the lead, Albania and Montenegro follow suit at very high growth rates in tourist arrivals.
According to the World Tourism Barometer data, countries in the region generated a total of EUR 10.6 billion in revenues from tourism in 2011. Croatia accounted for as much as 70% of all revenues in the region, followed by Albania with a 12% share. The remaining 18%, or EUR 2 billion, was split among other countries.Footnote15 At the regional level, the amount of EUR 10.6 billion is equivalent to 2.6 months of goods imports, which means that tourism covers more than one fifth of the region’s total imports. That result motivates the importance of the sector in the framework of international exchange, and current account balancing of the countries in the region. However, tourism earnings are only a small piece of the pie, taking into account that all of Europe earned EUR 361.6 billion from tourism in 2011.
One of the region’s main advantages lies certainly in its proximity to the huge European market, with traffic isolation as an adverse factor which currently prevents the exploitation of the potential based on the proximity of incoming markets. Another important advantage is the price level compared to the countries from which most tourists come. For example, prices in the region in 2011 stood on average at 50% of the prices in the EU. A 50% price difference is attractive to tourists coming from the EU because it means that the visitors’ purchasing power in the region doubles, which is not negligible. Price competitiveness takes on even greater significance in view of the recession and slow economic recovery prevailing in most EU countries. However, price differences may vary drastically among individual countries in the region. While prices in Croatia stand at 68% of the EU level, in the rest of the region they are at just 47% of EU prices, mostly as a result of a higher standard in Croatia.
Croatia is the only country in the region with developed tourism and the leading tourist destination, according to all indicators. However, Croatia’s largest incoming markets are not those in the region but the markets of Western, developed countries. Traditionally, most visitors to Croatia come from Germany, Italy, Slovenia, Austria and the Czech Republic, and they accounted for 60% of total foreign tourist overnight stays in 2012. Visitors from the region account for just 2.8% of total overnight stays, and 3.3% of total foreign tourist arrivals in that same year. They would stay in Croatia for four days on average, which is a day and a half shorter than the average of other foreign tourists.
Looking at the data, one can clearly differentiate between two periods as regards tourist arrivals in Croatia from the region (Figure ). In the period between 1999 and 2008, the number of arrivals and overnight stays of tourists from the region grew at average annual rates of 9.3% and 9.7%, respectively. In 2008, Croatia had the best tourist results recorded since its independence, as the global financial crisis did not strike until the end of summer that year and most countries began to feel the recession only towards the end of the year, when the tourist season had already been over. For the next four years, weak economic activity and rising unemployment, accompanied by prices increases and a decline in disposable income, caused primarily a drop of interest in tourist services, while also reducing the purchasing power of the tourists from the region who had decided to travel. Therefore, the number of tourist arrivals from the region in Croatia declined by 7.6% between 2008 and 2012. The number of overnight stays was affected by the same trend, recording a drop of 10.1%.
Figure 6. Tourist arrivals and overnight stays in Croatia from the region, 1999–2012.
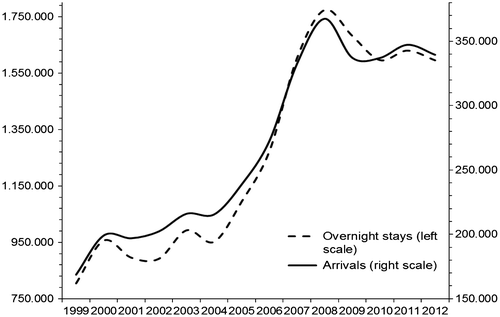
A similar pattern is repeated when looking at the dynamics of the number of arrivals by countries. The number of tourist arrivals from Macedonia to Croatia fell by as much as 30.2% in the period between 2008 and 2012. The decline was most likely caused by the economic crisis, but an explanation for such a large negative figure also lies in the fact that Macedonia is the farthest from Croatia of all countries in the region and has a considerably lower standard than Croatia. It was followed by Bosnia and Herzegovina with an 8% drop in arrivals. A traditionally high number of visitors from the neighbouring country declined dramatically at the onset of the crisis in 2009, while beginning to record positive growth rates gradually in the years that followed. In the period under observation, the number of arrivals from Serbia shrank 2.9%, followed by decreasing numbers from year to year. Finally, visitors from Montenegro readily come to Croatia regardless of declining standards and higher prices. Their arrivals grew at a rate of 20.7% between 2008 and 2012.
In addition to the crisis, which certainly had a strong impact on the decline in the number of tourist arrivals from the region, there are at least two other reasons for such weak interest in Croatia among tourists from the region. These two interrelated reasons concern prices and competition. Croatia might be said not to be cost-competitive with regard to the countries in the region. East of Croatia, but equally close to the region, there are much cheaper tourist destinations of Bulgaria and Turkey. For example, while the average prices of tourist services in Croatia exceeded the regional average by 18.6%, they were 27.5% and 10.9% lower, respectively, in Bulgaria and Turkey than Croatian prices.
Tourists from the region, therefore, perceive Croatia to be too expensive. This is confirmed by 2012 data, according to which Bulgaria had almost five times as many and Turkey twice as many visitors from Serbia as Croatia that same year. Also, almost seven times as many visitors from Macedonia chose Turkey over Croatia. This is a rising trend, with an increasing number of tourists from the region opting for more competitive destinations, such as Bulgaria and Turkey.
4. Harmonised cooperation index
4.1. Methodological basis
An HCI will be used to measure the extent of economic cooperation between Croatia and countries in the region as regards trade, FDI and tourism. Using these three important elements of the balance of payments, we will be able to monitor development trends in the cooperation between Croatia and countries in the region.
Since Croatia has a trade surplus with countries in the region, this means an inflow of foreign currency necessary to cover the trade deficit with EU countries. Also, the country’s tourism earnings are an important source of foreign currency, so it is also necessary to monitor the development of tourism cooperation with countries in the region. Probably due to a higher development level, Croatia records a net outflow of direct investment into the region, but such direct investment should strengthen its position in the regional market in the long run and boost capital inflows through a repatriation of profits. An analysis of these flows will demonstrate the strength and structure of economic cooperation between Croatia and countries in the region.
In order to construct an HCI, it is necessary to first calculate cooperation indices (CI) for individual fields, which will then be integrated into a comprehensive or HCI. CIs for individual fields measure cooperation between Croatia and countries in the region in the fields of foreign trade, FDI and tourism. The CI design and calculation are given by the following formula, which actually represents the base index:(1)
where yt represents the monetary value of trade, FDI or tourism in year t, while yb denotes the corresponding value in the base year.Footnote16 All data are expressed in euros.
For the purpose of calculating the HCI, which includes all specified fields, the following data were used: the sum of the values of Croatian exports to and imports from the region, the sum of FDI inflows from the countries in the region to Croatia and Croatia’s direct investment in the region, as well as earnings from the region’s tourists.Footnote17 The HCI was calculated as follows:(2)
where y1t represents trade, y2t stands for FDI and y3t for tourism, while is the sum of all three categories in 2001. In other words, we have added up foreign trade, FDI flows and tourism earnings for each year, comparing the total values against 2001.
4.2. Individual cooperation indices
4.2.1. Foreign trade
The final establishment of peace and political stabilisation in Croatia and countries in the region has contributed to the revival of mutual economic relations. As trade is certainly one of the main drivers, a cooperation index was calculated to estimate the direction and intensity of mutual trade activities. A more detailed picture of that cooperation was obtained by comparing the index value against EU 27. The comparison reveals a greater intensification of Croatia’s cooperation with countries in the region between 2001 and 2012 than with EU 27, or with the world as a whole (Figure ). Also, different trends and dynamics in the index movement may be perceived, both before and during the recession.
Figure 7. Comparison of cooperation indices with countries in the region, EU 27 and the world.
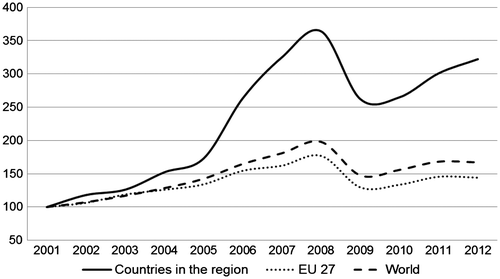
Looking at the period before the recession, it may be concluded that a revival of Croatia’s trade with countries in the region had ultimately resulted in the 2008 index level at more than that with EU 27. More precisely, the index of cooperation with the region’s and EU 27 countries stood at 364.1 and 176.8, respectively. However, it should be noted that the EU 27 contribution to the overall cooperation index is significantly larger than that of countries in the region. In 2012, it was 61% for EU 27 and 11.4% for countries in the region. As expected, the onset of the recession led to a reduction of cooperation both with the region and with EU 27. A slight gradual increase of cooperation is observed after 2009, but the intensity of cooperation is greater with countries in the region than with EU 27.
The contributions of individual countries to the overall cooperation show significant heterogeneity (Figure ).
Figure 8. Foreign trade cooperation index between Croatia and countries in the region, with contributions of individual countries to the index.
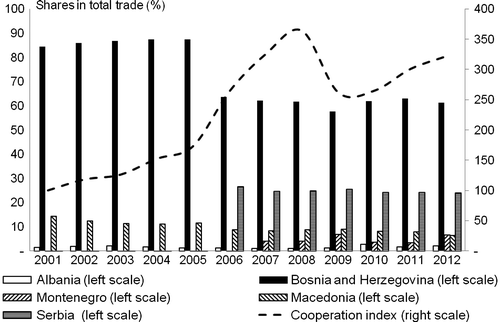
According to the results of our analysis, cooperation with Bosnia and Herzegovina contributed most to the overall index value. Its contribution to the overall index was 61.2% in 2012. Serbia should also be singled out, as cooperation with that country is on the rise. Measured by the cooperation index, Macedonia ranks third by importance to Croatia after Bosnia and Herzegovina and Serbia, but its contribution to the overall cooperation shrank gradually in the period under observation. Despite minor fluctuations, Montenegro was contributing increasingly to the overall cooperation. Meanwhile, Albania’s contribution remained negligible.
4.2.2. Foreign direct investment
The indices of regional FDI cooperation were calculated on the basis of data on Croatia’s direct investment in the countries of the region, and on their direct investment in Croatia. Indices of regional cooperation were calculated for direct investment flowsFootnote18 and stock. Since we are interested in the overall cooperation between Croatia and countries in the region, we added the values of FDI in Croatia and Croatia’s direct investment in the region.
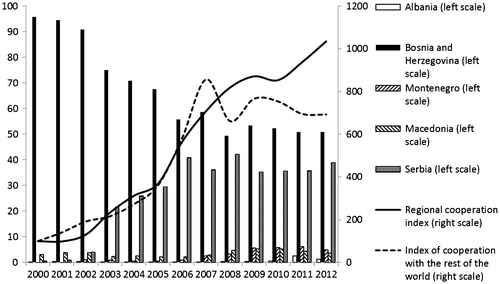
The regional cooperation index based on FDI flows shows that regional cooperation grew strongly between 2000 and 2006 to stand almost seven times higher in 2006 than in 2000 (Figure ). However, it should be noted that regional cooperation measured by FDI flows was very low in 2000. The sum of FDI inflows in Croatia and its direct investment in the region amounted to a mere EUR 31.2 million, against EUR 1.1 billion of total FDI (excluding the region). The level of regional cooperation stabilised between 2006 and 2008, only to experience, due to recession, a strong decline in 2009 to below the level of base year 2000. Cooperation recovered as early as 2010, especially thanks to a strong increase in direct investment inflows from countries in the region into Croatia. Cooperation continued to intensify in the years that followed, so the regional cooperation index based on direct investment flows stood 327.1% higher in 2012 than in 2000. While being considerably larger in absolute terms, cooperation with the rest of the world did not record such growth rates. In the record year 2007, the index of cooperation with the rest of the world was 198.3% higher than 2000, while slipping back to 16.9% below the base year level in 2012.
Figure 9. Index of regional cooperation based on foreign direct investment flows from the region into Croatia and Croatia’s direct investment in the region, 2000–2012.
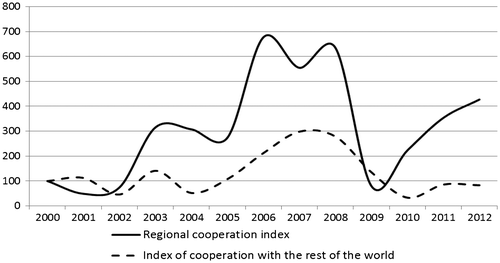
Since FDI flows are very volatile, we calculated a regional cooperation index based on the FDI stock. This index also points to an increase in regional cooperation in the period under observation, more precisely to a steady increase in the extent of cooperation (Figure ). In 2012, regional cooperation measured by FDI stock was 10 times higher than in 2000. Movements of the regional cooperation index were most strongly affected by the investment in and from Bosnia and Herzegovina and Serbia. While Croatia’s cooperation with Bosnia and Herzegovina was maintained continually from the beginning of the period under observation, stronger cooperation with Serbia only began to develop in 2003. Hence the share of Bosnia and Herzegovina dominated the index at the beginning of the period. Unlike the regional cooperation index, the index measuring cooperation with the rest of the world shows a decline after 2007. The reasons for such developments lie in the equity prices of listed companies. Although 2008 saw the highest level of FDI inflows into Croatia, the prices of most shares included in the calculation of FDI plummeted.Footnote19 By contrast, most regional FDI was not listed on the stock exchanges, so the situation in the stock markets has a considerably smaller impact on the FDI stock from the region.
4.2.3. Tourism
In order to develop a harmonised index of regional cooperation, we calculated a composite index of tourism cooperation between Croatia and countries in the region. This means that we examined the dynamics of tourist arrivals from the region using the number of overnight stays in Croatia in the period between 2000 and 2012, and alternatively used projections of earnings from tourists from the region. The number of overnight stays is a physical indicator taken from national statistics, while tourism earnings by countries had to be estimated because the Croatian National Bank lacks such data and only has the aggregate tourism earnings figure available. Therefore, we had to estimate earnings by countries of the region using two different weights: the ratio of overnight stays of tourists from the region to the total overnight stays of foreign tourists, and the weighting used to correct earnings from tourists from the region by GDP per capita to account for the differences in GDP among the countries. In order to present cooperation among the region’s countries in a simple, clear and unambiguous manner, the indices were used according to the methodology presented in section 4.1, thus obtaining the index of tourism cooperation among the countries in the region.Footnote20 Based on the number of overnight stays of tourists from Bosnia and Herzegovina, Serbia, Macedonia and Montenegro and tourism earnings from them, we calculated two different indices of tourism cooperation between Croatia and countries in the region (Figure and Figure ). Figure shows that the tourism cooperation index measured by the number of overnight stays on an upward trend until 2008, when it reached its peak. Such a trend coincides with a general trend in Croatian tourism, which achieved that year the best results recorded since the country’s independence. We may conclude that Croatia’s cooperation with countries in the region grew between 2000 and 2008, so the tourism cooperation index based on the number of overnight stays stood 85.5% higher in 2008 than in 2000. However, the global financial crisis and recession in the countries of the region reduced disposable income, including expenditures for travel, which ultimately led to a decline in the number of tourist travels. Thus, the tourism cooperation between Croatia and countries in the region also shrank in the 2009–2012 period compared to 2008. Although 2011 saw a slight improvement in the business cycle of the countries in the region that even led to an increase in the cooperation index, the index dropped once again in 2012 as some of the region’s countries slipped back into a recession. Figure also shows that Bosnia and Herzegovina has the greatest impact on cooperation index movements. Given that visitors from Bosnia and Herzegovina, on average, accounted for 75.9% of the total overnight stays of tourists from the region in the period under observation, the dynamics of their overnight stays had the largest impact on the movements of the composite index.
Figure 11. Index of tourism cooperation based on the number of overnight stays of tourists from the region, with shares of individual countries in the index, 2000–2012.
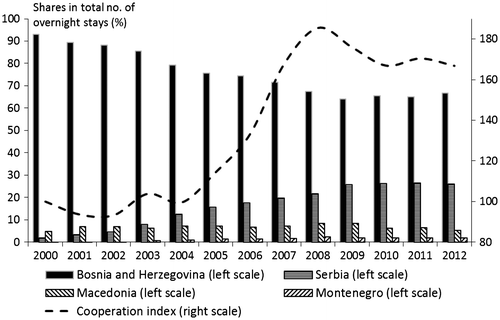
Figure 12. Index of tourism cooperation based on earnings from tourists from the region, 2000–2012.
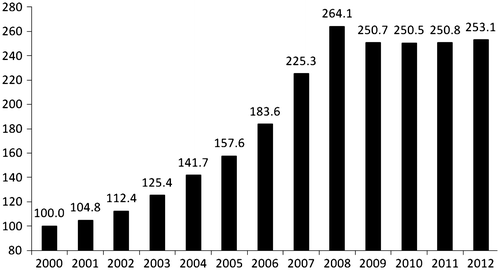
Figure shows a tourism cooperation index based on earnings from the region’s tourists. It is evident that the index confirms the trends observed in physical indicators leading up to and including 2008. According to our estimate, these earnings were lower after 2008 than in the record year, while still exceeding those of 2007. It means that while the regional cooperation measured by earnings declined, it still stands high at a level which is approximately 150% higher than in 2000. The fact that, in contrast to physical indicators, the extent of cooperation measured by earnings increased in 2012 can partly be explained by a hike of prices of tourist services in Croatia, which had an impact on tourism earnings.
Overall, Croatia’s tourism cooperation with countries in the region may be described by three basic characteristics. Firstly, tourism cooperation follows the business cycle, which is best evidenced by the 2009 cooperation decline, coinciding with the recession which hit countries in the region. Another characteristic is that, despite the recession, tourism cooperation did not drop drastically after 2008, but remained at approximately the 2007 level. Finally, tourism cooperation is primarily determined by cooperation between Croatia and Bosnia and Herzegovina, since the largest number of visitors from the region comes precisely from that country.
4.3. Harmonised cooperation index
Results of the analysis based on empirical calculations of trade, investment and tourism CIs described so far provide tentative indications of the direction and intensity of developments in the overall economic cooperation between Croatia and countries in the region. To obtain an even more detailed insight into the extent and dynamics of the overall cooperation, a harmonised index was calculated. As mentioned earlier, the index methodology involves the calculation and evaluation of cumulative cooperation between Croatia and countries in the region with regard to FDIs, trade and tourism.
The analysis shows a rise of the harmonised index from 100.0 in 2001, which is taken as the base year, to 160.8 in 2012 (Figure ). Its movements describe an uneven trend in the period under observation as the development of cooperation, proven by the index growth, was brought to a halt by the recession in 2008.
Figure 13. Harmonised cooperation index between Croatia and countries in the region, with contributions of individual economic sectors to the index.
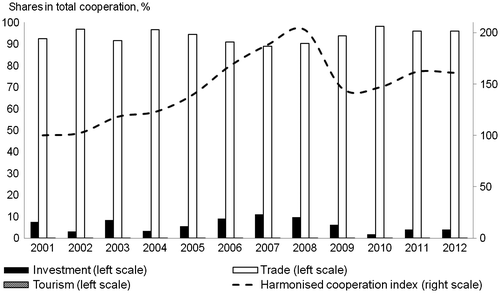
After a stabilisation in 2009, the index saw a modest gradual recovery between 2010 and 2012. However, it is worth noting that the index failed to regain its pre-recession level.
The contribution of the analysed fields to the index is dominated by foreign trade. Its share stood at 96% in 2012, followed by direct investment at 3.9% and tourism with a 0.1% share. The modest contribution of investment only confirms previous research findings on the extremely low investment activity in the region’s countries in general, as well as regional cooperation with regard to new investments. Meanwhile, a negligible share of tourism only partially reveals currently undeveloped and untapped potential for further development.
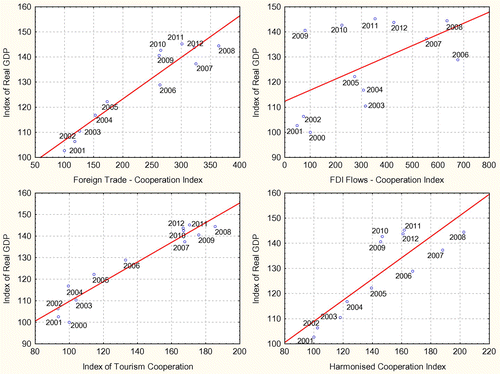
To give indication of how cooperation with countries in the region contributes to their GDP growth, we compared CIs with regional real GDP developments. Figure shows the relationship between CIs of Croatia and countries in the region and their average real GDP, expressed as an index number with the base year 2000. Even though regional cooperation is not the only driver of GDP growth, the results are indicative. On average, the higher the cooperation, the higher is the real GDP. However, the recession that started in 2008 had a much stronger impact on regional cooperation than on GDP, indicating still relative fragile regional ties.
5. Conclusion
Economic cooperation between Croatia and countries in the region exhibits a strong increase since 2000. However, the development of economic cooperation between Croatia and countries in the region has been inhibited considerably by the 2008 recession and its aftermath. The macroeconomic picture of most countries in the region is characterised by insufficient production, rampant unemployment levels, a decline in real wages, twin current account and budget deficits and a high foreign debt. In such an environment, launching an investment cycle is a prerequisite for stronger economic growth to eliminate recession symptoms.
Possible ways out of difficult economic circumstances may lie to a certain extent in improving and developing mutual economic cooperation. Of all of the analysed fields, the greatest cooperation progress has been made, as expected, in foreign trade. Nevertheless, the recession which is clearly discernible in declining domestic demand is a major contributor to the slowdown of mutual trade. Modest investment activity and meagre investments among countries in the region may serve to explain the causes of economic hardship in the analysed countries only in part. In addition, the investment structure also fails to support new manufacturing processes which would help create value-added growth and more jobs. Although it is also determined to a large extent by economic conditions in the region, there is ample room for the development of tourism cooperation.
Even though regional cooperation does not solely influence the developments in real GDP, results indicate that the higher the cooperation, the higher is the real GDP. However, results also show that regional cooperation depends strongly on stability, meaning that in good times cooperation rises with GDP, but that in bad times regional cooperation drops more strongly than GDP. Bearing in mind the positive influence of economic cooperation on GDP of the countries in the region, policymakers should foster mutual cooperation in fields of foreign trade, FDIs and tourism, but also aim at strengthening regional ties in order to lower the impact of potential recessions on the extent of regional economic cooperation.
An insight into the structure of Croatia’s cooperation with countries in the region confirms a significant concentration of Bosnia and Herzegovina, as well as growing cooperation with Serbia. Fairly small contributions of Albania, Montenegro and Macedonia to the overall cooperation are perhaps the best proof of the potential which remains untapped and undeveloped. It can be recognised primarily in trade, investment and tourism sectors.
However, we have to bear in mind the possible limitations of this study. We focused only on variables important for the balance of payments, while we did not take into account other potential forms of cooperation which could contribute to the enhanced economic cooperation between the analysed countries, such as creation of the stabile political environment, cooperation in transport development and market liberalisation. Also, the inclusion of other potential variables, such as income and investment in research and development may be seen as a prospect for further development and application of the HCI. The index may also serve as a solid basis for the development and presentation of a suitable model of cooperation among the countries in the region because it is constructed using measurement of mutual cooperation among all individual countries in the region.
Disclosure statement
No potential conflict of interest was reported by the authors.
Notes
1. SEE countries involved in this study include Croatia, Bosnia and Herzegovina, Serbia, Montenegro, Macedonia and Albania.
2. The size of the domestic market, the growth potential of the market, population, income, salary level, exchange rate volatility, historical ties, bilateral foreign trade, trade barriers and macroeconomic and political stability are frequently studied determinants of FDI.
3. Studies differentiating between inter-regional FDI and FDI inflows from outside the region show that the majority of regional integration bolstered third-country, rather than intra-regional investment into the countries of the region (Baltagi, Egger, & Pfaffermayr, Citation2008; Blomstrom & Kokko, Citation1997). The reason behind this lies in the fact that multinational corporations situate their branch offices in the countries which are members of a regional integration in a bid to reach customers across the entire region at lower trade costs.
4. In the period between 2000 and 2008, imports of the region’s countries grew faster than exports.
5. Export trend reversals in the period between 2001 and 2012 resulted in a corresponding change in the export structure with regard to the export destinations. The share of countries in the region in the overall structure of Croatian exports increased from 13.4% in 2001 to 20.3% in 2012. At the same time, the share of the EU 27 decreased from 67.9% to 58.3%. Croatia's most important export destination is Bosnia and Herzegovina, accounting for slightly less than two-thirds of total Croatian exports to the countries in the region in 2012, and the country with which Croatia has the largest trade surplus. The second most important export market after Bosnia and Herzegovina is Serbia, with a 21.5% share in 2012.
6. Despite its rising trend, the share of imports from the region to Croatia in total Croatian imports is considerably smaller than the share of Croatian exports to the region. The share of the region’s countries in Croatia’s total import structure was 2.1% in 2001, while almost tripling to 6.1% in 2012. The share of imports from the EU 27 dropped significantly, from 72% to 62.4%, over the same period. As with exports, the majority of products imported by Croatia from the region come from Bosnia and Herzegovina. Serbia, recording the largest increase in the share of imports in total Croatian imports from the region, comes second and is followed by Macedonia.
7. Positive values of the LI indicate the existence of a comparative advantage; the larger the value, the higher the degree of specialisation. Similarly, negative values point to de-specialisation.
8. The coefficient can vary from 0 to 1. The closer it is to 1, the higher the degree of specialisation in intra-industry trade. A lower value of the coefficient shows that the country has a higher level of specialisation in inter-industry trade. The methodologies and calculations of the GL index were developed and applied by Grubel and Lloyd (Citation1975). See more details about the use of intra-industry trade specialisation index in transition economies in Kaminski and Ng (Citation2001).
9. The indicator is calculated assuming values in the interval between 0 and 1. The closer the ES indicator is to 1, the more similar the structure of exports between countries a and b is. For details about the concept of the ES indicator, see Finger and Kreinen (Citation1979).
10. Central and Eastern European countries in this research include Bulgaria, the Czech Republic, Estonia, Hungary, Latvia, Lithuania, Poland, Romania, Slovakia and Slovenia.
11. FDI data are compiled on the basis of market prices, where possible, meaning that equity market movements affect the size of FDI stock.
12. Data relating to FDI from Albania, Kosovo and Montenegro in Croatia are not available due to confidentiality of individual data, involving only one or several reporting units.
13. Data on the number of overnight stays for the whole region is not precise, with no such data available for Albania.
14. Total population of each country was used to correct for the country size.
15. Serbia accounts for 7% of total tourism earnings in the region, Montenegro 6%, Bosnia and Herzegovina 4% and Macedonia 1%.
16. In calculating the CI for FDI and tourism, year 2000 was taken as the base year, with 2001 used for trade due to unavailability of internationally comparable data.
17. Data on earnings from Croatian tourists in each observed country of the region are not available.
18. Direct investment flows are used to calculate the harmonised index of cooperation.
19. The Croatian stock exchange index CROBEX lost two thirds of its value in 2008, and its constituents include a number of shares associated with FDI.
20. It should be noted that the Croatian Bureau of Statistics only has the number of overnight stays of tourists from Bosnia and Herzegovina, Macedonia, Serbia and Montenegro, while the number of overnight stays from Albanian tourists is negligible and, thus, could not be included in the calculation. Also, since the number of overnight stays was not recorded separately for Serbia and Montenegro prior to 2007, the figures for the two countries between 2000 and 2006 were estimated, using their average shares in the period between 2007 and 2012.
References
- Aradhyula, S., & Tronstad, R. (2003). Does tourism promote cross-border trade? American Journal of Agricultural Economics, 85, 569–579. doi:10.1111/1467-8276.00456
- Baldwin, R. E. (2004). Openness and growth: What’s the empirical relationship? In R. E. Baldwin & L. A. Winters (Eds.), Challenges to globalization (pp. 499–525). Chicago: NBER, University of Chicago Press.10.7208/chicago/9780226036557.001.0001
- Baltagi, B., Egger, P., & Pfaffermayr, M. (2008). Estimating regional trade agreement effects on FDI in an interdependent world. Journal of Econometrics, 145, 194–208.10.1016/j.jeconom.2008.05.017
- Bartlett, W. (2009). Economic development in the European super-periphery: Evidence from the Western Balkans. Ekonomski anali, 54, 21–44. doi:10.2298/EKA0981021B
- Bevan, A., & Estrin, S. (2004). The determinants of foreign direct investment into European transition economies. Journal of Comparative Economics, 32, 775–787. doi:10.1016/j.jce.2004.08.006
- Bevan, A., Estrin, S., & Grabbe, H. (2001). The impact of EU accession prospects on FDI inflows to central and Eastern Europe. ESRC “One Europe or Several?” Programme, No. 06/01 (pp. 1–16). Brighton: University of Sussex.
- Blomstrom M., & Kokko, A. (1997). Regional integration and foreign direct investment ( NBER Working Paper Series No. 6019). Retrieved from NBER website http://www.nber.org/papers/w6019.pdf10.3386/w6019
- Bogdan, Ž. (2006). Utjecaj FDI-ja na gospodarski rast europskih tranzicijskih zemalja [The impact of FDI on European transition countries' economic growth] ( EFZG – Serija članaka u nastajanju No. 09-06). Retrieved from EFZG website http://web.efzg.hr/repec/pdf/Clanak%2009-06.pdf
- Botrić, V., & Škuflić, L. (2006). Main determinants of foreign direct investment in the Southeast European Countries. Transition Studies Review, 13, 359–377. doi:10.1007/s11300-006-0110-3
- Brenner, L., & Aguilar, A. (2002). Luxury tourism and regional economic development in Mexico. The Professional Geographer, 54, 500–520. doi:10.1111/0033-0124.00346
- Brenton P. (1996). The impact of the single market on foreign direct investment in the EU. Report for DGII.
- Brenton, P., Di Mauro, F., & Lücke, M. (1999). Economic integration and FDI: An empirical analysis of foreign investment in the EU and in Central and Eastern Europe. Empirica, 26, 95–121. doi: 1023/A:1007006429600
- Britton, S. G. (1982). The political economy of tourism in the third world. Annals of Tourism Research, 9, 331–358. doi:10.1016/0160-7383(82)90018-4
- Bussière, M., Fidrmuc, J., & Schnatz, B. (2005). Trade integration of central and eastern European countries: Lessons from a gravity model ( ECB Working Papers No. 545). Retrieved from ECB website https://www.ecb.europa.eu/pub/pdf/scpwps/ecbwp545.pdf
- Buturac, G. (2009). Comparison of trade patterns of selected South-Eastern European Countries. In I. Kikerkova (Ed.), Proceedings from the third international conference: Regional cooperation and economic integration - Challenges and opportunities (pp. 75–89). Skopje: Faculty of Economics - Skopje.
- Buturac, G., & Teodorović, I. (2012). The impacts of the global recession on Southeast European Countries. Eastern European Economics, 50, 78–97. doi:10.2753/EEE0012-8775500105
- Cappelen, A., Castellacci, F., Fagerberg, J., & Verspagen, B. (2003). The impact of EU regional support on growth and convergence in the European Union. JCMS: Journal of Common Market Studies, 41, 621–644. doi:10.1111/1468-5965.00438
- Castellani, V., & Sala, S. (2010). Sustainable performance index for tourism policy development. Tourism Management, 31, 871–880. doi:10.1016/j.tourman.2009.10.001.
- Ćejanović, F., Hodžić, K., & Terzić, L. (2009). Utjecaj CEFTA sporazuma na vanjskotrgovinsku razmjenu poljoprivrednih proizvoda u Bosni i Hercegovini. Tranzicija, 11, 10–19.
- Coles, T., & Hall, D. (2005). Tourism and European Union enlargement. Plus ça change? International Journal of Tourism Research, 7, 51–61. doi:10.1002/jtr.512.
- Crabtree, R., & Bayfield, N. (1998). Developing sustainability indicators for mountain ecosystems: A study of Carngorms, Scotland. Journal of Environmental Management, 52, 1–14. doi:10.1006/jema.1997.0159.
- Ćudina, A., & Sušić, G. (2013). The impact of Croatia ̓s accession to the EU on economic relations with the CEFTA Countries. Ekonomski pregled, 64, 376–396.
- Demekas, D., Horvath, B., Ribakova, E., & Wu, Y. (2005). Foreign direct investment in Southeastern Europe: How (and how much) can policies help? ( IMF Working Paper, No. 05/110). Retrieved from IMF website https://www.imf.org/external/pubs/ft/wp/2005/wp05110.pdf
- Dennis, D. J., & Yusof, Z. A. (2003). Developing indicators of ASEAN integration – A preliminary survey for a roadmap ( REPSF Project 02/001, Final Report). Retrieved from the website http://aadcp2.org/wp-content/uploads/02-001-Final-Report.pdf
- Derado, D. (2006). The Effects of trade liberalisation among the South Eastern European Countries. Tourism and Hospitality Management, 12, 1–17.
- Derado, D. (2013). Determinants of FDI in transition Countries and estimation of the potential level of Croatian FDI. Financial Theory and Practice, 37, 227–258. doi:10.3326/fintp.37.3.1.
- Dragusha, B., & Bejleri, E. (2008). The impact of EU accession process on the Western Balkans FDI inflows. 3rd Annual MIBES Conference, Proceedings (pp. 92–105). Larissa: TEI of Larissa.
- Družić, I., Penava, M., & Sekur, T. (2009). Dynamics and composition of trade relations between Croatia and CEFTA 2006 Countries. In I. Kikerkova (Ed.), Proceedings from the third international conference: Regional cooperation and economic integration - Challenges and opportunities (pp. 101–115). Skopje: Faculty of Economics - Skopje.
- European Commission – Tourism Sustainability Group (2007). Action for more sustainable European tourism. Report of the Tourism Sustainability Group. Retrieved from http://ec.europa.eu/enterprise/sectors/tourism/files/docs/tsg/tsg_final_report_en.pdf
- Finger, J. M., & Kreinen, E. M. (1979). A measure of export similarity and its possible use. The Economic Journal, 89, 905–912. doi:10.2307/2231506.
- Grubel, H., & Lloyd, P. (1975). Intra-industry trade: The theory and measurement of international trade in differentiated products. London: Macmillan.
- Hunya G. (2002). FDI in South-Eastern Europe in the early 2000s, Vienna: Vienna Institute for International Economic Studies (WIIW). Retrieved from http://www.oecd.org/czech/1940829.pdf
- Kaminski, B. (2001). How accession to the European Union has affected external trade and foreign direct investment in Central European economies ( World Bank Working Paper No. 2578). Retrieved from http://elibrary.worldbank.org/doi/pdf/10.1596/1813-9450-257810.1596/prwp
- Kaminski, B., & Ng, F. (2001). Trade and production fragmentation: Central European economies in EU networks of production and marketing ( World Bank Policy Research Working Paper Series No. 2611). Retrieved from WB website http://elibrary.worldbank.org/doi/pdf/10.1596/1813-9450-2611
- Kersan-Škabić, I. (2011). FDI, trade and integration in the Western Balkan Countries: Is there any causality? International Journal of Trade and Global Markets, 4, 420–436. doi:10.1504/IJTGM.2011.042865.
- Kikerkova, I. (2009). CEFTA 2006 as basis for economic reintegration of Western Balkan Countries. In I. Kikerkova (Ed.), Proceedings from the third international conference: Regional cooperation and economic integration - Challenges and opportunities (pp. 157–169). Skopje: Faculty of Economics - Skopje.
- Lagiewski, R., & Revelas, D. (2004). Challenges in cross-border tourism regions ( RIT Scholar Works). Retrieved from http://scholarworks.rit.edu/cgi/viewcontent.cgi?article=1554&context=other
- Mbaiwa, J. (2005). Enclave tourism and its socio-economic impacts in the Okavango Delta, Botswana. Tourism Management, 26, 157–172. doi:10.1016/j.tourman.2003.11.005.
- OECD (2010). Trade integration, industry concentration and FDI inflows: The experience in Central and South Eastern Europe ( CEFTA Issues Paper 3). Retrieved from http://www.cefta.int/sites/default/files/monitoring-investment-related-clauses/CEFTA_WP3_TradeFDI.pdf
- Schiff, M., & Winters, L. A. (2003). Regional integration and development. Washington: World Bank and Oxford University Press.10.1596/0-8213-5078-1
- Shaw, B., & Shaw, G. (1999). Sun, sand and sales: Enclave tourism and local entrepreneurship in Indonesia. Current Issues in Tourism, 2, 68–81. doi:10.1080/13683509908667844.
- Sofield, T. (2006). Border tourism and border communities: An overview. Tourism Geographies, 8, 102–121. doi:10.1080/14616680600585489.
- Song, H., & Li, G. (2008). Tourism demand modelling and forecasting - A review of recent research. Tourism Management, 29, 203–220. doi:10.1016/j.tourman.2007.07.016.
- Timothy, D. J. (2001). Tourism and political boundaries. London: Routledge.
- Torres, R., & Momsen, J. (2005). Gingolandia: The construction of a new tourist space in Mexico. Annals of the Association of American Geographers, 95, 314–335. doi:10.1111/j.1467-8306.2005.00462.x.
- Vamvakidis, A. (1998). Regional integration and economic growth. The World Bank Economic Review, 12, 251–270. doi:10.1093/wber/12.2.251.
- Vlahinić-Dizdarević, N., & Blažić, H. (2005). The investment effects of PTAs in Southeast Europe. In A. Kumar & V. Kandžija (Eds.), Economic integrations, competition and cooperation (pp. 1–16). Rijeka: University of Rijeka.
- Vodeb, K. (2010). Cross-border regions as potential tourist destinations along the Slovene Croatian frontier. Tourism and Hospitality Management, 16, 219–228.
- te Velde, D. W., & Bezemer, D. (2006). Regional integration and foreign direct investment in developing Countries. Transnational Cooperations, 15, 41–70.
- WIIW (2012). WIIW database on foreign direct investment in Central, East and Southeast Europe. Vienna: The Vienna Institute for International Economic Studies.
- Zakharov, V., & Kušić, S. (2003). The role of FDI in the EU accession process: The case of the Western Balkans. ETSG Annual Conference. Madrid. Retrieved from http://www.etsg.org/ETSG2003/papers/zacharov.pdf

