
Abstract
The aim of this article is to construct a monthly coincident indicator of real economic activity in Croatia. For that purpose, we use a database containing altogether 278 time series, ranging from January 1998 to December 2010. In step one we use correlation analysis, logit and Markov switching (MS) model in order to select time series that closely follow the overall business cycle and its turning points. The following four series have been detected as having the best coincident properties: industrial production, volume of retail sales, VAT revenues and total credit to households. In step two we apply dynamic factor model methodology to the aforementioned coincident series in order to estimate their common component, which is then used to construct a monthly coincident indicator of real economic activity.
1. Introduction
Coincident and leading economic indicators have been in the spotlight of both academics and policymakers ever since they were introduced by Mitchell and Burns (Citation1938). Traditionally, leading indicators were considered as a practical tool for forecasting business cycle developments, while coincident indicators were viewed as a useful tool for assessing the current condition of the business cycle and nowcasting (Giannone, Reichlin, & Small, Citation2008; Camacho & Perez-Quiros, Citation2010). In the last two decades the importance of these two indicators grew as the literature expanded, resulting in a reversal of the roles these two indicators traditionally played. Thus today, besides their original usage, one can also utilise leading indicators in order to assess current business cycle conditions, while coincident indicators can be constructed in order to produce forecasts of future business cycle developments (Filardo, Citation1994; Marcellino, Citation2006).
In this article we construct a coincident indicator of real economic activity in Croatia using a dynamic factor approach combined with correlation analysis, logit and Markov switching (MS) modelling. Thereby, we are only interested in the original function of a coincident indicator, i.e. we use it as a tool for assessing the current business cycle condition. Business cycle conditions are of the utmost importance not just in Croatia, but worldwide. Huge resources are being devoted by the business sector, financial markets, and institutions responsible for conducting various economic policies, to the assessment of the continuously evolving state of the real economy. The efforts undertaken to precisely detect the current state of the real economy are necessary in order to circumvent the disadvantages of the only proxy for business cycle conditions available from official statistical offices – gross domestic product (GDP). Namely, GDP data are only available in quarterly frequencies; they are published with a substantial delay, and are subject to periodical revisions. Since these GDP features are inadequate for timely, precise and up-to-date business cycle analysis, several new approaches have been developed in the literature in order to find alternative solutions for approximating business cycle conditions.
In the last two decades, two approaches in measuring business cycle development emerged as particularly potent and important. The first uses MS modelling in order to construct a business cycle condition indicator, while the other uses dynamic factor modelling. Another strand of literature uses a combination of these two approaches. In this article we combine MS and dynamic factor models (DFM) in order to construct a coincident indicator of real economic activity in Croatia. First we estimate the probability of entering into recession on GDP data by applying a MS model with fixed probabilities. Then we use correlation analysis combined with logit models in order to select the series that closely follow overall business cycle tendencies and turning points proxied by the probability of entering into recession. After that, we detect four macroeconomic aggregate time series that coincide the most with business cycle tendencies, and then apply dynamic factor modelling in order to obtain one variable (i.e. a composite coincident indicator) that represents the general state of the economy.
Contribution to the literature is twofold. Since the research on constructing coincident indicators for European post-transition countries is relatively scarce, this article will shed more light on this important, and yet, rather neglected topic. To the best of our knowledge, our article is the first study that applies a combination of MS, logit and dynamic factor modelling in order to measure the business cycle condition for a European post-transition country. The second contribution of this article is related to the choice of variables that enter the coincident indicator (i.e. dynamic factor model specification). This choice is often arbitrary, as it relies on intuition and is not founded on any kind of formal econometric testing. Such a relaxed approach may be suitable for developed economies like the US, the UK or Germany that have plenty of literature on measuring business cycle conditions, but is certainly not most appropriate for post-transition economies. Due to the lack of research on modelling and measuring business cycle conditions in post-transition countries, the literature offers no suggestions or consensus on the most appropriate components of composite coincident indicators (CCI). Hence in this article, instead of arbitrarily choosing series that enter dynamic factor specification, we propose a formal three-step procedure for selecting the most appropriate series.
The remainder of the article is organised as follows. In section 2 we briefly present the three most commonly used approaches to measure the state of the business cycle and review the literature on CCI in European post-transition countries. In section 3 we present the methodology used for construction of a parametric single-index model in which the business cycle condition is an unobserved variable common to four macroeconomic time series that were detected as having strong correspondence to business cycle tendencies and turning points. In section 4 we present our main findings, including a newly constructed coincident indicator for Croatia. In section 5 we conclude the article.
2. Literature review
Although DFMs were introduced in macroeconomics by Sargent and Sims (Citation1977) and Geweke (Citation1977), their wider use in business cycle analysis and forecasting started in the late 1980s, after a series of papers by Stock and Watson had been published. Stock and Watson (1989) applied a single factor to model the co-movements of four main US coincident indicators: industrial production, real disposable income, hours of work and sales. The main premise of DFMs is that a given data-set is driven by two components. The first component is an unobservable common component that captures the main co-movements of time series data, whereas the second component is a variable-specific unobservable idiosyncratic component. The use of DFMs has been further improved by Stock and Watson (Citation1991, Citation1993), Kapetanios and Marcellino (Citation2003), Forni, Hallin, Lippi, and Reichlin (Citation2000, Citation2001, Citation2005), and Doz, Giannone, and Reichlin (Citation2011, Citation2012). The main drawback of DFMs is the use of constant parameters (Sims, Citation1989).
Unlike DFMs, the MS model allows dependency between the growth rate of the variables and the business cycle status. MS regressions were introduced in econometrics by Goldfeld and Quandt (Citation1973) and later extended by Hamilton. Hamilton’s nonlinear regime switching model (1989) represents an extension of Goldfeld and Quandt’s MS regression to the time series context. The rationale of Hamilton’s approach is that business cycle expansions and contractions could be viewed as different regimes with the business cycle modelled as a Markov chain. The regime or state of Hamilton’s model is unobserved and determined by a stochastic process. Unlike DFMs in which the single unobservable component is continuous, the unobservable component in the MS model is a discrete variable and indirectly determines behaviour of the variables. Using the Markov regime switching model of the US GNP growth, Hamilton (Citation1989) reproduced the business cycle turning points established by the National Bureau of Economic Research (NBER) with remarkable precision.
Hamilton’s work has contributed to a significant amount of subsequent research. The research by Diebold and Rudebusch (Citation1996) is noteworthy, representing one of the first efforts to combine a dynamic factor model and a nonlinear switching model. Diebold and Rudebusch (Citation1996) allowed the parameters of the Stock and Watson factor model (1988) to change over the business cycle according to the Markov process (see Diebold & Rudebusch, Citation1996; Chauvet, Citation1998; Kim & Nelson, Citation1998).
To the best of our knowledge, there are no studies that apply MS, the dynamic factor, or the combination of those two models in order to construct a monthly composite coincident indicator for European post-transition countries. So far, business cycle properties for European post-transition countries have been analysed using spectral analysis and multivariate wavelet analysis (Jagrič, Citation2002; Strašek & Jagrič, Citation2002; Jagrič, Citation2003), but these authors do not engage in constructing a monthly CCI. On the other hand, Wozniak (Citation2011) and Lohmus and Demekas (Citation1998) do construct a CCI for Poland and Estonia but they do so by applying unobserved component method and ordinary least squares (OLS) regression respectively. Both papers do not previously test for most optimal CCI components, but opt out for arbitrary selection of most probable candidates instead. In recent years, DFMs were used more intensively in order to build short-term CCI used for the purpose of nowcasting. These applications include Arnoštová, Havrlant, Růžička, and Luboš (Citation2011) and Rusnák (Citation2013) who develop cyclical indicators for the Czech Republic, and Porshakov, Deryugina, Ponomarenko, and Sinyakov (Citation2015) who build CCI for Russia. Dynamic factor model is also being more widely used for examining business cycle properties in developed countries (see for example Matheson, Citation2014 and Antipa, Barhoumi, Brunhes Lesage, and Darné, Citation2012).
Business cycle analysis in Croatia focused either on constructing a non-model based CCI, as in case of Cerovac (Citation2005) or on constructing a quarterly composite index (Krznar, Citation2011) Cerovac (Citation2005) identified CCI components using correlation coefficients, while the CCI itself was calculated using deterministic formulae. Krznar (Citation2011) did not previously test CCI components and he constructed quarterly CCI by applying dynamic factor model on the same four series Stock and Watson used in their seminal paper on CCI from 1989. On the other hand, Rašić Bakarić, Tkalec, and Vizek (Citation2011) focus on developing composite leading indicator, but do not use it for examining the movement of GDP in real time, despite having that possibility.
3. Data and methodology
Potential CCI components are chosen from a database containing 278 time series, ranging from January 1998 to October 2010, all available in monthly frequencies. This statistical database covers the most important sectors of the Croatian economy classified as:
| 1) | Prices of industrial products (eight indicators), | ||||
| 2) | Consumer prices (20 indicators), | ||||
| 3) | Industrial production (40 indicators), | ||||
| 4) | Construction (three indicators), | ||||
| 5) | Trade (one indicator), | ||||
| 6) | Tourism (six indicators), | ||||
| 7) | Unemployment (seven indicators), | ||||
| 8) | Employment (24 indicators), | ||||
| 9) | Gross wages (23 indicators), | ||||
| 10) | Net wages (24 indicators), | ||||
| 11) | Capital market (two indicators), | ||||
| 12) | Monetary statistics (66 indicators), | ||||
| 13) | Fiscal indicators (17 indicators), | ||||
| 14) | International series/statistics (15 indicators), | ||||
| 15) | Foreign trade (22 indicators). | ||||
Following Hamilton (Citation1989), the starting point for the construction of CCI is the application of MS modelling to Croatian GDP data ranging from the first quarter of 1998 to the first quarter of 2011 in order to obtain smoothed probabilities of entering into recession. Considering that business cycles shifts are not directly observable, Hamilton (Citation1989) proposed an algorithm which allows drawing probabilistic inference about whether and when these shifts may occur, based on available observations of the series. Hamilton’s algorithm has a form of a nonlinear iterative filter that permits estimation of population parameters by several available methods (maximum likelihood, expectations maximisation or Bayesian Markov Chain Monte Carlo estimation) and uses these parameters and data to draw the optimal statistical inference about the unobserved regimes. In his paper, Hamilton used maximum likelihood, while we apply expectations maximisation method.
A basic form of MS model is:(1)
(2) In (1) xt is GDP, st is an unobservable binary variable that measures the status of the business cycle, with st = 1 in recessions and st = 0 in expansions. The deterministic component as well as the dynamic one can change over different business cycle phases. Hamilton (Citation1989) proposed an extension (3) of the MS model (1) by introducing an equation that describes the behaviour of st. Since st is a binary variable, the equation cannot be of autoregressive form:
(3) The main aim of Hamilton’s model is to estimate the unobservable current status of the economy. The model assumes ‘a mean square error loss function, the best estimator coincides with the conditional expectation of st given current and past information on xt, which in turn is equivalent to the conditional probability’ (Marcellino, Citation2006, p. 16):
(4) Detailed calculations are available in Hamilton (Citation1994), Krolzig (Citation1997) and Marcellino (Citation2006).
A selection of potential composite coincident index components is based on correlation coefficients significance tests and logit model estimates. The consistency of CCI indicators with regards to general business cycle developments was examined by testing the significance of correlation coefficients between potential CCI components and GDP in year-on-year growth rates. All tested series range from the first quarter of 1998 to the first quarter of 2011. Since all the variables are quantitative continuous variables, Pearson’s Correlation Coefficient was used in order to confirm or reject a linear relationship between potential CCI components and GDP. Significance tests were performed for contemporaneous and values of CCI components that lead the reference GDP series from one up to a maximum of four quarters. Series whose contemporaneous growth rates exhibit significant and high correlation coefficients with GDP growth rates were selected as regressors in logit regression.
The aim of the logit test is to detect CCI components that follow business cycle turning points most closely. The dependent variable was obtained by converting smoothed transition recession probabilities into a discrete variable that defines whether the economy is in an expansion or recession regime at time t. The dependent variable has value 1 if there is a recession (transition probabilities are greater or equal to 0.5), and has value 0 if there is expansion (transition probabilities are smaller or equal to 0.5). Such transformation rule is often used in business cycle analysis and dating (Marcellino, Citation2006). Besides the dependent variable, the logit model comprises a constant and annual growth rate of a coincident indicator candidate in time t, t - 1, t - 2 and t - 3. The Newton-Raphson method is used as the optimisation algorithm. Due to the fact that the dependant variable is in quarterly frequency, we also have to transform potential CCI components to quarterly frequencies. For comparing alternative models and evaluating which CCI component coincides the most with business cycle turning points, the z-test on significance of CCI contemporaneous value in logit model, McFadden’s R2, likelihood ratio (LR) statistic and Schwartz information criterion are used (for more details see Greene, Citation2003, p. 534-539). In order to check the robustness of results we estimated logit models using two other optimisation algorithms (quadratic climbing and BHHH algorithm) and also estimated the same general and restricted models using probit regression.
After the best CCI components are detected, a dynamic factor model is applied to those series in monthly frequency in order to construct a monthly CCI of the business cycle. DFMs use information from a set of coincident macroeconomic variables by estimating their common factor that optimally approximates the dynamics of the variables in the model. Its popularity originates from the fact that it takes a large number of series but provides a simple result, a single unobserved variable called a dynamic factor.
The dynamic factor model defines a vector of coincident macroeconomic variables Xt as a composition of a common unobserved index denoted by CIt and an idiosyncratic component or the measurement error denoted by ut. The unobserved factor and error are assumed stochastic and as in Stock and Watson (Citation1988) modelled as an autoregressive process with the variables given in growth rates of the original series:(5) As usual, L denotes the lag operator while
,
and D(L) are scalar, vector and matrix lag polynomials. To ensure no correlation between ΔCIt and ut, it is assumed that D(L) is diagonal and that δt and et are mutually and serially uncorrelated at all leads and lags. To estimate the model given by equation set (5), we add a transformation CIt-1 = ΔCIt-1 + CIt-2, insert the equations into a state space form and use the Kalman filter to evaluate the likelihood function. The state space formulation consists of a state and a measurement equation. The state equation describes the unobserved or state variables, namely ΔCIt, ut, and all their lags, while the measurement equation connects the observed elements with the state vector. Further details on the two equations can be found in Stock and Watson (Citation1988). Maximisation of the likelihood function provides parameter and common factor estimates and the Kalman filter indirectly constructs the CCI. Namely, the minimum mean square error estimate of the state equation is exactly the common factor of the chosen coincident variables or CCI. It is important to add that this procedure can be done up to period t making it possible to implement it in real time, in case the coincident variables are available.
4. Results
Construction of a monthly coincident indicator of real economic activity involves depicting time series that closely follow the overall business cycle and its turning points. Therefore, we investigate 278 time series available for the Croatian economy and choose those that coincide with the benchmark GDP and the probability of entering into recession series most faithfully. In order to select the series that will form our CCI we use statistical and econometric techniques, i.e. correlation coefficients, logit and MS modelling. As a first step we chose 22 series that have significant and highest correlation coefficients with GDP at the contemporaneous level, from altogether 278 series tested for correlation with GDP. Chosen potential CCI components along with their correlation coefficients are presented in Table .
Table 1. Potential CCI components correlation coefficients.
Out of 22 presented variables (potential CCI components) presented in Table , we continue with logit analysis using 11 variables that are characterised not only by highest contemporaneous correlation coefficients, but also by a higher level of data aggregation. We prefer series with the highest level of aggregation because higher aggregation series mimic the behaviour of referent GDP series more truly.
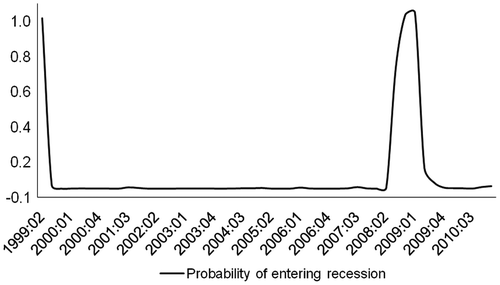
In the second step we apply MS modelling in order to derive smoothed probability of entering into recession from real GDP series in first differences (probability is displayed in Figure ). This probability is used for constructing a binary series that proxies recessions and expansions using the transformation rule described in the methodology section.
Figure 1. Probability of entering recession. Source: Authors.
As a third step we apply logit model in order to pin down the final CCI components. We start our logit estimation with a broader model that incorporates the dependent variable, a constant and potential CCI components in annual growth rates in timet, t - 1, t - 2 and t - 3. Based on z-statistics and their p-values we select those time series that have the best coincident properties, i.e. those that have highly significant contemporaneous growth rates, lowest Schwarz information criteria and representative LR and McFadden R2 statistics. The results are presented in Table .
Table 2. Logit regression results for potential CCI components.
The results of logit estimates suggest that the following series should be included in CCI: total industrial production, volume index of real retail sales, value added tax revenues (net) and broad money M4. Series volume of intermediate goods production also exhibits good results but is discarded due to the fact that intermediate goods production is a segment of total industrial production – series included in CCI.
Once the CCI components are identified, we apply dynamic factor modelling and estimate its common component, i.e. monthly composite coincident indicator that represents the overall business cycle fluctuations instead of GDP. We estimate the parameters of an AR(2) model using maximum likelihood and present the results in Table . CIt denotes the common unobserved component and in the last row of the table, it is given in an equation form together with the estimated phi parameters (0.126, 0.601). Argument in favour of the AR(2) process lies in the fact that the second phi parameter is significant. Figure presents the estimated common factor CCI based on four coincident variables and compares it to GDP series in order to show how truly the composite indicator coincides with the overall business cycle tendencies. As one can note, CCI tracks the behaviour of GDP well, and corresponds to changes in business cycle regimes whose dating is based on quarterly GDP growth rates. This in turn suggests that the monthly CCI displayed in Figure can be used not only as an indication of business cycle stance, but also as a tool for forecasting future business cycle tendencies.
Table 3. Dynamic factor model of estimated CCI components.
Figure 2. Composite coincident indicator and GDP. Source: Authors.
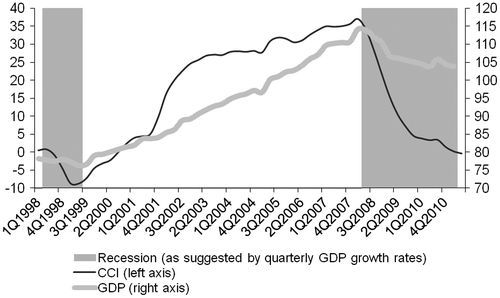
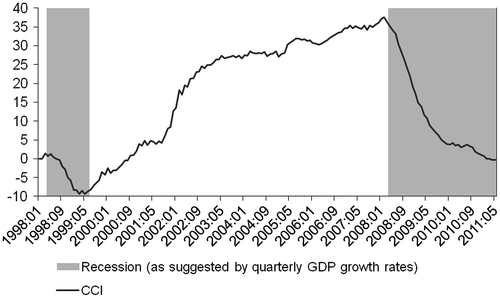
Figure 3. Monthly composite coincident indicator. Source: Authors.
5. Conclusion
The aim of this article is to construct a monthly composite coincident indicator of the business cycle in Croatia. To do that we combine several statistic and econometric techniques which enable us to previously test the potential composite indicator components before applying the dynamic factor model in order to extract a single factor that coincides with business cycle developments. Namely, we use correlation coefficients and their significance tests to detect series that consistently follow general business cycle tendencies. In the next step we use MS modelling in order to estimate the probability of entering into recession which is used in the following phase for dating and approximating two business cycle regimes: recession and expansion. The binary variable representing business cycle regimes obtained upon transforming the probabilities of entering into recession is used as a dependent variable in a logit model. The purpose of estimating a logit model is to detect those CCI components whose changes coincide with business cycle turning points.
As a result of these three exercises we are able to pin down four variables among altogether 278 variables available in the database that we consider the best coincident indicators for the Croatian business cycle. The following four variables can accordingly be used for constructing a composite coincident indicator: the volume of industrial production, the real retail sales, total VAT revenues and broad money (M4). As a final step of our analysis we apply dynamic factor modelling to extract a common factor from four coincident series. This common factor represents a new monthly composite coincident indicator of the Croatian business cycle. The composite indicator successfully fulfils its purpose: it tracks the behaviour of GDP closely, while the changes in its trend behaviour correspond well to business cycle regimes changes (i.e. recessions and expansions).
Related Research Data
References
- Antipa, P., Barhoumi, K., Brunhes Lesage, V., & Darné, O., (2012), Nowcasting German GDP: A comparison of bridge and factor models Working papers 401, Banque de France.
- Arnoštová, K., Havrlant, D., Růžička, L., & Luboš, T. P. (2011). Short-term forecasting of Czech quarterly GDP using monthly indicators. Finance a Uver, 61, 566–583.
- Camacho, M., & Perez-Quiros, G. P. (2010). Introducing the euro-sting: Short-term indicator of euro area growth. Journal of Applied Econometrics, 25, 663–694. 10.1002/jae.1174
- Cerovac, S. (2005). Novi kompozitni pokazatelji za hrvatsko gospodarstvo: prilog razvoju domaćeg sustava cikličkih pokazatelja [New Composite Indicators for the Croatian Economy: A Contribution to the Development of the National System of Cyclical Indicators]. Istraživanja HNB, 1(16), 1–32.
- Chauvet, M. (1998). An econometric characterization of business cycle dynamics with factor structure and regime switching. International Economic Review, 39, 969–996. 10.2307/2527348
- Diebold, F. X., & Rudebusch, G. D. (1996). Measuring business cycles: A modern perspective. The Review of Economics and Statistics, 78, 67–77. 10.2307/2109848
- Doz, C., Giannone, D., & Reichlin, L. (2011). A two step estimator for large approximate dynamic factor models based on Kalman filtering. Journal of Econometrics, 164, 188–205. 10.1016/j.jeconom.2011.02.012
- Doz, C., Giannone, D., & Reichlin, L. (2012). A quasi maximum likelihood approach for large approximate dynamic factor models. The Review of Economics and Statistics, 9, 1014–1024. 10.1162/REST_a_00225
- Filardo, A. (1994). Business-cycle phases and their transitional dynamics. Journal of Business and Economic statistics, 12, 299–308.
- Forni, M., Hallin, M., Lippi, M., & Reichlin, L. (2000). The generalized factor model: Identification and estimation. The Review of Economics and Statistics, 82, 540–554. 10.1162/003465300559037
- Forni, M., Hallin, M., Lippi, M., & Reichlin, L. (2001). Coincident and leading indicators for the Euro area. The Economic Journal, 111, 62–85. 10.1111/ecoj.2001.111.issue-471
- Forni, M., Hallin, M., Lippi, M., & Reichlin, L. (2005). The generalized dynamic factor model: One-sided estimation and forecasting. Journal of the American Statistical Association, 100, 830–840. 10.1198/016214504000002050
- Geweke, J. (1977). The dynamic factor analysis of economic time series. In D. J. Aigner & A. S. Goldberg (Eds.), Latent variables in socio-economic models (pp. 365–383). Amsterdam: Nort Holland Publishing.
- Giannone, D., Reichlin, L., & Small, D. (2008). Nowcasting: The real time informational content of macroeconomic data. Journal of Monetary Economics, 55, 665–676. 10.1016/j.jmoneco.2008.05.010
- Goldfeld, S., & Quandt, R. E. (1973). A markov model for switching regressions. Journal of Econometrics, 1, 3–16. 10.1016/0304-4076(73)90002-X
- Greene, W. H. (2003). Econometric analysis. New Delhi: Pearson Education Publishers.
- Hamilton, J. D. (1989). A new approach to the economic analysis of nonstationary time series and the business cycle. Econometrica, 57, 357–384. 10.2307/1912559
- Hamilton, J. D. (1994). Time series analysis. Princeton: Princeton University Press.
- Jagrič, T. (2002). Measuring business cycle: The case of Slovenia. Eastern European Economics, 40, 63–87.
- Jagrič, T. (2003). Business cycles in Central and East European countries. Eastern European Economics, 41, 6–23.
- Kapetanios, G., & Marcellino M. G. (2003). A comparison of estimation methods for dynamic factor models of large dimensions (Working Paper No. 489). Retrieved from Social Science Research Network website: http://ssrn.com/abstract=394340.
- Kim, C. J., & Nelson, C. R. (1998). Business cycle turning points, a new coincident index, and tests of duration dependence based on a dynamic factor model with regime switching. The Review of Economics and Statistics, 80, 188–201. 10.1162/003465398557447
- Krolzig, H. M. (1997). “Markov switching vector autoregressions: Modelling. Statistical inference, and application to business cycle analysis”. Berlin: Springer Science & Business Media. 10.1007/978-3-642-51684-9
- Krznar, I. (2011). Identifikacija razdoblja recesija i ekspanzija u Hrvatskoj (Identifying Recessions and Expansions in Croatia). Istraživanja HNB, 1(32), 1–17.
- Lohmus, U., & Demekas, D. (1998). An index of coincident economic indicators for Estonia. Review of Economics in Transition, 6, 77–88.
- Marcellino, M. (2006). Leading indicators. In G. Elliot, C. W. J. Granger, & A. Timmermann (Eds.), Hanbook of Economic Forecasting (pp. 879–960). Holland: Elsevier.
- Matheson, T. (2014). New indicators for tracking growth in real time. OECD Journal: Journal of Business Cycle Measurement and Analysis, 2, 51–71.
- Mitchell, W. C., & Burns, A. F. (1938). Statistical indicators of cyclical revivals. New York, NY: NBER.
- Porshakov, A., Deryugina, E., Ponomarenko, A., & Sinyakov, A. (2015). Nowcasting and short-term forecasting of Russian GDP with a dynamic factor model, BOFIT Discussion papers, 19/2015.
- Rašić Bakarić, I., Tkalec, M., & Vizek, M. (2011). Application of model-based approach to the calculation of the leading composite indicator: The case of CROLEI index. Ekonomski pregled, 62, 613–635.
- Rusnák, M. (2013). Nowcasting Czech GDP in real time, Working Papers 2013/6, Czech National Bank.
- Sargent, T. J., & Sims, C. A. (1977). Business cycle modeling without pretending to have too much a priori economic theory. In C. Sims (Ed.), New methods in business cycle research (pp. 45–109). Minneapolis, MN: Federal Reserve Bank of Minneapolis.
- Sims, C. A. (1989). Comment on Stock and Watson. NBER Macroeconomics Annual, 1989, 394–397. 10.1086/654120
- Stock, J. H., & Watson, M. W., (1988). “Probability model of the coincident indicators”, NBER Working paper, 2772.
- Stock, J. H., & Watson, M. W. (1989). New indexes of coincident and leading economic indicators. NBER macroeconomic Annual Report. Cambridge, Massachusetts: National Bureau of Economic Research, 351–394.
- Stock, J. H., & Watson, M. W. (1991). A probability model of the coincident indicators. In K. Lahiri & G. H. Moore (Eds.), Leading Economic Indicators: New approaches and forecasting records (pp. 63–89). Cambridge: Cambridge University Press.
- Stock, J. H., & Watson, M. W. (1993). A procedure for predicting recessions with leading indicators: econometric issues and recent experience. In J. H. Stock & M. W. Watson (Eds.), Business cycles, indicators and forecasting (pp. 95–156). Cambridge MA: University of Chicago Press and National Bureau of Economic Research.
- Strašek, S., & Jagrič, T. (2002). Cyclical patterns in aggregate economic activity of Slovene economy. Applied Economics, 34, 1813–1819. 10.1080/00036840210126179
- Wozniak, R. (2011). The coincident and leading business cycle indicator for Poland University of Warsaw Faculty of Economic Sciences Working Paper, 1.