
 ?Mathematical formulae have been encoded as MathML and are displayed in this HTML version using MathJax in order to improve their display. Uncheck the box to turn MathJax off. This feature requires Javascript. Click on a formula to zoom.
Abstract
Facilitation of suitable accommodation for different travellers is the prime concern of travel agencies. Travel agencies must keep themselves competitive and sustain a good pace of growth to continue raising profits by attracting and retaining as many tourists as possible through meeting their various prospective needs. To achieve this, the agencies must prepare well-organised data for hotels and destinations from a quality control perspective. Initially, the hotels are ranked and evaluated according to performance across several criteria from the tourists’ viewpoint. The relative importance of each criterion is mainly subjective and depends on the assessor’s judgement. Additionally, hotels’ rankings vary across different websites, resulting in inconsistencies. To handle such inconsistencies and subjectivity, this paper presents a collective decision-making evaluation framework by integrating a weighted interval rough number (WIRN) method and a WIRN-based complex proportional assessment (COPRAS) model to evaluate and rank hotels. An empirical example and a real-world case study from the Indian tourism industry are presented to validate the applicability of the proposed framework. Finally, a comparison and sensitivity analysis are performed to examine the validity and robustness of the proposed model.
1. Introduction
In the last two decades, India has attracted tourists from all over the world. Tourism in India is economically important and growing rapidly. The World Travel & Tourism Council calculated that tourism generated US$220 billion (9.6% of the nation’s GDP in 2016) and supported 9.3% of its total employment. The sector is predicted to grow to US$440 billion by 2027 (TTEI, Citation2017). Nowadays with the rising competition in the hotel business, hotel managers are in need of creating a balance between the ethics of the corporate world and accommodating customers’ needs. Hence, improving client satisfaction is critically important (Sohrabi, Vanani, Tahmasebipur, & Fazli, Citation2012). It is widely accepted that a quality service attitude is essential for building a long-term relationship between hotels and their customers. (Croby, Evans, & Cowels, Citation1990; Martin, Citation1986; Tsa, Citation1994). Providing a high-quality service to visitors in the present hospitality business is the highest priority of hotel management staff (Sohrabi et al., Citation2012). Tourism is also considered an excellent business opportunity by high-tech industries (Hsieh & Lin, Citation2010); hotel management and tour agencies can not only attempt to establish adequate and flexible services but also introduce more promotional initiatives to attract new consumers.
Stakeholders (in this study, hotel management and tour agencies) would like to consolidate their market share and enhance profitability in their respective business process management (BPM). Although BPM is a well-established business concept, its strategic and operational roles within organisations is still an important issue that requires investigation from various perspectives such as operations and information management (Bai & Sarkis, Citation2013). However, BPM in the tourism industry can be a risky prospect given the possibility of huge investments and uncertain consequences. In several industrial problems, a number of authors have warned of the failure rate of BPM (Abdolvand, Albadvi, & Ferdowsi, Citation2008; Bai & Sarkis, Citation2013; Bandara, Gable, & Rosemann, Citation2005). Thus, in order to implement BPM successfully and keep individual organisations’ at a good pace of growth in the tourism industry, all stakeholders require concrete knowledge of their customers’ needs and feedbacks. Through analysing these responses, both travel agencies and hotels can improve their performance by managing individual operational perspectives. Travel agencies aim to assist tourists in finding the ideal hotel at the lowest rate after aggregating information from multiple sources and comparing deals in the same city. On the other hand, from the same sources, the managers of hotels can avail a comprehensive overview of critically important indicators and criteria for evaluating hotels and their performance ratings.
Thus, the problem for evaluating and selecting appropriate hotels can be solved by taking into account the stakeholders’ preferences when defining the weights of multiple criteria such as location, infrastructure, logistics, hospitality, cleanliness, food quality, etc. Therefore, the evaluation and selection of hotels can be considered a complex multi-criteria decision-making (MCDM) problem which involves many factors, ranging from customer needs to the resource constraints of the enterprise. Now, such real-world problems become even more complicated due to imprecise data, decision-makers’ subjective judgements using linguistic terms and the use of multiple sources of information, among other factors. The evaluation process of different options in an MCDM problem, according to Fan, Zhang, Chen, and Liu (Citation2013), is based on the totally rational judgements and actions of decision-makers. However, in reality, decision-makers with diverse experiences and backgrounds use a range of linguistic terms to evaluate and assess the hierarchical importance of criteria and the preferences for different options when solving qualitative group decision-making problems (Xu & Wang, Citation2016).
Given the above, it is important to explore the methodological background for solving such uncertain MCDM problems. In general, experts’ judgements possess subjective uncertainty as well as impreciseness due to verbal assessment, which leads to non-probabilistic characteristics (Martinez, Liu, Ruan, & Yang, Citation2007). In response to this problem, many researchers have tackled real-world uncertain problems using fuzzy set theory and its various extensions (Chen, Citation2000; Pamučar & Ćirović, Citation2015; Roy, Adhikary, & Kar, Citation2016; Roy, Ranjan, Debnath, & Kar, Citation2016; Ye & Li, Citation2014). Fuzzy approaches are very efficient and useful techniques for handling imprecision; however, they need a large quantity of prior data or a robust membership function that can affect the final decision, so particular attention must be paid during the definition stage (Qazi, Lam, Xiao, Ouyang, & Yin, Citation2016; Roy, Chatterjee, Bandyopadhyay, & Kar, Citation2018; H. Wang, Yang, & Chen, Citation2016). In contrast, rough-set theory (Pawlak, Citation1982) is an alternative tool for manipulating impreciseness in data. Recently, rough-set theory and its several extensions have been effectively applied to various real-world decision-making problems (Khoo & Zhai, Citation2001; Liang et al., Citation2016; Zhai, Khoo, & Zhong, Citation2010; Zheng, Xu, & Xie, Citation2016). It is more convenient to represent the uncertainty in decision-making problems with rough numbers than with fuzzy approaches, as decisions can be made directly from the original data and rough numbers also remove the barriers that existed with previous rough-set theoretical approaches (Pawlak, Citation1998). Rough-number-based approaches rely only upon the structure of the given data, instead of needing to use various additional parameters (Song, Ming, & Liu, Citation2017; Zhu, Hu, Qi, Gu, & Peng, Citation2015). Additionally, rough-set theory can be applied to sets categorised by immaterial data for which statistical tools fail to produce fruitful results (Pawlak, Citation2012; Zheng et al., Citation2016).
In the literature that deals with MCDM problems in the tourism industry, crisp and fuzzy approaches are the most frequently applied MCDM techniques. Sohrabi et al. (Citation2012) used an exploratory factor analysis and a fuzzy logic approach to determine the most effective and influential hotel selection indicators and factors. They aimed to present a knowledge-based decision support system (DSS) to assist stakeholders with designing and implementing realistic systems to deeply study the indicators and factors of hotel selection. Sohrabi et al. (Citation2012) articulate that a systematic hotel evaluation and selection method can empower hotel managers, tourists, and the tourism industry to make decisions based on more effective indicators of high-quality services for a higher rate of satisfaction. Lin, Lee, and Chen (Citation2009) applied a fuzzy analytic hierarchy process (FAHP) to determine service performance of travel agencies and sought to establish objective standards for evaluating the best-fit model for business cooperation. Benitez, Martín, and Román (Citation2007) analysed a fuzzy technique for order of preference by similarity to ideal solution (TOPSIS) model to resolve the ambiguity of concepts that are associated with decision-makers’ subjective judgements while dynamically analysing the service quality. An integrated case-based reasoning (CBR) approach and an analytic hierarchy process (AHP) was developed by Alptekin and Büyüközkan (2010) to enhance the accuracy and speed of case-matching in tourism destination planning. Gil-Lafuente, Merigó, and Vizuete (2013) applied FAHP and a fuzzy Delphi method (FDM) to analysing criteria related to luxury resorted hotels. G. Li, Law, Vu, and Rong (Citation2013) used a Choquet-integral-based multi-criteria analysis framework for detecting travellers’ preferences when selecting hotels and their services. Zolfani, Pourhossein, Yazdani, and Zavadskas (Citation2017) applied a hybrid MCDM approach including step‐wise weight assessment ratio analysis (SWARA) and complex proportional assessment (COPRAS) methods to the evaluation of hotel construction projects, highlighting the environmental issues related to sustainability. Mardani et al. (Citation2016) developed an integrated method using FDM, FAHP, TOPSIS, and VlseKriterijuska Optimizacija I Komoromisno Resenje (VIKOR) methods for evaluating quality management practices in the hotel industry. A technology–organisation–environment (TOE) framework was used by Y.-S. Wang, Li, Li, and Zhang (Citation2016) to analyse the factors affecting hotels’ adoption of mobile reservation systems. Hodari, Turner, and Sturman (Citation2017) demonstrate how hotel managers and tour operators can act as principals to a mutual agent – the hotel’s general manager – who is responsible for ensuring that both parties benefit from how services are operated, managed, and provided.
Most of the above-mentioned literature related to the hotel industry deals with either crisp data or fuzzy information and avoids experts’ judgements, which are imprecise, subjective and vague in nature. In the present study, the WIRN concept is applied in a case study that considers web-based hotel evaluation and selection from tourism sites. Different from previous extensions of the COPRAS model, the proposed WIRN-based COPRAS model can more intelligently and flexibly handle subjectivity and vagueness in real-world decision-making problems. The authors hope that the extended COPRAS method represents a significant contribution to the Multi-Attributive Border Approximation area Comparison (MABAC) literature. Other popular MCDM models such as MABAC, TOPSIS and VIKOR are used for result comparison and validation, which essentially represents the good side of the grey, fuzzy and rough approaches. Therefore, a comparison between WIRN and the grey, fuzzy and rough approach emerges as a logical means of validation. In particular, the main emphasis is on the rough modification of the COPRAS model for finding optimal solutions to uncertain MCDM problems, which have so far not been considered in the literature. It is believed that the WIRN-based COPRAS model makes a significant contribution to the applications of DSSs in the tourism industry. Although rough-set theory is a powerful tool for manipulating subjectivity and vagueness, to the best of the authors’ knowledge no previous study has investigated such uncertainty in hotel evaluation problems by considering the perspectives of both stakeholders simultaneously. The major contributions of this study are as follows:
The theoretical advancement of treating uncertainty in the group MCDM process; the classical COPRAS model is extended for such problems using a weighted interval rough number (WIRN) method.
A novel, comprehensive and systematic evaluation framework is proposed for handling vagueness and uncertainty in real-world evaluation and selection problems.
Customers’ preferences for hotel managers, entrepreneurs and investors in the hotel industry are analysed in terms of deep investigations to identify the critically important factors for further development.
Tour operators are able to rank their hotels in a way that facilitates flexibility for customers and tourists when searching for and comparing hotels to provide the best deals while analysing multiple tourism sites.
Hotel managers and travel agencies can now make decisions based on more effective indicators of high-quality services for a higher rate of customer satisfaction.
The remainder of this paper is structured as follows. Section 2 provides the WIRN method for aggregating expert opinions in group decision-making processes and describes how to reach a consensus in such problems while working with consistent ratings. Section 3 proposes the systematic algorithm for the hybrid WIRN-based COPRAS model, which is demonstrated using an empirical example of a hotel selection problem in section 4. Then, section 5 presents a real-world case study to illustrate the proposed method, in which the evaluation and selection of 30 popular hotels in Delhi, the capital of India, is studied. A results analysis is also obtained by comparing the results with other existing methods, and this is followed by a discussion and a sensitivity analysis. Finally, section 6 concludes the paper by highlighting the contributions of this study, major implications and directions for further research.
2. Preliminaries
2.1. Weighted interval rough number (WIRN) method and group consensus
To enhance the efficiency of existing rough-set methods (Zhai, Khoo, & Zhong, Citation2008, Citation2009) and determine the relative importance and performance ratings more accurately and adaptably, Zheng et al. (Citation2016) proposed a WIRN method where the decision-makers’ heterogeneity can be merged by allocating various types of weight to each decision-maker according to her or his experience and performance in the decision-making process. In this case, unlike with rough numbers (Zhai et al., Citation2008, Citation2009), the WIRN method allows decision-makers an extra degree of flexibility in choosing the rating scale, since they can provide their ratings in terms of interval numbers instead of using a predefined crisp rating scale. The fundamental theories of Zhai et al. (Citation2010) have been used to formulate the definition of interval rough numbers in order to determine relative importance ratings and expert ratings.
2.1.1. Defining interval rough numbers
Suppose there is a set of classes of consumer discernment
ordered in a sequence of
and another set of
classes
described in the universe. In
every class is categorised in an interval, as
, where
and
represent the lower boundary and upper boundary of the ith class, respectively. Suppose that
is the universe that contains every object and
is an arbitrary object in universe
. If the lower and upper value classes are sequenced in the respective way,
, then it can be explained as another two sets of lower classes
and upper classes
, respectively. If
and
then the lower approximations of
and
are described as
(1)
(1)
and the upper approximations of
and
are characterised as
(2)
(2)
Thus, both the lower class and the upper class
are described by their lower limits
and
and their upper limits
and
, respectively, where
(3)
(3)
where and
are the summation of all involved objects in the lower approximation of
and
, respectively, and
(4)
(4)
where
and
are the summation of all involved objects in the upper approximation of
and
, respectively.
For the lower class, the rough boundary interval (RBI) of is the interval between its lower and upper limits, which is characterised as
(5)
(5)
Analogously, for the upper class,
(6)
(6)
Thus, the inexact class and
can be shown by the lower limit and upper limit as follows:
(7)
(7)
As defined by the rough-number method, each class is explained by both lower and upper values instead of a crisp number, hence it is called the interval rough number:
(8)
(8)
2.1.2. Assigning relative weights to experts according to their capabilities
Different decision-makers usually have different ideas about hotel evaluation criteria and performance. Some existing group decision-making models assign equal importance to all decision-makers and frequently cannot perfectly decide the preferences corresponding to their involvement in the organisation. However, many real-world decision-making problems consider some essential aspects of those decision-makers involved in evaluation and selection models, including: (1) their degree of participation in and attentiveness to the decision-making panel; (2) their experience level and familiarity with performance assessment information; and (3) their level of education.
In this context, if experts (decision-makers) participate in determining the criteria weights and performance ratings of the available options and
is the weight associated with each decision-maker’s feedback, where
, then the total weight can be represented as follows:
(9)
(9)
2.1.3. Defining WIRNs and quantification of experts’ ratings
According to the definition in section 2.1.2, the customer interval importance ratings are calculated with their lower and upper classes. Consider for example the four experts DM1, DM2, DM3 and DM4, (as Decision maker 1, 2, 3, 4 respectively) whose ratings of requirement are
= {Low, Low, Low, Medium} = {[2,5], [2,5], [2,5], [4,7]}. Here,
and
. Based on EquationEqs. (1)
(1)
(1) and Equation(2):
(2)
(2)
Thus, according to EquationEqs. (3)(3)
(3) and Equation(4)
(4)
(4) , (Expert 1) E1’s lower limit and upper limit are equal to:
Thus,
and
. Similarly:
;
Thus, according to EquationEqs. (3)(3)
(3) and Equation(4)
(4)
(4) , E1’s lower limit and upper limit are equal to:
Thus,
and
According to Zhai et al. (Citation2008, Citation2009), the imprecision in data can be described by the boundary interval of rough numbers. Therefore, the interval rough number method can adopt interval arithmetic operations (Kaufmann, Gupta, & Kaufmann, Citation1985; Moore Citation1966). Thus, the overall aggregated lower and upper performance ratings of each DM can be defined as follows:
(10)
(10)
where
and
represent the lower and upper approximation ratings of
, respectively, K is the total number of experts involved in the evaluation,
is the weight of the jth expert and
is the calculated WIRN rating for
. Taking the requirement
as an example, if the weights of customers DM1, DM2, DM3 and DM4 are
then based on Eq. (10)
is computed as:
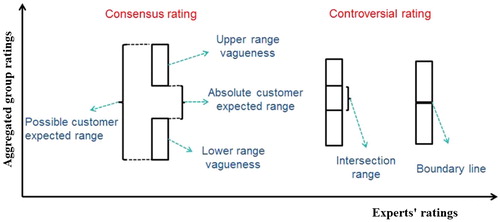
Now, it remains to verify consistency in the group decision-maker ratings. Zheng et al. (Citation2016) articulate on determining a consistent group rating for evaluation problems in the following manner: (1) there is consensus in the decision-maker panel ratings (see ) if the upper range (AUR) and lower range (ALR) of decision-makers’ ratings are disjoint, i.e. ; and (2) the group ratings are controversial if the upper range (AUR) and lower range (ALR) has an intersection, i.e.
. This non-empty intersection () denotes the fact that decision-makers have an adverse attitude towards the actual criteria importance and performance of the available options. A larger intersection means more controversy in the actual rating. In the case of controversial ratings, the ratings are divided into two different rating classes: acceptable ratings and inconsistent ratings. Only acceptable ratings and consensus ratings are regarded as consistent and used in the decision-making process.
Figure 1. Definition of consensus and controversial ratings (Zheng et al.,Citation2016).
2.1.4. Defining the upper and lower class relative importance ranges
After following the procedures laid out in section 2.1.3, if the evaluation ratings are consistent (i.e. either acceptable or consensus) then the relative importance range of the ratings, represented by , is defined as:
(11)
(11)
In the above example, a consensus rating is observed among the experts’ opinions, since . Thus,
,
, and
.
2.1.5. Removing roughness (Song et al., Citation2017)
Consider a set of rough numbers,
the rough ratings are converted into a crisp value using the following procedure of removing roughness:
Normalisation:
(12)
where .
2. Determination of a total normalised crisp value:
3. Computation of the final crisp form:
2.2. COPRAS
In order to determine the overall performance of an option, it is essential to ascertain the assessment criteria, accumulate the data related to their importance in the evaluation problem and then advance models for the evaluation of these criteria with the aim of meeting the participants’ needs. Aghdaie, Hashemkhani Zolfani, and Zavadskas (Citation2013) discuss the matter of decision-making analysis wherein a decision-maker has to make a selection from a finite number of options against multiple assessment criteria. This is known as an MCDM problem, which belongs to the broader class of DSSs. Many researchers have developed MCDM tools to solve these problems. Since Zavadskas, Kaklauskas, and Sarka (Citation1994) proposed their complex proportional assessment (COPRAS) method it has gained much attention from researchers, practitioners, and academicians. The COPRAS method (Ecer, Citation2014; Liou, Tamošaitienė, Zavadskas, & Tzeng, Citation2016; Tavana, Momeni, Rezaeiniya, Mirhedayatian, & Rezaeiniya, Citation2013) assumes direct and proportional dependencies of the significance and degree of utility of the available options under the presence of mutually conflicting criteria. It considers the performance related to each option according to different evaluation criteria and the corresponding criteria weights. Finally, this method selects the best option considering both the ideal and the ideal-worst solutions (Chatterjee, Athawale, & Chakraborty, Citation2011). This method has already been successfully applied in order to solve various problems in the fields of construction and property management, among others (Banaitiene, Banaitis, Kaklauskas, & Zavadskas, Citation2008; Chatterjee et al., Citation2011; Kaklauskas et al., Citation2006; Podvezko, Citation2011; Viteikiene, & Zavadskas Citation2007).
3. The WIRN-based COPRAS model
3.1. Step 1: criteria weighting
Since different decision-makers may come from different departments with different backgrounds and areas of expertise, each decision-maker is given a weight (where
) to reflect her or his influence on the overall evaluation and selection of appropriate hotels.
Assume that different attributes or criteria (
) are utilised as the important parameters for selecting the best hotel. Not all criteria are equally important to the decision-maker. For example, one customer may feel that the location of the hotel is less important than the cost of the rooms, whereas another customer may judge the quality of the food to be the most important factor. All of these priorities have implicit ethical reasons in which the customer can have a trade-off between her or his self-interest and responsibility to utilise the resources.
Consider the following criteria rating matrix:
(15)
(15)
The aim here is to determine the consensus rating of the relative importance of each criterion involved in the decision-making problem. Here, each is an interval valued rating or number. For
, the rating set is
. Analogously, the lower and upper class ratings are defined as follows:
(16)
(16)
Applying the WIRN method (EquationEqs. (1)(1)
(1) to Equation(11)
(11)
(11) ), one can determine the consensus rough relative importance of the criteria set described as follows:
(17)
(17)
Similarly, the consensus rough relative importance can be computed. Thus, the rough weight vectors of the criteria can be represented as
(18)
(18)
Finally, the removal of the roughness from the weight vector is performed via EquationEqs. (12)(12)
(12) to Equation(14)
(14)
(14) . Furthermore, the rough weights (
) are converted into crisp weights (
), followed by a normalisation satisfying
as follows:
(19)
(19)
3.2. Step 2: formation of the group rough decision matrix
The individual decision matrix is collected from each decision-making expert as follows:
(20)
(20)
(21)
(21)
Applying the WIRN method, the experts’ ratings are quantified and the group rough interval-valued decision matrix is obtained as follows:
(22)
(22)
The upper and lower class relative importance ranges of the consistent ratings are defined and the group rough decision matrix is constructed as follows:
(23)
(23)
where
and
. Here,
and
are denoted as rough numbers which represent the lower and upper interval ranges of the group decision ratings.
3.3. Step 3: data normalisation
The elements of the normalised matrix are determined from the initial matrix
using the following equations:
(24)
(24)
(25)
(25)
(26)
(26)
3.4. Step 4: calculating the weighted normalised decision matrix
The weighted normalised values are calculated as follows:
(27)
(27)
(28)
(28)
and
are the elements of the normalised matrix of
,
are the weight coefficients of the criteria,
is the total number of criteria, and
is the total number of options.
3.5. Step 5: computing the ideal and anti-ideal solutions
Calculating the sums of the attribute values – whose larger values are more preferable (the optimisation direction is maximisation) – for each option (each row of the decision-making matrix) is achieved as follows:
(29)
(29)
(30)
(30)
where
is the number of attributes which must be maximised (it is assumed that, in the columns of the decision-making matrix, the attributes with the optimisation direction maximum are placed first, and only then are the attributes with the optimisation direction minimum inserted).
Calculating the sums of the attribute values – whose smaller values are preferable (the optimisation direction is minimisation) – for each option (each row of the decision-making matrix) is achieved as follows:
(31)
(31)
(32)
(32)
where
is the number of attributes which must be minimised.
3.6. Step 6: determining the minimum value of
3.7. Step 7: determining the utility degree
The relative significance of each option is then calculated as follows:
(34)
(34)
EquationEq. (34)(9)
(9) can be written as follows:
(35)
(35)
The optimality criterion
is determined as follows:
(36)
(36)
When determining the priority of the hotels, the greater the significance (the relative weight of the hotel), the higher the priority (or rank) of the hotel. The relative significance
of hotel
indicates the degree of satisfaction compared to the other hotels. In the case of
, the degree of satisfaction is highest compared to the other hotels.
The degree of utility for each hotel is determined by comparing the other hotels with the best hotel. The values of the degree of utility range from 0% to 100% between the worst and best hotels. The utility degree for each hotel
is calculated as follows:
(37)
(37)
where
and
are obtained in EquationEq. (34)
(34)
(34) to EquationEq. (36)
(36)
(36) .
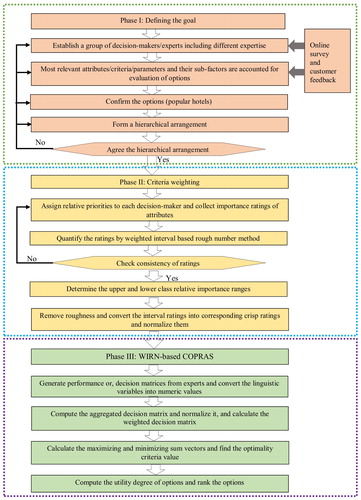
The decision approach proposed in this section allows the evaluation of the direct and proportional dependencies of the significance and degree of utility of all options based on a system of attributes, weights and attribute values. represents the step-by-step methodology of the WIRN-based COPRAS model.
Figure 2. Framework for the hierarchical evaluation model using the proposed WIRN-based COPRAS method.
4. Empirical study
This empirical study was supplemented for a travel agency in an Indian tourism industry. Travel organisations, tour operators, tourists, information, and materials (hotels and resorts) are all integral elements of the tourism industry that play a part in achieving some of the individual objectives which are predetermined. Travel agencies must keep themselves competitive and sustain a pace of growth that is sufficient to maintain and increase profits at both the local and the global scale. In order to achieve this, travel agents – along with hotels – need access to a well-organised database of hotels and tourist locations that provides a range of information about the quality of the facilities and tourist experience. Traditional assessment techniques are no longer sufficient for surviving in an increasingly crowded and competitive industry with many innovative newcomers. Companies therefore need to embrace new methods and techniques in order to increase efficiency and improve their overall quality management.
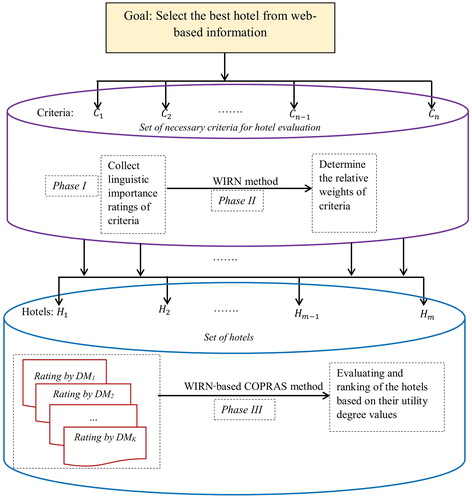
Performance assessment can be termed as receiving feedback on actions taken to achieve strategic goals aimed at satisfying customer demands. It represents the condition of the current systems. Therefore, productivity and the level of quality can be increased by applying the information obtained from performance assessments (Chan, Citation2003). The quality of any hotel is determined by a number of criteria (e.g. location, cleanliness, value for money, facilities, buildings, rooms, services, food, comfort, etc.). However, all of these criteria are not equally important to evaluating quality; therefore, it is essential to determine the weight that should be applied to each criterion, which can be achieved by conducting surveys to capture customers’ experiences and preferences. This process is depicted in .
Figure 3. Web-based hotel selection using the proposed method.
Next, the collected data are analysed by a group of five decision-makers (DM1, DM2, DM3, DM4, and DM5) with different expertise in various aspects of the tourism industry. Since decision-makers from different departments are likely to have varying backgrounds and expertise, each decision-maker provides a weight ,
) to reflect her or his influence on the overall material selection results. After carefully analysing the decision-makers’ opinions on the relative importance of each criterion, the performance assessment is used to determine the most suitable hotels by using the linguistic terms presented in . In view of the uncertainty, vagueness and subjectivity in the judgements of decision-makers and experts, the candidate hotels are evaluated against three of the most important criteria: location (C1), hospitality (C2) and price (C3). The linguistic assessments of the four hotels provided by the five decision-makers are given in . In this example, it is assumed that the five decision-makers have equal weights and the information.
Table 1. Linguistic assessment and associated interval values.
Table 2. Optimality criteria value, utility degree and ranking.
The approach proposed in section 3 above can then be applied to determine the most desirable hotel(s) as follows.
In step 1, the normalised weights are determined for the evaluation criteria. Based on , which lists the seven-point linguistic rating scale introduced by Rajesh and Ravi (Citation2015), a linguistic weight matrix can be obtained. The linguistic ratings are converted into their corresponding interval numbers as follows:
According to the WIRN method (section 2.1, EquationEqs. (1)(1)
(1) to Equation(14)
(14)
(14) ), the collective weights of criteria
can be calculated as follows:
Once the criteria weights are determined, step 2 is to collect the individual decision matrices from each decision-maker, and the linguistic decision matrices are converted into their corresponding interval valued decision matrices. The interval rough aggregated decision matrix
is computed using EquationEqs. (1)
(1)
(1) to Equation(11)
(11)
(11) :
Now, it can be observed that the aggregated group decision ratings are consistent (refer to section 2.1.3), so these ratings are used in the hotel evaluation procedure. Next, the lower and upper class relative importance ranges of these consistent ratings are defined in order to obtain the aggregated rough decision matrix :
In step 3, using EquationEqs. (24)(23)
(23) and Equation(25)
(25)
(25) , the aggregated group rough decision matrix
is normalised in order to transform various units in the decision matrix into dimensionless comparable units. The normalised decision matrix is then obtained:
Next, in step 4, EquationEq. (28)(28)
(28) is used to lodge the criteria weights (obtained in step 1) into the normalised rough decision matrix and obtain the weighted normalised rough decision matrix
:
When customers and experts evaluate the hotels, value for money () and hospitality
) are maximising criteria whereas price (
) is a minimising criterion. For example, if a hotel is evaluated as Very good regarding price (
), this means that the customer is satisfied with the value for money of that hotel – i.e. that the price was relatively low compared to the value obtained. On the other hand, if a hotel is evaluated as Low regarding location (
), this means that the accessibility of the hotel is unsatisfactory – i.e. the accessibility was relatively poor.
Thus, in step 5 the maximising sum vector and minimising sum vector
are computed according to EquationEqs. (29)
(29)
(29) and Equation(31)
(31)
(31) , respectively. In these two equations,
(two maximising criteria),
(total number of criteria), and there is one minimising criteria. From the weighted normalised decision matrix
, considering the row-sum one can easily calculate
. Similarly,
,
and
are also computed. According to EquationEq. (31)
(31)
(31) ,
is nothing but the third column vector of the weighted normalised decision matrix
:
Next, the rough interval values in both and
are transformed into their crisp values after removing the roughness using EquationEqs. (12)
(12)
(12) to Equation(14)
(14)
(14) . Note that
(for
vector). The total normalised crisp vector of
is
. To efficiently conduct the evaluation and selection of the best hotel(s), the final crisp value of
vector is calculated by using EquationEq. (14)
(14)
(14) as follows. Final crisp value of
can be obtained in a similar manner.
Step 6. The minimum value of is calculated via EquationEq. (33)
(33)
(33) .
Step 7. The relative priority vector of the available hotels and the optimality criteria value
are computed using EquationEqs. (35)
(35)
(35) and Equation(36)
(36)
(36) , respectively. Finally, the degree of utility
for each hotel
is calculated by EquationEq. (37)
(37)
(37) and shown in . Therefore, based on the degrees of utility, the final conclusion of this case study is that hotel
be given the top priority in this evaluation and selection problem, followed by
,
, and finally
.
5. A real-world case study
Tripadvisor (http://www.tripadvisor.in), MakeMyTrip (http://www.makemytrip.com), Goibibo (http://www.goibibo.com), and Cleartrip (http://www.cleartrip.com) are some of the prominent tourism websites that contain more than 200 million travel reviews submitted by travellers. These reviews largely consist of the honest and unbiased opinions of travellers who have experienced destinations, hotels, scenic spots, restaurants, and more. Consequently, prospective travellers can choose their future destinations and hotels based on the latest reviews on these sites. Thus, travellers can get the best deals by comparing same hotels based on the data available on those sites. For the purposes of this case study, therefore, these service provider sites can be considered as the decision-makers, i.e., Tripadvisor (DM1), MakeMyTrip (DM2), Goibibo (DM3), and Cleartrip (DM4). These websites contain the users’ ratings and overall performance based on these ratings. Most of the customers give their feedback in terms of the following criteria: location (), hospitality (
), facilities (
), cleanliness (
), value for money (
), food (
), and price (
). All the criteria are the maximising type with the exception of price. The performance of each hotel is measured against the first six criteria using a 5-point rating scale (where 5 = excellent, 4 = very good, 3 = average, 2 = poor, and 1 = terrible), while price is considered as a multiple of Rs. 1000. Now, the tourism sites only provide crisp ratings. Thus, in order to make the data fit the WIRN-based model, the ratings must be treated as interval valued. For example, the hospitality ratings of Hotel
are 4.4, 5.0, 4.7, and 4.6 based on the raw data available online on the four sites. The proposed model therefore takes these input ratings as [4.4, 4.4], [5.0, 5.0], [4.7, 4.7] and [4.6, 4.6], respectively. All the tourism sites, from where the raw data are collected, are among most popular sites. So, it is difficult to assign unequal weights to these sites. Thus, for simplicity, equal weights (
) are assigned to all four decision-makers
.
In order to avoid possible confusion, the linguists () and the decision-makers (DMs) are differentiated between in this case study. Ten linguists with expertise in hotel and tourism management and work experience of at least 15 years were assigned to opine on the criteria weights, and the four decision-makers (the tourism sites) provided the hotels’ performance ratings against these criteria based on real customer feedback. Note that, here, the ten linguists have unequal weight priorities, with
.
From section 4 it is clear that the web-based hotel evaluation and the ranking problem (from the perspective of either a tour operator or a hotel manager) can be divided into three phases. In the first phase, the experts’ linguistic ratings of the relative priorities of the essential criteria for evaluating the hotels were obtained (). In the second stage, the WIRN method was applied in order to obtain the interval weights for each factor, after which these weights were normalised. In the third phase, 30 popular hotels in Delhi (the capital of India) were evaluated against those seven criteria by applying the WIRN-based COPRAS method, and the priority order of these hotels was determined.
In the first phase, since the importance of the evaluation criteria is not easy to precisely determine, the linguistic ratings of the experts () can either be quantified by a crisp number (e.g. 5, 6, 7) with certainty or by interval numbers with uncertainty (e.g. [4, 5], [6, 8]), which represents the flexibility of experts’ views and the ways in which they are expressed. Also, the managers of the tour agency or the hotels need to determine the ‘dependability’ of the experts’ ratings by assigning a certain weight to each expert. In this case study, the relative importance of the criteria weights in terms of the linguistic ratings are presented in and converted into interval numbers in .
Table 3. Linguistic assessment of criteria weights.
Table 4. Interval rating assessment of criteria weights.
The second phase involves the WIRN method, which uses EquationEqs. (1)(1)
(1) to Equation(11)
(11)
(11) to collectively compute the criteria weights as interval numbers (). After this was completed, these weights were normalised after removing the roughness using EquationEqs. (12)
(12)
(12) to Equation(14)
(14)
(14) .
Table 5. Criteria weights as WIRNs, rough numbers, crisp weights and normalised weights.
In the third phase, the WIRN-based COPRAS method was used to rank the 30 selected Delhi hotels. presents the raw data of the hotels’ performance ratings collected from the four tourism sites. The ratings were then converted into their corresponding interval rough aggregated decision matrices (see ), computed using EquationEqs. (1)(1)
(1) to Equation(11)
(11)
(11) . The upper and lower class relative importance ranges of the consistent ratings and the group rough decision matrix were formulated using EquationEq. (23)
(23)
(23) . After defining the lower and upper relative ranges, the decision matrix in was normalised and then criteria weights were lodged into this matrix, yielding the weighted normalised rough decision matrix (). then presents the computational results of steps 5 to 7 of the proposed WIRN-based COPRAS model.
Table 6. Original performance ratings from different tourism sites (raw data).
Table 7. Aggregated rough decision matrix.
Table 8. Weighted normalised rough decision matrix.
Table 9. Optimality criteria value, utility degree of alternatives and rankings.
The maximising and minimising sum vectors and
can be formed using EquationEqs. (29)
(29)
(29) and Equation(31)
(31)
(31) , respectively. To effectively conduct the assessment and ranking of the best hotel(s), these sums need to be converted into the crisp forms. The relative priority vector
of the available hotels and the optimality criteria value
were computed using EquationEqs. (35)
(35)
(35) and Equation(36)
(36)
(36) , respectively. Finally, the degree of utility
for each hotel (
) was calculated using EquationEq. (37)
(37)
(37) , as shown in . Therefore, based on their degree of utility (see ), the final conclusion of this case study is that Hotel
is ranked as the best hotel in this evaluation and selection problem.
5.1. Comparison and discussion
The rationality and dependability of the rankings attained by the proposed WIRN-based COPRAS model were demonstrated using a comparative analysis. The same hotel ranking problem was solved using the following comparable MCDM methods: COPRAS-G (Zavadskas, Kaklauskas, Turskis, & Tamošaitienė, Citation2009), rough MABAC (Roy, Adhikary, Kar, & Pamučar, Citation2018), rough TOPSIS (Song, Ming, Wu, & Zhu, Citation2014), rough VIKOR (Zhu et al., Citation2015) and IVIF-COPRAS (Razavi Hajiagha, Hashemi, & Zavadskas, Citation2013).
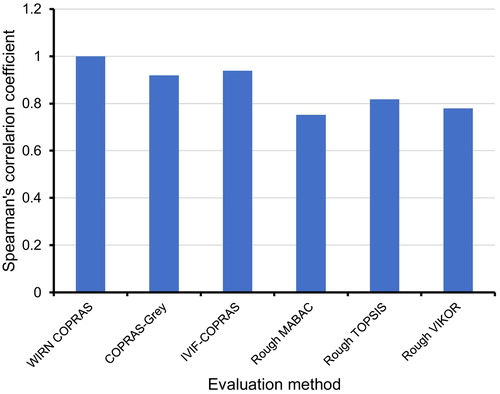
The rankings obtained from these five methods are shown in for comparison. In order to establish the connection between the results obtained using six different approaches (), Spearman’s correlation coefficient (SCC) was used. The SCC of ranks is a useful and important indicator for determining the links between the results obtained using different approaches (Pamučar, Petrović, & Ćirović, Citation2018). In addition, SCC is suitable for use when there are ordinal variables or ranked variables, as is the case here. SCC was used in this study to define the statistical significance of the difference between the ranks obtained by the different approaches. The results of the comparison of ranks using SCC can be seen in , which shows a high correlation between the ranks among the MCDM methods examined. All SCC values greater than 0.752 show extremely high correlation. Since in this case all the SCC values are significantly greater than 0.752, and the average value is 0.841, it can be concluded that there is a very high correlation (closeness) between the proposed WIRN-based COPRAS approach and the other approaches for the treatment of uncertainty. Based on these results it can be concluded that the proposed ranking is robust and credible – and in addition to confirming the credibility of the ranking, it can also be concluded that an approach based on WIRNs successfully exploits the uncertainties that occur in group decision-making.
Table 10. Comparative rankings of hotels using various evaluation methods.
The computational steps are not included here, since this section is devoted to a comparison of the final rankings. From it can be seen that the five top-ranked hotels (H18, H5, H25, H10, H4) and the five bottom-ranked hotels (H7, H8, H16, H11, H29)obtained using the proposed approach are the same as those produced by the other MCDM methods, and there is no change in the best-ranked hotel; Hotel H18 enjoys its status as the first choice in all cases, thus demonstrating the validity of the proposed approach.
Thus, from the above analysis, it can be seen that the results are a good match to each other and to the results of the original ranking order (refer to Table 9). Compared with the five methodologies used in the above comparative analysis, the proposed WIRN-based COPRAS has the following advantages:
In the COPRAS-G model (Zavadskas et al., Citation2009), the evaluations are performed using a single decision matrix that cannot be directly applied to group decision-making problems. In real-world problems, organisations more frequently perform group decision-making. Also, in interval analysis rough numbers and grey numbers follow the arithmetic operations that are defined (Kaufmann et al., Citation1985; Moore, Citation1966), and a larger range in the intervals means more vagueness and controversy in the decision-makers’ ratings. However, the WIRN aggregation method is preferable compared to the grey aggregation method. For example, if group decision ratings are presented by
The rough MABAC (Roy, Adhikary, et al., Citation2018), rough TOPSIS (Song et al., Citation2014) and rough VIKOR (Zhu et al., Citation2015) models have a group decision model where implicitly all the decision-makers are given equal priority, i.e. all the decision-makers on the decision-making panel have an equal capability of assessing the options. However, this is not always true in the real world, where different decision-makers have different priorities according to their capabilities and experience with the specific decision-making problem. Therefore, these methods have to directly adopt the rough aggregated decision matrix in order to produce a fruitful result. However, shows that the ranking orders produced by them are quite similar to the ranking order produced by the model proposed in this study, and Hotel H18 remains the best choice against the seven criteria according to all three methods.
The IVIF-COPRAS method (Razavi Hajiagha et al., Citation2013) was developed for group decision-making problems where the decision-makers have hierarchical priorities according to their capabilities and experience in decision-making. The proposed WIRN-based COPRAS has a benefit over this model in that most fuzzy approaches need to adapt a lot of auxiliary information, such as having a robust membership function and a fixed interval rating, which results in implicit subjectivity. However, WIRN methods manipulate the subjective and vague information in such decision-making problems. These methods can handle both qualitative (subjective rating) and quantitative (objective assessment) data. Unlike fuzzy approaches, WIRN methods rely directly on the raw data only; therefore, decisions can be made without the need for using auxiliary information. Thus, the proposed approach is preferable to the IVIF-COPRAS approach for a range of group decision-making problems that deal with subjective and vague data.
5.2. Sensitivity analysis
In MCDM, it is useful to perform sensitivity analyses in order to test the stability of the proposed framework and the final ranking. A large number of sensitivity analyses are performed due to slight variations in the relative weights of the criteria (Debnath, Roy, Kar, Zavadskas, & Antucheviciene, Citation2017). The relative weights of some criteria are increased and some of them are decreased as follows:
(38)
(38)
where
is the percentage change in
. Similar to original weights, the total new sum is also kept at unity, i.e.
. In the present study, the criteria weights were calculated by means of linguistic inputs. Thus, the robustness testing was conducted by changing the weights assigned to the criteria for evaluating and selecting most preferable hotels. This also has the added benefit of cross-checking the reliability of the decision-making. Small changes (refer to ) in the criteria weights have little effect on the final rankings of the 30 hotels. The outcomes of the sensitivity analysis endorse that H18, H5, H25, H10, and H4 are the top five hotels in Delhi. From , it can be seen that the ranking order drastically changes if the criteria weights undergo huge changes. Additionally, Hotel H18 has the top ranking in most of the scenarios, with the exception of Scenarios 6 and 8. In these two cases, a drastic change (increase and/or decrease) is made to the priorities of all the criteria and consequently a big change is observed in the weights (). Such actions affect the final rankings and Hotel H5 is promoted to the highest ranking, followed by H18, H10, H25, and H4.
Table 11. Different set of new weights.
Table 12. Hotel rankings for different scenarios.
In summary, the ranking remains consistent unless drastic changes are made to the weights of the criteria. Therefore, the sensitivity analysis shows robustness in ranking order of the 30 hotels in this case study (). Hotels H18 and H5 enjoy the top two ranks in all scenarios, and may therefore be selected as the best by the decision-makers. Thus, sensitivity analyses may be meaningful for assessing different hotels as viable options, while booking is made completely based on the online information available on tourism sites.
6. Conclusions
In this study a new model for dealing with conditions of uncertainty is proposed which integrates the WIRN method and the COPRAS technique in order to conduct a web-based process of hotel evaluation and selection. The WIRN method is used to capture interval assessment information, thus allowing the decision-makers an extra degree of flexibility, and the modified decision-making method was tested by using it to rank 30 of the most popular hotels in Delhi, a metro city of India. Several important criteria were assessed by the WIRN method in order to assign them with the appropriate weights and then evaluate them for the purpose of ranking the 30 hotels. Additionally, the interval weight information and inputs from experts regarding evaluation criteria are more realistic for many practical MCDM problems, especially in complex and uncertain environments. Finally, the application of the proposed approach has been presented using a real-world case study and demonstrated by means of testing using some specific hotels in an Indian metro city.
The three major implications of this study are as follows. First, value for money (), food (
) and facilities
were identified as the most important criteria according to the decision-making panel which analysed customers’ preferences and feedback, while price (
) and location (
) were identified as the least important. A probable reason for this may be that experts have observed that customers are willing to pay a reasonable amount more for higher quality food and facilities. However, this does not mean that price and location are unimportant, and stakeholders (in this case the hotel management and the tour operators) can use these criteria to stand apart from their closest competitors. Second, hotel managers can use the proposed model to form a clear view of how their hotel is performing and how they are ranked against their competitors. Having access to such information can allow the hotel managers to target their weakest areas and take steps to perform better and improve the quality of the services that are most lacking. Third, the proposed knowledge-based DSS has the ability to rank any hotel after analysing and comparing data gathered from multiple tourism sites, which can help managers to form a deeper understanding of a range of opinions and tastes from a broader customer base without needing to engage in targeted research such as opinion surveys.
The main highlights of this paper are as follows:
Development of a hierarchical and methodological procedure with step-wise derivation to deal with vague and subjective information in MCDM problems, which in this case was applied to hotel selection from several tourism websites.
The WIRN-based COPRAS method consists of a comprehensive, rational and sensible algorithmic methodology for solving evaluation problems.
The overall performance was tested with a quantitative analysis that helped to classify the best and worst hotels, as well as those in the middle, in a single frame (see ).
Figure 4. Pictorial representation of hotels’ degree of utility values and performance.
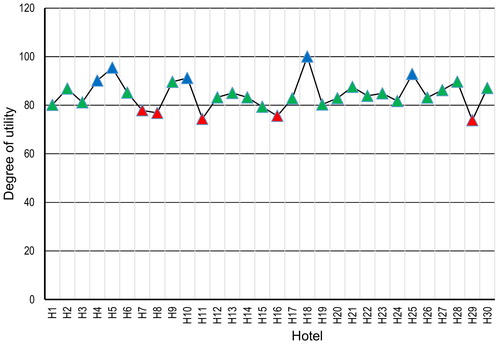
Figure 5. Spearman’s rank correlation coefficient.
The model features a flexible MCDM framework that can also be applied to other MCDM problems.
The proposed ranking method will enable travel agencies and hotels to keep up with global standards, and customers will benefit from obtaining a clear picture of the present standard of the hotels based on the reviews and feedback of real-world users.
Although the proposed research framework serves its purpose well and produces satisfactory results, there are still some limitations. The criteria are assumed to be independent, meaning that any interdependencies and influential relations are not modelled for the sake of simplicity. According to systems theory and real-world conditions, all things in an environment are interrelated in some form or another, so it is not realistic to ignore this fundamental law. Moreover, only seven evaluation criteria and 30 hotels in an Indian metropolitan city were considered when testing the model, i.e. the size of the data set is small.
There are a number of possibilities for further research. Decision-making trial and evaluation laboratory (DEMATEL) and analytic network process (ANP) methods can be incorporated into the proposed WIRN-based COPRAS model in order to account for some of the interdependencies and influences among the criteria, and better represent their relative priorities. It would also be interesting to verify the use of the proposed model in combination with other methods, such as the rough analytic hierarchy process (R-AHP; Gigović, Pamučar, Bajić, & Drobnjak, Citation2017; Sharma, Roy, Kar, & Prentkovskis, Citation2018) and rough DEMATEL (Pamučar, Mihajlović, Obradović, & Atanasković, Citation2017; Roy, Adhikary, et al., Citation2018). Another extension to the work could consist of the incorporation of strategic management perspectives via balanced scorecards (BSCs) and corporate social responsibility (CSR) tools so that travel agencies and hotels are able to launch successful new products and services and set up effective new product and service development processes. Additionally, travel agencies and hotels must attempt to identify new customer needs and requirements in order to create custom experiences and new marketing strategies to draw in curious potential customers.
Acknowledgements
We wish to express our deepest appreciation to the editors and the anonymous reviewers.
Disclosure statement
No potential conflict of interest was reported by the authors.
Additional information
Funding
Related Research Data
References
- Abdolvand, N., Albadvi, A., & Ferdowsi, Z. (2008). Assessing readiness for business process reengineering. Business Process Management Journal, 14(4), 497–511. doi:10.1108/14637150810888046
- Aghdaie, M. H., H., Zolfani, S., & Zavadskas, E. K. (2013). Decision making in machine tool selection: An integrated approach with SWARA and COPRAS-G methods. Engineering Economics, 24(1), 5–17.
- Alptekin, G. I., & Büyüközkan, G. (2011). An integrated case-based reasoning and MCDM system for web based tourism destination planning. Expert Systems with Applications, 38(3), 2125–2132. doi:10.1016/j.eswa.2010.07.153
- Bai, C., & Sarkis, J. (2013). A grey-based DEMATEL model for evaluating business process management critical success factors. International Journal of Production Economics, 146(1), 281–292. doi:10.1016/j.ijpe.2013.07.011
- Banaitiene, N., Banaitis, A., Kaklauskas, A., & Zavadskas, E. K. (2008). Evaluating the life cycle of a building: A multivariant and multiple criteria approach. Omega, 36(3), 429–441. doi:10.1016/j.omega.2005.10.010
- Bandara, W., Gable, G. G., & Rosemann, M. (2005). Factors and measures of business process modelling: Model building through a multiple case study. European Journal of Information Systems, 14(4), 347–360. doi:10.1057/palgrave.ejis.3000546
- Benitez, J. M., Martín, J. C., & Román, C. (2007). Using fuzzy number for measuring quality of service in the hotel industry. Tourism Management, 28(2), 544–555. doi:10.1016/j.tourman.2006.04.018
- Chan, F. T. (2003). Performance measurement in a supply chain. The International Journal of Advanced Manufacturing Technology, 21(7), 534–548. doi:10.1007/s001700300063
- Chatterjee, P., Athawale, V. M., & Chakraborty, S. (2011). Materials selection using complex proportional assessment and evaluation of mixed data methods. Materials & Design, 32(2), 851–860. doi:10.1016/j.matdes.2010.07.010
- Chen, C. T. (2000). Extensions of the TOPSIS for group decision-making under fuzzy environment. Fuzzy Sets and Systems, 114(1), 1–9. doi:10.1016/S0165-0114(97)00377-1
- Croby, L. A., Evans, K. R., & Cowels, D. (1990). quality in service selling: An interprersonal influence perspective. Journal of Marketing, 54(2), 68–81. doi:10.2307/1251817
- Debnath, A., Roy, J., Kar, S., Zavadskas, E. K., & Antucheviciene, J. (2017). A Hybrid MCDM Approach for Strategic Project Portfolio Selection of Agro By-Products. Sustainability, 9(8), 1302. doi:10.3390/su9081302
- Ecer, F. (2014). A hybrid banking websites quality evaluation model using AHP and COPRAS-G: A Turkey case. Technological and Economic Development of Economy, 20(4), 758–782. doi:10.3846/20294913.2014.91559
- Fan, Z. P., Zhang, X., Chen, F. D., & Liu, Y. (2013). Extended TODIM method for hybrid multiple attribute decision making problems. Knowledge-Based Systems, 42, 40–48. doi:10.1016/j.knosys.2012.12.014
- Gigović, L., Pamučar, D., Bajić, Z., & Drobnjak, S. (2017). Application of GIS-interval rough AHP methodology for flood hazard mapping in urban areas. Water, 9(6), 360. doi:10.3390/w9060360
- Gil-Lafuente, A. M., Merigó, J. M., & Vizuete, E. (2014). Analysis of luxury resort hotels by using the fuzzy analytic hierarchy process and the fuzzy Delphi method. Economic Research-Ekonomska Istraživanja, 27(1), 244–266. doi:10.1080/1331677X.2014.952106
- Hodari, D., Turner, M. J., & Sturman, M. C. (2017). How hotel owner–operator goal congruence and GM autonomy influence hotel performance. International Journal of Hospitality Management, 61, 119–128. doi:10.1016/j.ijhm.2016.11.008
- Hsieh, L. F., & Lin, L. H. (2010). A performance evaluation model for international tourists hotels in Taiwan: An application of the relational network DEA. International Journal of Hospitality Management, 29(1), 14–24. doi:10.1016/j.ijhm.2009.04.004
- Kaklauskas, A., Zavadskas, E. K., Raslanas, S., Ginevicius, R., Komka, A., & Malinauskas, P. (2006). Selection of low-e windows in retrofit of public buildings by applying multiple criteria method COPRAS: A Lithuanian case. Energy and Buildings, 38(5), 454–462. doi:10.1016/j.enbuild.2005.08.005
- Kaufmann, A., Gupta, M. M., & Kaufmann, A. (1985). Introduction to fuzzy arithmetic: Theory and applications. New York: Van Nostrand Reinhold Company.
- Khoo, L. P., & Zhai, L. Y. (2001). A prototype genetic algorithm-enhanced rough set-based rule induction system. Computers in Industry, 46(1), 95–106. doi:10.1016/S0166-3615(01)00117-8
- Liang, H., Ren, J., Gao, Z., Gao, S., Luo, X., Dong, L., & Scipioni, A. (2016). Identification of critical success factors for sustainable development of biofuel industry in China based on grey decision-making trial and evaluation laboratory (DEMATEL). Journal of Cleaner Production, 131, 500–508. doi:10.1016/j.jclepro.2016.04.151
- Li, G.-D., Yamaguchi, D., & Nagai, M. (2007). A grey-based decision-making approach to the supplier selection problem. Mathematical and Computer Modelling, 46(3–4), 573–581. doi:10.1016/j.mcm.2006.11.021
- Li, G., Law, R., Vu, H. Q., & Rong, J. (2013). Discovering the hotel selection preferences of Hong Kong inbound travelers using the Choquet Integral. Tourism Management, 36, 321–330. doi:10.1016/j.tourman.2012.10.017
- Lin, C. T., Lee, C., & Chen, W. Y. (2009). Using fuzzy analytic hierarchy process to evaluate service performance of a travel intermediary. The Service Industries Journal, 29(3), 281–296. doi:10.1080/02642060701846762
- Liou, J. J., Tamošaitienė, J., Zavadskas, E. K., & Tzeng, G. H. (2016). New hybrid COPRAS-G MADM Model for improving and selecting suppliers in green supply chain management. International Journal of Production Research, 54(1), 114–134. doi:10.1080/00207543.2015.1010747
- Mardani, A., Jusoh, A., Zavadskas, E. K., Zakuan, N., Valipour, A., & Kazemilari, M. (2016). Proposing a new hierarchical framework for the evaluation of quality management practices: A new combined fuzzy hybrid MCDM approach. Journal of Business Economics and Management, 17(1), 1–16. doi:10.3846/16111699.2015.1061589
- Martínez, L., Liu, J., Ruan, D., & Yang, J. B. (2007). Dealing with decision-making information in engineering evaluation processes. Information Sciences, 177(7), 1533–1542. doi:10.1016/j.ins.2006.07.005
- Martin, W. B. (1986). Quality service: The restaurant manger’s bible. Ithaca, NY: Cornell University Press.
- Moore, R. E. (1966). Interval analysis. Vol. 4. Englewood Cliffs: Prentice-Hall.
- Pamučar, D., & Ćirović, G. (2015). The selection of transport and handling resources in logistics centers using Multi-Attributive Border Approximation area Comparison (MABAC). Expert Systems with Applications, 42(6), 3016–3028. doi:10.1016/j.eswa.2014.11.057
- Pamučar, D., Mihajlović, M., Obradović, R., & Atanasković, P. (2017). Novel approach to group multi-criteria decision making based on interval rough numbers: Hybrid DEMATEL-ANP-MAIRCA model. Expert Systems with Applications, 88, 58–80. doi:10.1016/j.eswa.2017.06.037
- Pamučar, D., Petrović, I., & Ćirović, G. (2018). Modification of the Best–Worst and MABAC methods: A novel approach based on interval-valued fuzzy-rough numbers. Expert Systems with Applications, 91, 89–106. doi:10.1016/j.eswa.2017.08.042
- Pawlak, Z. (1982). Rough sets. International Journal of Computer & Information Sciences, 11(5), 341–356. doi:10.1007/BF01001956
- Pawlak, Z. (1998). An inquiry into anatomy of conflicts. Information Sciences, 109(1–4), 65–78. doi:10.1016/S0020-0255(97)10072-X
- Pawlak, Z. (2012). Rough sets: Theoretical aspects of reasoning about data. New York: Springer Science & Business Media
- Podvezko, V. (2011). The comparative analysis of MCDA methods SAW and COPRAS. Inzinerine Ekonomika – Engineering Economics, 22(2), 134–146. doi:10.5755/j01.ee.22.2.310
- Qazi, K. I., Lam, H. K., Xiao, B., Ouyang, G., & Yin, X. (2016). Classification of epilepsy using computational intelligence techniques. CAAI Transactions on Intelligence Technology, 1(2), 137–149. doi:10.1016/j.trit.2016.08.001
- Rajesh, R., & Ravi, V. (2015). Modeling enablers of supply chain risk mitigation in electronic supply chains: A Grey–DEMATEL approach. Computers & Industrial Engineering, 87, 126–139. doi:10.1016/j.cie.2015.04.028
- Razavi, S. H., Hashemi, S. S., & Zavadskas, E. K. (2013). A complex proportional assessment method for group decision making in an interval-valued intuitionistic fuzzy environment. Technological and Economic Development of Economy, 19(1), 22–37. doi:10.3846/20294913.2012.762953
- Roy, J., Adhikary, K., & Kar, S. (2016). Credibilistic TOPSIS Model for Evaluation and Selection of Municipal Solid Waste Disposal Methods [online]. https://arxiv.org/ftp/arxiv/papers/1606/1606.08965.pdf
- Roy, J., Adhikary, K., Kar, S., & Pamučar, D. (2018). A rough strength relational DEMATEL model for analysing the key success factors of hospital service quality. Decision Making: Applications in Management and Engineering, 1(1), 121–142. doi:10.31181/dmame1801121r
- Roy, J., Chatterjee, K., Bandyopadhyay, A., & Kar, S. (2018). Evaluation and selection of medical tourism sites: A rough analytic hierarchy process based multi‐attributive border approximation area comparison approach. Expert Systems, 35(1), e12232. doi:10.1111/exsy.12232
- Roy, J., Ranjan, A., Debnath, A., & Kar, S. (2016). An extended MABAC for multi-attribute decision making using trapezoidal interval type-2 fuzzy numbers. https://arxiv.org/pdf/1607.01254v4.pdf
- Sharma, H. K., Roy, J., Kar, S., & Prentkovskis, O. (2018). Multi Criteria Evaluation Framework for Prioritizing Indian Railway Stations Using Modified Rough AHP-Mabac Method. Transport and Telecommunication Journal, 19(2), 113–127. doi:10.2478/ttj-2018-0010
- Sohrabi, B., Vanani, I. R., Tahmasebipur, K., & Fazli, S. (2012). An exploratory analysis of hotel selection factors: A comprehensive survey of Tehran hotels. International Journal of Hospitality Management, 31(1), 96–106. doi:10.1016/j.ijhm.2011.06.002
- Song, W., Ming, X., & Liu, H. C. (2017). Identifying critical risk factors of sustainable supply chain management: A rough strength-relation analysis method. Journal of Cleaner Production, 143, 100–115. doi:10.1016/j.jclepro.2016.12.145
- Song, W., Ming, X., Wu, Z., & Zhu, B. (2014). A rough TOPSIS approach for failure mode and effects analysis in uncertain environments. Quality and Reliability Engineering International, 30(4), 473–486. doi:10.1002/qre.1500
- Tavana, M., Momeni, E., Rezaeiniya, N., Mirhedayatian, S. M., & Rezaeiniya, H. (2013). A novel hybrid social media platform selection model using fuzzy ANP and COPRAS-G. Expert Systems with Applications, 40(14), 5694–5702. doi:10.1016/j.eswa.2013.05.015
- Travel and Tourism Economic Impact (TTEI). (2017). World Travel and Tourism Council. https://www.wttc.org/-/media/files/reports/economic-impact-research/countries-2017/india2017.pdf
- Tsa, R. F. (1994). Competencies important for hotel manager trainees. The Cornell Hotel and Restaurant Administration Quarterly, 29(2), 41–43.
- Viteikiene, M., & Zavadskas, E. K. (2007). Evaluating the sustainability of Vilnius city residential areas. Journal of Civil Engineering and Management, 13(2), 149–155.
- Wang, H., Yang, B., & Chen, W. (2016). Unknown constrained mechanisms operation based on dynamic interactive control. CAAI Transactions on Intelligence Technology, 1(3), 259–271. doi:10.1016/j.trit.2016.10.004
- Wang, Y.-S., Li, H.-T., Li, C.-R., & Zhang, D.-Z. (2016). Factors affecting hotels’ adoption of mobile reservation systems: A technology-organization-environment framework. Tourism Management, 53, 163–172. doi:10.1016/j.tourman.2015.09.021
- Xu, Z., & Wang, H. (2016). Managing multi-granularity linguistic information in qualitative group decision making: An overview. Granular Computing, 1(1), 21–35. doi:10.1007/s41066-015-0006-x
- Ye, F., & Li, Y. (2014). An extended TOPSIS model based on the possibility theory under fuzzy environment. Knowledge-Based Systems, 67, 263–269. doi:10.1016/j.knosys.2014.04.046
- Zavadskas, E. K., Kaklauskas, A., & Sarka, V. (1994). The new method of multicriteria complex proportional assessment of projects. Technological and Economic Development of Economy, 1(3), 131–139.
- Zavadskas, E. K., Kaklauskas, A., Turskis, Z., & Tamošaitienė, J. (2009). Multi-attribute decision-making model by applying grey numbers. Informatica, 20(2), 305–320.
- Zhai, L. Y., Khoo, L. P., & Zhong, Z. W. (2008). A rough set enhanced fuzzy approach to quality function deployment. The International Journal of Advanced Manufacturing Technology, 37(5–6), 613–624. doi:10.1007/s00170-007-0989-9
- Zhai, L. Y., Khoo, L. P., & Zhong, Z. W. (2009). Design concept evaluation in product development using rough sets and grey relation analysis. Expert Systems with Applications, 36(3), 7072–7079. doi:10.1016/j.eswa.2008.08.068
- Zhai, L. Y., Khoo, L. P., & Zhong, Z. W. (2010). Towards a QFD-based expert system: A novel extension to fuzzy QFD methodology using rough set theory. Expert Systems with Applications, 37(12), 8888–8896. doi:10.1016/j.eswa.2010.06.007
- Zheng, P., Xu, X., & Xie, S. Q. (2016). A weighted interval rough number based method to determine relative importance ratings of customer requirements in QFD product planning. Journal of Intelligent Manufacturing, 1, 14. doi:10.1007/s10845-016-1224-z
- Zhu, G. N., Hu, J., Qi, J., Gu, C. C., & Peng, Y. H. (2015). An integrated AHP and VIKOR for design concept evaluation based on rough number. Advanced Engineering Informatics, 29(3), 408–418. doi:10.1016/j.aei.2015.01.010
- Zolfani, S. H., Pourhossein, M., Yazdani, M., & Zavadskas, E. K. (2017). Evaluating construction projects of hotels based on environmental sustainability with MCDM framework. Alexandria Engineering Journal, 57(1), 357–365.