?Mathematical formulae have been encoded as MathML and are displayed in this HTML version using MathJax in order to improve their display. Uncheck the box to turn MathJax off. This feature requires Javascript. Click on a formula to zoom.
Abstract
This paper examines the financial cointegration and spillover effect of the global financial crisis to emerging Asian financial markets (India, China, Pakistan, Malaysia, Russia and Korea). The analysis used daily stock returns, divided into three time periods: pre-, during and post-crisis from 1 July 2005 to 30 June 2015. We applied the Johansen and Juselius cointegration test, the vector error correction model (V.E.C.M.) and the G.A.R.C.H.-B.E.K.K. model for an examination of integration and conditional volatility. We find long-term cointegration between the U.S. market and emerging stock markets, and the level of cointegration increased after the crisis period. The V.E.C.M. and impulse response function reveal that a shock in the U.S. financial market has a short-term impact on the returns of emerging financial markets. Past shocks and volatility have more effect on the selected stock markets during all time periods. The Korea Composite Stock Price Index and the Bombay stock exchange (B.S.E.) are the only stock markets that have cross-market news and volatility spillover effects during the crisis period. After the crisis period, news effects are positive on the B.S.E. and the Russian Trading System and have a negative effecton the Kuala Lumpur Stock Exchange and the Shanghai Stock Exchange.
1. Introduction
In the 1900s the financial liberalisation of capital inflow and the stock markets was followed by a boom in the number of cross-border transactions of currencies and securities. Later, with financial globalisation, the world has become a global village, where assets can be traded in any part of the world in no time and without restrictions. Such a high interdependence of economies has increased the effects when shocks in one economy spill over to the rest of the world. The global financial crisis of 2007–2009, which originated in the U.S. financial sector due to the fall of the U.S. real estate market, is the worst financial crisis after the great depression of the 1930s, and spread rapidly to almost all emerging and advanced economies (Claessens, Dell’Ariccia, Igan, & Laeven, Citation2010). It affected equity markets around the world, and many emerging economies observed a very sharp decline in their equity markets, greater than that of the U.S. stock market. This catastrophe also showed an extreme case of financial collapse that stretched to other European and emerging Asian economies, whereas Asian economies were somehow able to manage the negative effects of these financial shocks. The bankruptcy of Lehman Brothers in September 2008 initiated the global financial crisis, which quickly spread to other emerging economies (Dooley & Hutchison, Citation2009).
‘Spillover of shocks’ is a buzzword after the global financial crisis, so it is important to understand the meaning of spillover. In the field of finance, the terms spillover, contagion, co-movement and cointegration are commonly used interchangeably. Contagion has been defined in various ways by researchers in the field. The World Bank (Dornbusch, Park, & Claessens, Citation2000) defines contagion by classifying it in three levels. The first definition gives a broader view, and defines contagion as cross-countries transmission of the spillover effect or the transmission of cross-country shocks. This spillover can happen in both good and bad times, and is not only related to a crisis period. The second definition is restrictive in nature, which states that contagion is the co-movement of shocks. This is commonly explained by herding behaviour. The third definition is more restrictive, which states that contagion is greater during a ‘crisis time’ when there is an increase in the cross-countries correlations relative to correlations during a ‘tranquil time’, which is the transmission of the spillover effect during a post-crisis period. The contagion effect is defined as an increase in volatility spillover between two financial markets after a financial crisis (Forbes & Rigobon, Citation2002). Co-movements among financial markets indicate the presence of alike trends in the financial markets. Economic integration and stock market characteristics are the main factors explaining co-movement among financial markets (Pretorius, Citation2002). Co-movement and cointegration are synonymous terms, because they depict the existence of long-run trends among the financial markets, whereas a change in correlations among financial markets is defined as interconnectedness.
Emerging Asian economies have played a vital role in catering to the effects of financial crises. Over the years, the emerging Asian financial markets have proved to be the new drivers of change in the world. China and India have the capacity to transform the global economy in the twenty-first century (Engardio, Citation2007). The Bombay Stock Exchange (B.S.E.) is one of South Asia’s oldest and fastest growing stock exchanges. It is the world’s tenth largest stock market, with a market capitalisation at $1.68 trillion (March 2015) and over 5500 listed companies (World Federation of Exchanges and the B.S.E., Citation2016). Pakistan has always been a key market economically and strategically. In 2014 the K.S.E.-100 Index (a proxy of the Pakistani stock market) gained 6870 points from 25,261 to 32,131, generating a handsome return of 27 percent (31 percent return in US$ terms) for investors. Gross domestic product (G.D.P.) growth was recorded at 4.24 percent in the fiscal year 2014–2015 as compared to 4.03 percent last year (2013-14). During the financial turmoil of 2007-2009, the U.S. equity market lost about 40 percent of its market capitalisation. On the other hand, the Russian equity market loss was about 52 percent, which was much higher than that of the U.S. equity market. The U.S. financial sector, though, lost around 60 percent, but less than the Russian financial sector (Dungey & Gajurel, Citation2014). In the last decade (2000-2010), the Malaysian and Korean economies have been the best emerging economies in the Asian region due to an increase in liberalisation, trade openness, financial integration and tremendous development in the financial sector. This perhaps increased the chances of the Malaysian and Korean stocks markets having spillover effects generated by the global financial crisis.
The purpose of this study is to investigate the extreme events of the global financial crisis (2007–2009) and its spillover effects on a few Asian emerging economies. An extensive literature is available on the effect of the global financial crisis on stock markets, for example Arghyrou and Kontonikas (Citation2012), Baur (Citation2012), Beirne, Caporale, Schulze-Ghattas and Spagnolo (2010), Eichengreen, Mody, Nedeljkovic and Sarno (Citation2012), Guo, Chen and Huang (Citation2011), and Kenourgios and Padhi (Citation2012). Furthermore, in the literature more importance has been given to the developed economies, as in the studies by Huang, Yuang and Hu (2000), Kenourgios, Samitas and Paltalidis (2011) and Syllignakis and Kouretas (Citation2010, Citation2011). To achieve the objectives of this study, the sample consists of daily data from U.S. stock returns (as the crisis originated in the U.S. financial market) and the six large emerging economies from the Asian region, namely India, Pakistan, China, South Korea, Russia and Malaysia. Separate samples have been analysed for the pre-, during and post-crisis periods in order to identify the changing patterns in the cointegration and volatility spillover among the stock markets of six Asian markets and the U.S. market. This will provide a better understanding of the impact of the global financial crisis (G.F.C.) on the integration and interconnectedness of these Asian markets with the U.S. market. The reason for selecting these emerging economies is that these economies are totally cohesive with major financial markets of the world. There can be a strong chance of spillover effects of the global financial crisis on these Asian Economies. We are mainly concerned with the following questions: 1) Are the stock markets of selected Asian countries long-term cointegrated with the U.S. financial market? 2) Is there any financial spillover effect of the global financial crisis on the stock markets of emerging Asian countries? 3) What is the present cointegration level of these Asian stock markets? This study is novel in its kind due to its objectives and the selection of major Asian economies. To the best of our efforts we have not found any other study that has selected these emerging Asian economies, completely focusing on the above objectives.
These research questions provide significant information for portfolio managers, investors and policymakers. By knowing the extent of integration and vulnerability of the emerging Asian markets to financial shocks in the U.S. stock market, investors and portfolio managers can make sound decisions related to portfolio diversification. Policymakers in these Asian economies, by using the findings of this study, can focus their attention on developments in the U.S. financial markets while developing strategies to protect their markets from the negative effects of any future financial crisis.
The results of this study provide evidence of a significant spillover effect from the U.S. stock market (New York Stock Exchange, N.Y.S.E.) to emerging Asian stock markets during pre-crisis, crisis and post-crisis time periods. Using multivariate analysis, we have found that all of the statistical techniques like Johansen and Juselius, vector error correction, impulse response and the multivariate generalised autoregressive conditional heteroskedasticity-Babe, Engel, Kraft and Kroner (Citation1991) (G.A.R.C.H.-B.E.K.K.) model found a spillover effect from the N.Y.S.E. onto the emerging economies in all three time periods. Qiao, Qiao and Wong (Citation2010), Valls and Chuliá (Citation2012), and Worthington and Higgs (Citation2006) have also used these models to analyse the spillover effects for different stock exchanges. In this study, we have not only tested the spillover effects, but also checked the cointegration between the markets. Overall, the results of this study are consistent with previous studies on the spillover effect of the global financial crisis (Aloui, Aïssa, & Nguyen, 2011; Balli, Hajhoj, Basher, & Ghassan, 2015; Bekaert, Ehrmann, Fratzscher, & Mehl, 2014; Dooley & Hutchison, Citation2009; Dungey & Gajurel, Citation2014; Kim, Kim, & Lee, Citation2015; Lin, 2012; Syllignakis & Kouretas, Citation2010, Citation2011). The paper is organised as follows. The next section is a literature review of cointegration of stock markets and financial spillover effects; section 3 is about the data and methodology used for data analysis, section 4 contains the data source and sampling; the empirical results and discussion are summarised in section 5; and conclusions are presented in section 6.
2. Literature review
The increase in the level of cointegration and co-movement of different stocks and stock markets is not considered to be good for portfolio diversification as it is against the principles of portfolio theory presented by the great Nobel Laureate Harry Markowitz (Citation1952), later extended by Sharpe (Citation1963). The integrated stocks and stock markets move (up and down) together as happened in the Asian crisis (1997) and the U.S. financial crisis (2008), restricting the diversification benefits of portfolio making. The concept of international portfolio diversification was introduced by Solnik (Citation1974). He also extends the domestic capital asset pricing model into an international context, and suggests that the investor can get higher profit with lesser risk from international portfolios as compared to domestic portfolio. In an earlier period due to less cointegration, several researchers have empirically found weak correlations among the stock indexes of countries and their economies, i.e., Errunza (Citation1977), Grubel (Citation1968), Hilliard (Citation1979), Lessard (Citation1974, Citation1976), Levy and Sarnat (Citation1970), Panton, Lessig and Joy (Citation1976) and Ripley (Citation1973). This weak correlation provided a good environment for getting the benefits of international portfolio diversification.
Later, globalisation (due to capital market liberalisation) and free trade agreements transformed the developed and developing economies into a more integrated stature. The speedy transfer of information and capital led to decreased benefits of international diversification in the long run due to an increase in the level of cointegration. Furthermore, the events of the Asian crisis in the late 1990s and the global financial crisis in the early years of the twenty-first century provided extended evidence of integrated stock markets and their worst consequences for portfolio investments. The developing countries are now becoming more helpless in the face of uncertainties in international flows of funds than ever before (Stiglitz Citation2003). After the crises, researchers have been more cautious about the integration and co-movement of stock markets due to their spillover effects. This integration and its effects on global stock markets have been recognised by numerous researchers, i.e., Abad, Chuliá, & Gómez-Puig (Citation2010), Beirne et al. (Citation2010), Forbes and Rigobon (Citation2002), Huang et al. (Citation2000), Kizys and Pierdzioch (Citation2009), Liang, Chen and Yang (Citation2015), Lucey and Zhang (Citation2010), Masih and Masih (Citation1999) and Tuluca and Zwick (Citation2001).
In this regard, several comprehensive studies have been conducted to check this phenomenon. For example, a study by Huyghebaert and Wang (Citation2010) on seven major stock markets of Asia was conducted to find the integration and interdependencies among the stock markets before, during and after the 1997–1998 Asian financial crisis. The results revealed that the relationships among East Asian stock markets were time-varying while stock market interactions were limited before the Asian financial crisis started. Graham, Kiviaho and Nikkinen (2012) revealed in their comprehensive study a low degree of co-movement between the U.S. and the 22 individual emerging markets. and that the degree of stock market integration was changing over time. Lin (2012) revealed that the Asian emerging markets have strong co-movement between exchange rates and stock prices during crisis periods. Bae and Zhang (Citation2015), however, exposed that stock market integration was evident only in emerging countries in the financial crises of 1997 and 2008. Notably, the literature mentioned above reveals mixed results: some researchers have found that stock markets were integrated in the short run (in a specific period), and others argued that the co-movements among financial markets were only in the long run. Therefore, it is necessary to find evidence whether the selected emerging stock markets are cointegrated or not.
Accepting the importance of spillover effects on the financial markets, economists have not yet developed a consensus on the presence of spillover during the financial crisis. Literature is available documenting the effects of financial contagion on different regions of the world: see the seminal papers by Bekaert et al. (Citation2014), Chakrabarti and Roll (Citation2002), Dooley and Hutchison (Citation2009), Dungey and Gajurel (Citation2014), Kim et al. (Citation2015) and Syllignakis and Kouretas (Citation2010, Citation2011). Dooley and Hutchison (Citation2009) found that the financial and economic news originating from the U.S. had a statistically and economically large impact on the selected emerging markets. Moreover, news or events caused homogeneous movements between the stock markets. Syllignakis and Kouretas (Citation2010, Citation2011) provided evidence that the stock markets of the Central and Eastern European countries were partially integrated with the developed stock markets of the U.S. and Germany. Moreover, there were strong contagion effects among the U.S., German, Russian and Central and Eastern European (CEE) stock markets.
Dungey and Gajurel (Citation2014) provided strong evidence of contagion effects on both emerging as well as on advanced equity markets. For financial sector indices, however, the results are slightly different. Particularly in the case of advanced markets, there is a weak indication of contagion in the aggregate indices. Kim et al. (Citation2015) supported the findings of Eichengreen et al. (Citation2012) that financial contagion was triggered by the collapse of Lehman Brothers in September 2008. In addition, the findings suggested a dominant and significant role of foreign investment for the conditional correlations in international equity markets. The dollar London inter-bank offered rate-overnight indexed swap (Libor-O.I.S.) spread, the sovereign credit default swap (CDS) premium and foreign investment are found to be dynamic factors affecting foreign exchange markets. Bekaert et al. (Citation2014) recognised the small effect of contagion from the U.S. market to the global financial sector during the crisis, and it did not spread extensively across countries and sectors. Further, they found that the countries suffering from high unemployment, great political risk and a huge deficit in both the government budget and current account balance experienced a high magnitude of contagion. Lucey and Voronkova (Citation2008) found that in the long run the Russian equity market remained isolated from the influence of several developed international markets as well as the equity markets of Hungary, the Czech Republic and Poland, before and after the 1998 crisis. Morales and Andreosso-O’Callaghan (Citation2014), in their comprehensive study of 58 countries, documented that there are no significant contagion effects derived from the U.S. stock markets, either at world level and or at a regional level. Moreover, their results suggested that there was a spillover effect of the U.S. sub-prime crisis on selected markets rather than contagion to most of the countries. This effect was transmitted and spread to some main countries like Singapore and the U.K. Wang (Citation2014) discovered that East Asian stock markets were less sensitive to the shocks in the U.S. after the crisis.
The seminal examples of Brazil, Russia, India and China (B.R.I.C.)/Brazil, Russia, India, China and South Africa (B.R.I.C.S.) studies are Aloui et al. (Citation2011), Dimitriou, Kenourgios and Simos (Citation2013), Kenourgios et al. (Citation2011) and Syriopoulos, Makram and Boubaker (Citation2015). These studies presented mix results for the contagion effect during the global financial crisis. Aloui et al. (Citation2011) found evidence of strong co-movement between the B.R.I.C. markets and the U.S. market during the crisis period. The magnitude of contagion effects is more in the cases of Brazil and Russia (commodity prices-dependent economies) compared to emerging markets, like China and India (finished products export-oriented countries). Kenourgios et al. (Citation2011) confirmed the contagion effects of five different financial crises during 1997–2002 on B.R.I.C., U.S. and U.K. stock markets, while the emerging stock markets have greater financial contagion effects. Their study was, however, unlikely to cover the global financial crisis of 2008. A recent study by Syriopoulos et al. (Citation2015) on B.R.I.C.S. economies also confirmed the evidence for volatility and shock spillover between India, Russia, Brazil and the U.S. stock markets and business sectors during the 2008 financial crisis. The study by Dimitriou et al. (Citation2013) did not find any evidence of contagion effects of the U.S. financial crisis on B.R.I.C.S. economies till mid-2008, whereas the economies later re-emerged with the U.S. market in early 2009.
In the literature above, several researchers have recognised the contagion and spillover effects of the global financial crisis on stock markets around the world. These studies are, however, mostly based on developed stock markets, and very little importance and response has been given to emerging markets. For example, Wang (Citation2014) has selected six East Asian developed markets (China, Hong Kong, Taiwan, Singapore, South Korea and Japan) for a cointegration check. These markets are already well integrated with the rest of the world. Therefore, there is a chance of strong contagion effects among these economies. Syllignakis and Kouretas (Citation2010, Citation2011) has only focused on Central and Eastern European countries, while Kim et al. (Citation2015) have examined five emerging economies (Indonesia, Korea, Philippine, Thailand and Taiwan) that were badly affected in the 1997 Asian crisis. Kenourgios and Padhi (Citation2012) selected emerging market economies from various regions (Latin America, Asia, Europe, the Middle East and Africa) to check the spillover effects of the crisis. Moreover, the studies that mainly concentrated on B.R.I.C.S. economies have overlooked the importance of other emerging economies, specifically the countries that were selected for this study (i.e., Malaysia, South Korea and Pakistan). Furthermore, numerous studies have focused only on pre-crisis and crisis time periods (e.g., Chakrabarti and Roll, Citation2002 and Morales & Andreosso-O’Callaghan, Citation2014). The spillover effect has not, however, been measured after the financial crisis period, to check whether the emerging stock markets adjust to normal conditions or not. The focus of this study is to find long-term cointegration of emerging stock markets with the U.S. stock market, and the spillover effects of the global financial crisis on emerging Asian markets. The novel feature of this research is that it concentrates on the reactions of the stock markets of emerging Asian economies before, during and after the global financial crisis. This study makes an ample contribution to the existing literature on the spillover effects of financial crises.
3. Methodology
In this study we are mainly concerned with the following three questions in pre-, during and post-global financial crisis time periods. 1) Are the stock markets of selected countries long-term cointegrated with the U.S. financial market? 2) Is there any financial spillover effect on the stock markets of emerging Asian markets? 3) What is the present cointegration level of these stock markets?
The Johansen and Juselius cointegration test is applied to investigate the first research question by testing the following hypotheses:
Hypothesis 1.1: There exists long-run cointegration among the emerging Asian stock markets and the U.S. stock market before the G.F.C.;
Hypothesis 2.1: There exists long-run cointegration among the emerging Asian stock markets and the U.S. stock market during the G.F.C.
The multivariate G.A.R.C.H. (M.G.A.R.C.H.)-B.E.K.K. model is used to test the following hypothesis for the second research question of the study:
Hypothesis 3.1: There exists volatility among the emerging Asian stock markets and the U.S. stock market before the G.F.C.;
Hypothesis 4.1: There exists volatility among the emerging Asian stock markets and the U.S. stock market during the G.F.C.
The third research question is answered by applying both Johansen and Juselius cointegration and the M.G.A.R.C.H.-B.E.K.K. model to the post-crisis sample to test the following two hypotheses:
Hypothesis 5.1: There exists long-run cointegration among the emerging Asian stock markets and the U.S. stock market after the G.F.C.;
Hypothesis 6.1: There exists volatility among the emerging Asian stock markets and the U.S. stock market post-G.F.C.
The main motivation for selecting the cointegration framework is that the stock series that are estimated to hold a long-run relationship must be stationary at their first difference or non-stationary at level. It is the requirement of the classic regression model that all the selected variables (dependent and independent) must be stationary. Moreover, the errors have a finite variance and zero mean. Granger and Newbold (Citation1977) documented that if a series is non-stationary, then all of the typical regression outcomes might be spurious. In order to avoid the problem of spurious regression, first of all we have to analyse the time series properties of the selected variables. This could be observed by applying the augmented Dickey-Fuller (A.D.F.) test (Dickey & Fuller, Citation1979, Citation1981). The A.D.F. model is employed to check the unit root as follows:
There are two types of tests that are mostly used for cointegration. One was proposed by Engle and Granger (E.G.) (Engle & Granger, Citation1987), and the other was proposed by Johansen and Juselius (Citation1990). The later one is considered to be superior from the E.G. test, as it provides the most consistent and accurate results of cointegration. Since it corrects some of the shortcomings of the E.G. test, mainly due to being a two-step test in which the errors in the first step are carried over to the second step, we can apply restrictions to the cointegrating vectors, and are less concerned about the exogeny of the explanatory variables (Gulzar, Feng & Yajie, Citation2007). Actually, the test proposed by Johansen and Juselius (Citation1990) for cointegration is based on the maximum likelihood estimators of a vector auto regressive process, and the two different likelihood ratio tests that test the pre-established correlations between the selected variables. The trace and maximum eigenvalue statistics are two different likelihood ratio tests that are computed as follows:
where represents the trace statistic,
is the maximum eigenvalue statistic,
is the sample size, and
and
symbolise the estimated eigenvalue of the specific roots found from the matrix. The null hypothesis of r cointegrating vectors against n cointegrating vectors is determined through trace statistics, while the null hypothesis of r cointegrating vectors against the alternative hypothesis of r + 1 cointegrating vectors is measured through maximum eigenvalue statistics (Gupta and Guidi, Citation2012; Yoon and Kang, Citation2011).
To analyse the impact of the global financial crisis on the stock markets of selected economies, the vector auto-regression (V.A.R.) model has been selected. The V.A.R. model measures causality among the stock returns. All variables in a V.A.R. model are taken as endogenous variables, whereas the V.A.R. model is a multi-equation system. So, there is one equation for each dependent variable, and each equation has lagged values for all the included variables as independent variables. Huang and Feng (Citation2007) and Zalduendo (Citation2006) have carried out similar analyses using V.A.R. in their studies. If cointegration does not exist, then we have applied a V.A.R. model. In contrast, it could also be modelled through the vector error correction model (V.E.C.M.) if cointegration exists between yt and xt.
While calculating the V.A.R. model we are generally interested in investigating the impulse response function. This tells us the integration level of selected stock markets. An exogenous shock that directly affects a stock market is not only affecting that single stock market, but is also transmitted to other stock markets. An impulse response function measures the effects of a one-unit exogenous shock to the change of the increase or decrease in the current and future value of the other stock markets. If there is a response of one stock market to an impulse on another stock market than the first stock market has causality with other stock markets. Several authors followed Sim’s (Sim, 1980) study of a V.A.R. model that was carried out using ‘orthogonalised’ impulse responses. In this method, the error variance decompositions were computed before the computation of a impulse response forecast. Koop, Pesaran and Potter (Citation1996) proposed impulse response for the analysis of nonlinear multivariate models. Both techniques, however, required orthogonalisation of the shocks. Later, Pesaran and Shin (Citation1998) extended the work of Koop et al. (Citation1996) and suggested a generalised impulse response analysis for unrestricted V.A.R. and cointegrated V.A.R. models. This technique does not carry any of the shortcoming of the models proposed by Sims (Citation1980) and Koop et al. (Citation1996). In this paper, for the analysis of current market conditions, we have applied the impulse response function proposed by Pesaran and Shin (Citation1998). This will satisfy our third question regarding the present cointegration level of these stock markets.
To deal with the second issue, the researchers divided the sample period into two parts (pre- and post-crisis period) and used an unconditional cross-market correlation coefficients approach. If there is a significant increase in the correlation coefficients during crisis, then it suggests that there is a contagion effect. This type of approach has also been used by Arshanapalli and Doukas (Citation1993), King and Wadhwani (Citation1990), Le (Citation1991), Lee and Kim (Citation1993) and Malliaris and Urrutia (Citation1992) for the U.S. market crash in 1987; and Calvo and Reinhart (Citation1996) for the 1994 Mexican peso crisis. Forbes and Rigobon (Citation2002) argued that these tests might suffer from the problem of heteroskedasticity (bias) because they were based on comparisons of sub-sample correlation coefficients. Moreover, many other researchers also used the G.A.R.C.H. family test to identify the crisis effect (e.g., Bekaert and Harvey, Citation2003 and Hamao, Masulis, & Ng, Citation1990). Forbes and Rigobon (Citation2002) further pointed out that the autoregressive conditional heteroskedasticity (A.R.C.H.) and G.A.R.C.H. frameworks were used for analysing market co-movements, and that the results showed the variance and covariance transmission mechanisms between economies. The researchers were much interested in the permanent change in the unconditional variance rather than the conditional one. This issue has been solved by the dynamic conditional correlation (D.C.C.) M.G.A.R.C.H. model.
Several researchers have recently used the D.C.C. M.G.A.R.C.H. model developed by Engle (Citation2002). This approach was used by Cappiello, Engle and Sheppard (Citation2006), Chiang, Jeon and Li (Citation2007), Dimitriou and Kenourgios (Citation2013), Dimitriou et al. (Citation2013) and Syllignakis and Kouretas (Citation2011). This is a multivariate model for estimating time-varying conditional correlations, and it does not require knowledge of the specific date when the contagion occurs. Engle further claims that this test performs better in different situations and provides utilitarian results. In this paper, the bivariate G.A.R.C.H. model is used for the computation of cross-terms and financial spillover among the U.S. and emerging stock markets. This model has the potential to incorporate a quadratic form in such a manner that it produces a positive semi-definite covariance matrix, which guarantees non-negative estimated variance. Further details are discussed by Fang, Lin and Lee (Citation2007), Kearney and Patton (Citation2000), Kim et al. (Citation2015) and Malik and Hammoudeh (Citation2007).
The standard B.E.K.K. parameterisation proposed by Engle and Kroner (Citation1995) for a bivariate G.A.R.C.H. (1,1) model is written as
where the individual C, A and B matrices are written as
A is a 2 × 2 square matrix of parameters that shows how the conditional variances are correlated with the past squared errors whose elements capture the effect of shocks on conditional variance (volatility). B is also a square matrix of parameters that shows how past conditional variance affects the present conditional variance. C is a 2 × 2 parametric lower triangular matrix.
In these equations the parameters estimate how shocks and volatility are transmitted across markets over a period of time, while the parameters
present past shocks and past volatility effects (A.R.C.H. and G.A.R.C.H. effects). We maximised the Likelihood function assuming that errors are normally distributed, and it is expressed as:
where θ is the estimated parameter and T is the number of observations.
4. Data source and sampling
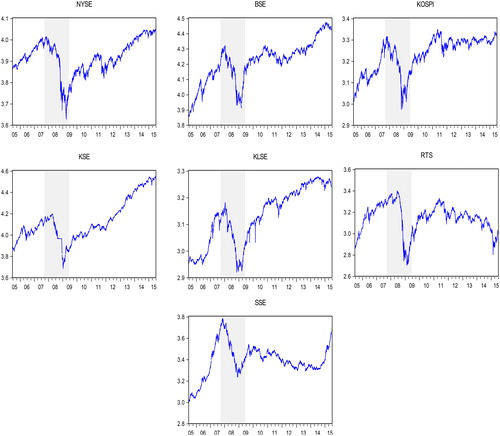
To achieve the objectives of the study, the daily data of stock indexes for the U.S. (N.Y.S.E.) (https://www.nyse.com/index), Malaysia (Kuala Lumpur Stock Exchange, K.L.S.E.) (http://www.bursamalaysia.com/market/), Korea (Korea Composite Stock Price Index, K.O.S.P.I.) (http://global.krx.co.kr/main/main.jsp), Russia (Russian Trading System, R.T.S.) (https://www.moex.com/en/), India (B.S.E.) (https://www.bseindia.com/), China (Shanghai Stock Exchange, S.S.E.) (http://english.sse.com.cn/) and Pakistan (Karachi Stock Exchange, K.S.E.) (https://www.psx.com.pk/) have been taken from the official websites. The data has been taken for the time period 1 July 2005 to 30 June 2015. The time period has been divided into three parts: pre-financial crisis, during the financial crisis and post-financial crisis periods. The trading days in all stock markets are not the same due to varying public holidays across different economies. To deal with the non-synchronised trading days problem, the returns on these days are considered to be zero, because a zero return on these days reflects the actual returns on non-trading days (Yarovaya, Bezeszcyński & Lau, Citation2016). The pre-crisis period consists of 1 July 2005 to 30 July 2007. In August 2007, the crisis began when Lehman Brothers closed its subprime lender (BNC Mortgage). It induced this New York investment bank to cut 1200 positions in 23 different locations. This ultimately effected a $27 million goodwill reduction, and it took a $25 million after-tax charge. Finally, in September 2008, Lehman Brothers declared bankruptcy, which quickly resulted in a sharp decline in stock market indices across the globe. Therefore, the financial crisis period starts 1 August 2007 and ends 29 May 2009, because after this time the stock markets became stable (Dungey and Gajurel Citation2014). The post-financial crisis time-period is from June 2009 to 30 June 2015. presents the division of time periods and the conditions of selected stock markets before, during and after the global financial crisis. In the pre-crisis period, each stock market shows a smooth movement, while during the crisis period the movements of each stock index are volatile and show a declining trend. After the crisis period, however, the stock markets revert to smooth movements. For data analysis E-VIEWS (IHS Global Inc. CA, USA) and RATSPro software (Estima1560 Sherman Ave, IL, USA) were used.
Figure 1. Conditions of stock markets before, during and after the global financial crisis
5. Empirical results and discussion
5.1. Descriptive statistics
The results for the descriptive statistics are summarised in . The results reveal that during the pre-crisis period the S.S.E. shows the highest mean return followed by the R.T.S. and the B.S.E. Interestingly, these markets also have the lowest mean return values and highest standard deviations, which indicates that these stock markets are more volatile than other emerging markets during the pre-crisis period. During the crisis period, the mean returns of all stock markets are negative except for the B.S.E., while the S.S.E., K.L.S.E. and K.O.S.P.I. show the lowest mean returns. It has also been observed that the standard deviations of all stocks during this period doubled or increased even more as compared to the pre-crisis period. In the post-crisis period, however, the mean returns normalised and standard deviation figures reverted to the level of the pre-crisis period. The results also indicate that the return series for all markets during all the time periods are negatively skewed. Moreover, the excess values of kurtosis signify that the series are leptokurtic. The results of the Jarque–Bera normality test are significant at 1%, which means that the return series are not normally distributed. The Jarque–Bera normality test further supported the results for skewness and kurtosis.
Table 1. Descriptive statistics for stock index return series.
5.2. Augmented Dickey–Fuller test
The stock indexes of the selected emerging markets are not based on similar values. Therefore, the logs of all stocks series are taken before running the A.D.F. unit root test. The results of the A.D.F. unit root test at level and at first difference are presented in . The null hypothesis of the unit root has been rejected at a 1% significance level for all of the series. The results indicate that the log price series (N.Y.S.E., B.S.E., K.O.S.P.I., K.S.E., K.L.S.E., R.T.S. and S.S.E.) are non-stationary at level and stationary at first difference for all of the samples.
Table 2. Augmented Dickey-Fuller unit root test.
5.3. Johansen and Juselius cointegration
The results of the Johansen and Juselius cointegration test are presented in . The first column contains the name of the specific tests (Trace and Max-eigenvalue). The second column in the table demonstrates H0, with r = 0, r ≤ 1, r ≤ 2, r ≤ 3, r ≤ 4, r ≤ 5 and r ≤ 6, which indicate at most none, at most 1, at most 2, at most 3, most 4, most 5 and at most 6 cointegration relationships, respectively. The third, fourth and fifth columns present the Trace and Max-eigenvalue statistics for pre-crisis, during crisis and post-crisis time periods, respectively. In the pre-crisis time period, the Trace statistics test indicates two cointegrating equations at 5% critical level, and the Max-eigenvalue test indicates one cointegrating equation at the 5% critical level. These statistics reveal that two null hypotheses are rejected. It means that there are two cointegrating equations r = 2 among the six stock markets at a 5% significance level. Therefore, this supports our assumption that there exists a long-run relationship between the N.Y.S.E. and the B.S.E., K.O.S.P.I., K.S.E., K.L.S.E., R.T.S. and S.S.E. during the pre-crisis time period.
Table 3. Results of the Johansen and Juselius cointegration test.
In the crisis period there are two cointegration equations of both the Trace statistic and Max-eigenvalue, which present similar levels of cointegrations as before the crisis period. In the post-crisis time period, however, the number of long-term cointegrating equations has increased. The Trace statistic test indicates four cointegrating equations at 5% critical level, and the Max-eigenvalue test indicates three cointegrating equations at 5% critical level. This means that after the crisis period the stock markets are highly cointegrated with the N.Y.S.E. as compared to the pre-crisis and crisis periods. In all of the sample periods, we find long-run cointegrations among the emerging stock markets and the N.Y.S.E. Therefore we now move to the V.E.C.M. model.
5.4. Vector error correction model and impulse response
The results for the V.E.C.M. revealed that during the pre-crisis and crisis time periods, there are long-run causalities among the N.Y.S.E. and the selected emerging stock markets, while the post-crisis time period shows short-run interconnections. The results of this study are in agreement with the claim of importance for the third variable in a bivariate V.A.R. as described by Phylaktis and Ravazzolo (Citation2005). The results do not show a causal relationship between Pakistan’s stock returns and the U.S. stock returns in the short run, but the cointegration vector for the bivariate system is statistically significant. The results based on both the Trace test and the Max-eigenvalue test support long-run relationships between the variables, which is an indication of cointegration among the variables. The results of Deng and Yang (Citation2008); and Qi and Boping (2009) also support our results for long-term cointegration.
During the crisis period the results of the Trace test and the Max-eigenvalue test show that there are cointegrating vectors for each economy, and during and after the crisis period we find at most one cointegrating equation as a result of the Johansen and Juselius (Citation1990) cointegration test. The results in show that ECMt-1 (Error Correction Model in the root line) is significant, indicating a long-run equilibrium relationship between all economies. During the crisis period, the results for ECMt-1 for emerging market economies are found to be significant, which shows equilibrium in long-run relationships for all economies. In the case of the Malaysian stock market, if there is an error in equilibrium in the short run then 3.5% of the error is corrected by global stock returns (N.Y.S.E.), 7.8% of the error is corrected by Indian stock returns and 6.3% by Korean stock returns. The results also show that there is inertia in Indian, Korean and Malaysian stock returns. Moreover, it is found that, in the short run, global stock returns (N.Y.S.E.) does affect the B.S.E. and K.S.E. at first lag and K.L.S.E. (both at first and second lags) before the crisis period and during the financial crisis then global stock returns (N.Y.S.E.) only affect the K.O.S.P.I. at first but on the second lag it affects B.S.E. and R.T.S. returns, whereas 1.9% of the error can be corrected by the K.O.S.P.I. returns during the financial crisis period. The results for the Chinese economy represent that 4% of the error is rectified by the ECMt-1 compared to 9% before the crisis, whereas in the short run the global stock exchange does affect the domestic stock returns of all the stock exchanges after the crisis period except the K.O.S.P.I. as compared to during the crisis period, where it has a significant impact only on the K.O.S.P.I. The global stock returns do affect the B.S.E. and R.T.S. on the second lag in the short term during the crisis period. (For details see Appendix A).
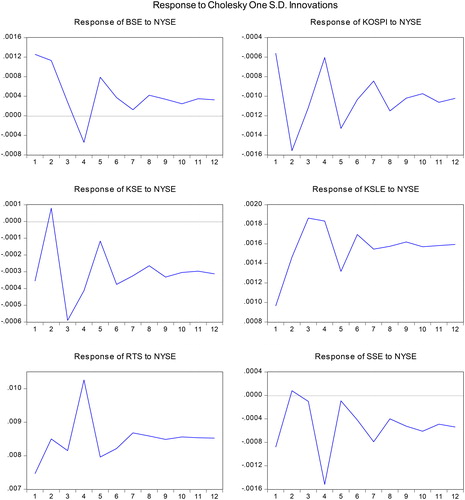
From Figures 1–3 in Appendix B, we can see that the responses of all south Asian emerging economies towards the shock of the N.Y.S.E. are negative, except for K.L.S.E. and R.T.S., which is due to less cross-portfolio investment between the U.S. stock returns and Russian stock returns. Moreover, it is only the R.T.S. stock returns that become stable at lag-5 after the shock from the N.Y.S.E.; the rest of the stock returns do take more time to revert to mean values. From the impulse response graph, we can easily infer that a positive shock in the returns for the N.Y.S.E. bring a change in the returns of other South Asian Emerging economies. In addition, the S.S.E., K.L.S.E. and K.O.S.P.I. were the stocks that did not show negative returns in response to the shock. During the financial crisis period, one standard deviation shock in the N.Y.S.E. brings a negative response in all economies except on the Indian stock market. At the third lag all economies respond positively to the shock, but Indian returns declined. Moreover, the responses of these emerging economies normalised at lag-10. So, we can say that a standard deviation shock in the N.Y.S.E. can bring volatility in the returns of the emerging markets up to lag-10. The emerging markets have adopted precautionary measures to stabilise and avoid the impact of the financial crisis, but from the graphs we can see that these economies are affected in either way. The results for impulse response after the financial crisis are similar to the results for before the financial crisis period, and we can see that all economies respond positively to a standard deviation shock of the N.Y.S.E. In the period after the financial crisis we see that all of the economies are on the negative side except for the R.T.S. and K.O.S.P.I. This is quite similar to the results for before the financial crisis period, when all economies were on the positive side except for the R.T.S. and K.O.S.P.I.
5.5 G.A.R.C.H.-B.E.K.K.
presents the estimated results for the bivariate G.A.R.C.H.-B.E.K.K. model during the pre-crisis time period. In the bivariate G.A.R.C.H.-B.E.K.K. (1,1) model the important coefficients are A(1,1), A(2,2), B(1,1) and B(2,2). The diagonal elements in matrices A(1,1) and A(2,2) present A.R.C.H. effects (their own past shock effects), while the diagonal elements in matrices B(1,1) and B(2,2) capture G.A.R.C.H. effects (their own past volatility effects). It can be observed in that most of the estimated diagonal parameters are highly significant, representing the existence of strong A.R.C.H. and G.A.R.C.H. effects in the entire selected scenario. This means that in the pre-crisis time period the conditional variances of all series are affected by their own past shocks and past volatility.
Table 4. G.A.R.C.H.-B.E.K.K. results for the pre-crisis period.
The shock spillover and volatility spillover between two markets could be observed from the off-diagonal elements of matrices A and B. The off-diagonal elements in matrices A(1,2) and A(2,1) represent cross-market news effects, while the off-diagonal elements in matrices B(1,2) and B(2,1) capture volatility spillover effects. For the B.S.E., K.S.E., K.L.S.E. and S.S.E. stock markets the off-diagonal diagnostic coefficients A(1,2) and A(2,1) are significant, representing shock spillover directions between two stock markets. The off-diagonal diagnostics for the S.S.E. indicate the bi-directional spillover effect. The shocks in the N.Y.S.E. affect the present volatility of the S.S.E., and vice versa. The tendency for S.S.E. shocks to the N.Y.S.E., however, is 0.09% greater compared with N.Y.S.E. to the S.S.E. In the cases of the B.S.E., K.S.E. and K.L.S.E., there are one-sided reverse shock effects. This means that before the crisis period these markets had no cross-market news effects from the N.Y.S.E. The other two stock markets (K.O.S.P.I. and R.T.S.) are not, however, affected by cross-market news effects during this time period. Moreover, the results for the off-diagonal elements in matrices B(1,2) and B(2,1) are significant, indicating volatility spillover between two stock markets. The B.S.E., R.T.S. and S.S.E. have bi-directional volatility spillover effects, meaning that the markets are affecting each other. The tendency for N.Y.S.E. shocks is, however, greater for the B.S.E. and R.T.S. compared to vice versa. The K.S.E. and K.L.S.E. have no volatility spillover effects, and K.O.S.P.I. has one-sided volatility spillover effects. Furthermore, the results show both negative and positive volatility spillover from the N.Y.S.E. to emerging markets during the pre-crisis time period.
The estimated results for the bivariate G.A.R.C.H.-B.E.K.K. (1,1) model during the period of the crisis are presented in . During the period of the crisis there is a strong A.R.C.H. effect in all of the stock markets. As the diagonal elements in matrices A(1,1) and A(2,2) are significant at the 1% critical value. This means that stock markets are affected by their own past shock effects. The results also reveal that most of the estimated diagonal parameters B(1,1) and B(2,2) are highly significant, representing the existence of strong G.A.R.C.H. effects in all stock markets except for the B.S.E. It means that during the period of crisis the conditional variances for all series are affected by their own past shocks and past volatility.
Table 5. G.A.R.C.H.-B.E.K.K. results for the crisis period.
During the crisis time period, the shock spillover and volatility spillover between the N.Y.S.E. and other stock markets present a different picture than that of the pre-crisis time period. Only the K.O.S.P.I. and R.T.S. off-diagonal coefficients A(1,2) and A(2,1) are significant during this period. There are bi-directional spillover effects in the case of the K.O.S.P.I., and the R.T.S. is affected by one-sided shock spillover. The results present normal pictures of spillover effects, which are the negative cross-market news effects from the N.Y.S.E. to K.O.S.P.I., and the positive cross-market news effects from K.O.S.P.I. to the N.Y.S.E. The results here for the K.O.S.P.I. are similar to our findings from the V.E.C.M. Other stock markets, however, have no cross-market news effects during the crisis time period. Moreover, the results for off-diagonal elements B(1,2) and B(2,1) indicate volatility spillover between the N.Y.S.E. and other stock markets: except for the K.S.E., all stock markets have volatility spillover effects. The results, however, present negative volatility spillover from the N.Y.S.E. to the B.S.E. and reverse negative volatility spillover from the K.L.S.E., K.O.S.P.I., R.T.S. and S.S.E. to the N.Y.S.E. The results reveal that the B.S.E. is the only stock market that has a volatility spillover effect (−0.0151) from the N.Y.S.E. during the crisis period.
The strong A.R.C.H. and G.A.R.C.H. effects during the post-crisis time period can be observed from . The high significance values of the diagonal elements in matrices A(1,1), A(2,2), B(1,1) and B(2,2) present strong own past shock and own past volatility effects in the emerging markets. In , the off-diagonal elements of matrices A and B present significant results for shock spillover and volatility spillover as compared with the pre-crisis and crisis time periods. The results reveal that there are bi-directional cross-market news effects in the cases of the B.S.E., R.T.S. and K.L.S.E., whereas the K.S.E., K.O.S.P.I. and S.S.E. have one-sided cross-market news effects. Moreover, the results show that cross-market news from the N.Y.S.E. has a positive spillover effect on the B.S.E. and R.T.S., and a negative effect on the K.L.S.E. and S.S.E. The estimated results of volatility spillover are also significant, showing that the B.S.E. and R.T.S. have negative volatility spillover effects from the N.Y.S.E., and K.L.S.E. has a positive effect. The S.S.E. did not, however, have volatility spillover effects. Moreover, the B.S.E., K.S.E., K.O.S.P.I. and R.T.S. have one-sided volatility spillover, whereas the K.L.S.E. has bi-directional volatility spillover.
Table 6. G.A.R.C.H.-B.E.K.K. results for the post-crisis period.
In this paper, we applied different techniques: the Johansen and Juselius cointegration test, V.E.C.M., impulse response and the G.A.R.C.H.-B.E.K.K. model. All approaches provide similar results. The Johansen and Juselius cointegration test shows long-run cointegration of emerging stock markets with the U.S. stock market, which supports previous studies (Bae and Zhang, Citation2015; Huyghebaert and Wang, Citation2010; Masih and Masih, Citation1999). We find, however, that the cointegration level does not remain the same in different circumstances, which supports the findings of Graham et al. (Citation2012). Moreover, we find that the number of cointegration equations increased after the crisis time period, which is similar to the findings of Yang et al. (Citation2003) and Dooley and Hutchison (Citation2009) for emerging stock markets. The V.E.C.M. and the impulse response function reveal that the emerging markets stock returns have a short-term shock effect from the U.S. financial market (N.Y.S.E.), supporting the study by Kayani, Xiaofeng and Gulzar (Citation2013). We also find that the stock markets have their own past shock effects and own past volatility effects (A.R.C.H. and G.A.R.C.H. effects) during all time periods.
From the results for the G.A.R.C.H. B.E.K.K. model, the K.O.S.P.I. is the only stock market that has cross-market news effects from the N.Y.S.E. during the crisis period, and there are volatility spillover effects from the N.Y.S.E. to the B.S.E. The K.S.E. is the only stock market that has no cross-market news and volatility spillover effects during the crisis time period. The reason is that capital inflow in Pakistan is mostly dependent upon the International Monetary fund (I.M.F.) for loans and aid, Eurobonds, financial grants, etc., due to the limited operation of international banks in the domestic market, and a lack of foreign portfolio and greenfield investments. These economic conditions have isolated it from the rest of the world. These results are partially contradicted by Kayani, Xiaofeng and Gulzar (Citation2014) and Balli et al. (Citation2015), as they found a strong spillover effect from the global financial crisis on Pakistan. The findings of Dungey and Gajurel (Citation2014) support this study, showing that the emerging stock markets have not been much affected by the global financial crisis. From the results for the G.A.R.C.H.-B.E.K.K. model we find that there are only two stock markets, the K.O.S.P.I. and the B.S.E., that are affected by shock spillover and volatility spillover from the N.Y.S.E. during the crisis period.
The results reveal that the B.S.E. has a direct negative volatility spillover effect during entire time periods (pre-, during and post-crisis); the magnitude of the spillover effect has, however, seen a declining trend, which also shows the process of lower interdependence between the Indian stock market and the U.S. stock market. In a post-crisis period it also has a positive cross-market news effect from the U.S. market. These results are consistent with the findings of Aloui et al. (Citation2011), who found that India had contagion effects from the U.S. stock market during the crisis, contradicting Gupta and Guidi (Citation2012), who found that the Indian stock market had weak interdependence with other developed Asian markets and the U.S. stock market. We also find that the K.L.S.E. is not affected by the shock and volatility spillovers during the pre-crisis and crisis time periods. The situation of the K.L.S.E. has, however, changed in the post-crisis period: it has negative cross-market news and positive volatility spillover effects from the N.Y.S.E. This means that after the crisis period its connection with the U.S. financial market has increased. Furthermore, the R.T.S. also has no direct spillover effect during the crisis so it only shows reverse shock spillover and reverse volatility spillover effects. Then, after the crisis period, it has positive cross-market news and negative volatility spillover effects from the N.Y.S.E. Additionally, there are positive shock spillover and volatility spillover effects in the pre-crisis time period and negative cross-market news effects after the crisis period from the N.Y.S.E. to the S.S.E. During the crisis, due to strong government intervention and control on the S.S.E., the market was safe from both shocks.
Overall, we find significant cross-market news and volatility spillover effects from the N.Y.S.E. to emerging Asian economies during different time periods. The results of this study are supported by several previous studies; Dungey, Fry, González-Hermosillo and Martin (Citation2010) also found the symptom of contagion to Russia. These results are also supported by Balli et al. (Citation2015), although they have ignored Russia and China but found evidence of spillover on Malaysia and India. The result for the B.S.E., R.T.S. and S.S.E. are also supported by Dungey and Gajurel (Citation2014), though their work was only limited to the B.R.I.C. economies.
6. Conclusions
This study investigates the financial cointegration and spillover effects of the global financial crisis upon the stock markets of Asian emerging economies. The results of our analysis depict that there is a significant spillover effect from the U.S. stock market (N.Y.S.E.) upon the stock markets of emerging economies (S.S.E., B.S.E., K.L.S.E., R.T.S., K.O.S.P.I. and K.S.E.) Using multivariate analysis, we have seen that all of our techniques like Johansen and Juselius, V.E.C.M., impulse response and bivariate G.A.R.C.H.-B.E.K.K. presented the same results and have shown the presence of spillover effects from the N.Y.S.E. on the emerging economies in all three cases, i.e., before, during and after the financial crisis.
The Johansen and Juselius cointegration test showed significant long-run cointegration of emerging stock markets with the N.Y.S.E. in pre-, during and post-crisis time periods. Moreover, we find that the number of cointegration equations increased after the crisis time period. Due to the presence of cointegration, we have adopted the V.E.C.M. methodology. We have seen a short-term correlation between the N.Y.S.E. and most of the emerging economies examined. Moreover, to check the responses of these emerging economies, we have used the impulse response function in all three scenarios. The results have found significant evidence for the presence of spillover effects. The study concludes that the returns of the emerging stock markets are affected by volatility in the U.S. stock market.
From the results for the G.A.R.C.H.-B.E.K.K. model we found significant A.R.C.H. and G.A.R.C.H. effects in all of the selected stock markets during all specified time periods. The shock spillover and volatility spillover effects are also significant for different stocks markets in different time periods. In the pre-crisis time period, the S.S.E. has cross-market news effects, and the B.S.E., R.T.S. and S.S.E. have volatility spillover effects. Moreover, during the crisis the K.O.S.P.I. has a negative cross-market news effect, and a negative volatility spillover effect originates from the N.Y.S.E. to the B.S.E. Furthermore, we find that, in the post-crisis period, emerging stock markets are more affected by shocks originating from the N.Y.S.E. There are significant positive cross-market news effects from the N.Y.S.E. to the B.S.E. and R.T.S., and negative effects on the K.L.S.E. and S.S.E., while the volatility spillover effects are negative on the B.S.E. and R.T.S., and positive on the K.L.S.E. During the whole sampling period, we find that the K.S.E. is the only stock market that is not affected by any shock. Overall, in all of the selected time periods (pre-crisis, during the crisis and post-crisis) there are significant shock spillover and volatility spillover effects of the global financial crisis from the N.Y.S.E. to different emerging Asians stock markets (S.S.E., B.S.E., K.L.S.E., R.T.S., K.O.S.P.I. and K.S.E.)
The findings of this study have indispensable implications for both risk managers and portfolio investors. An understanding of the cointegration level of major stock markets with the U.S. can help portfolio managers to reduce risk and increase diversification benefits. Extra importance (weight) can be given to those economies that are less cointegrated with the developed stock markets. The stock markets that have no spillover effects could be a better option for portfolio investments, and this will help to reduce risk. Despite wholehearted efforts there exist some limitations in the study that need to be considered in future research. This study has only focused on the evaluation of the impact of the global financial crisis on the cointegration and volatility spillover effects between six emerging Asian economies and the U.S., whereas a comprehensive study can be carried out in the future to identify the transmission channels of how the crisis spread to these economies, and what role did the fundamentals of each economy play in preventing or transmitting the crisis. Moreover, this paper also provides a clue for further research in the area of cointegration and contagion. As the selected stock markets belong to the same region and are situated very close to each other, cross-market spillover effects of these economies can also be studied in the future. It will definitely provide a better and clearer picture for portfolio managers.
Disclosure statement
No potential conflict of interest was reported by the authors.
Additional information
Funding
References
- Abad, P., Chuliá, H., & Gómez-Puig, M. (2010). EMU and European government bond market integration. Journal of Banking & Finance, 34(12), 2851–2860. doi: 10.1016/j.jbankfin.2009.10.009
- Aloui, R., Aïssa, M. S. B., & Nguyen, D. K. (2011). Global financial crisis, extreme interdependences, and contagion effects: The role of economic structure? Journal of Banking & Finance, 35(1), 130–141. doi: 10.1016/j.jbankfin.2010.07.021
- Arghyrou, M. G., & Kontonikas, A. (2012). The EMU sovereign-debt crisis: Fundamentals, expectations and contagion. Journal of International Financial Markets, Institutions and Money, 22(4), 658–677. doi: 10.1016/j.intfin.2012.03.003
- Arshanapalli, B., & Doukas, J. (1993). International stock market linkages: Evidence from the pre- and post-October 1987 period. Journal of Banking & Finance, 17(1), 193–208. doi: 10.1016/0378-4266(93)90088-U
- Babe, Y., Engle, R. F., Kraft, D. F., & Kroner, K. F. (1991). Multivariate Simultaneous Generalized Anon (Discussion Paper). San Diego: University of California, Department of Economics, (89–57), 4.
- Bae, K. H., & Zhang, X. (2015). The cost of stock market integration in emerging markets. Asia-Pacific Journal of Financial Studies, 44(1), 1–23. doi: 10.1111/ajfs.12079
- Balli, F., Hajhoj, H. R., Basher, S. A., & Ghassan, H. B. (2015). An analysis of returns and volatility spillovers and their determinants in emerging Asian and Middle Eastern countries. International Review of Economics & Finance,39, 311-325.
- Baur, D. G. (2012). Financial contagion and the real economy. Journal of Banking & Finance, 36(10), 2680–2692. doi: 10.1016/j.jbankfin.2011.05.019
- Beirne, J., Caporale, G. M., Schulze-Ghattas, M., & Spagnolo, N. (2010). Global and regional spillovers in emerging stock markets: A multivariate GARCH-in-mean analysis. Emerging Markets Review, 11(3), 250–260. doi: 10.1016/j.ememar.2010.05.002
- Bekaert, G., Ehrmann, M., Fratzscher, M., & Mehl, A. (2014). The global crisis and equity market contagion. The Journal of Finance, 69(6), 2597–2649. doi: 10.1111/jofi.12203
- Bekaert, G., Harvey, C. R., & Ng, A. (2005). Market Integration and Contagion. The Journal of Business, 78(1), 39-69.
- Calvo, S. G., & Reinhart, C. M. (1996). Capital flows to Latin America: Is there evidence of contagion effects? (Policy Research Working Paper No. WPS1619). New York: World Bank, p. 219.
- Cappiello, L., Engle, R. F., & Sheppard, K. (2006). Asymmetric dynamics in the correlations of global equity and bond returns. Journal of Financial Econometrics, 4(4), 537–572. doi: 10.1093/jjfinec/nbl005
- Chakrabarti, R., & Roll, R. (2002). East Asia and Europe during the 1997 Asian collapse: A clinical study of a financial crisis. Journal of Financial Markets, 5 (1), 1–30. doi: 10.1016/S1386-4181(01)00022-2
- Chiang, T. C., Jeon, B. N., & Li, H. (2007). Dynamic correlation analysis of financial contagion: Evidence from Asian markets. Journal of International Money and Finance, 26(7), 1206–1228. doi: 10.1016/j.jimonfin.2007.06.005
- Claessens, S., Dell’Ariccia, G., Igan, D., & Laeven, L. (2010). Cross-country experiences and policy implications from the global financial crisis. Economic Policy, 25(62), 267–293. doi: 10.1111/j.1468-0327.2010.00244.x
- Deng, S., & Yang, C. (2008). An empirical study on the relationship between stock price and exchange rate in China. Journal of Financial Research, 1, 29–41.
- Dickey, D. A., & Fuller, W. A. (1979). Distribution of the estimators for autoregressive time series with a unit root. Journal of the American Statistical Association, 74(366a), 427–431. doi: 10.2307/2286348
- Dickey, D. A., & Fuller, W. A. (1981). Likelihood ratio statistics for autoregressive time series with a unit root. Econometrica: Journal of the Econometric Society, 49(4), 1057–1072. doi: 10.2307/1912517
- Dimitriou, D., & Kenourgios, D. (2013). Financial crises and dynamic linkages among international currencies. Journal of International Financial Markets, Institutions and Money, 26, 319–332. doi: 10.1016/j.intfin.2013.07.008
- Dimitriou, D., Kenourgios, D., & Simos, T. (2013). Global financial crisis and emerging stock market contagion: A multivariate FIAPARCH–DCC approach. International Review of Financial Analysis, 30, 46–56. doi: 10.1016/j.irfa.2013.05.008
- Dooley, M., & Hutchison, M. (2009). Transmission of the US subprime crisis to emerging markets: Evidence on the decoupling–recoupling hypothesis. Journal of International Money and Finance, 28(8), 1331–1349. doi: 10.1016/j.jimonfin.2009.08.004
- Dornbusch, R., Park, Y. C., & Claessens, S. 2000. Contagion: understanding how it spreads (English). The World Bank research observer, 15, 177–197.
- Dungey, M., Fry, R. A., González-Hermosillo, B., & Martin, V. L. (2010). Transmission of Financial Crises and Contagion: A Latent Factor Approach. Oxford University Press.
- Dungey, M., & Gajurel, D. (2014). Equity market contagion during the global financial crisis: Evidence from the world’s eight largest economies. Economic Systems, 38(2), 161–177. doi: 10.1016/j.ecosys.2013.10.003
- Eichengreen, B., Mody, A., Nedeljkovic, M., & Sarno, L. (2012). How the subprime crisis went global: Evidence from bank credit default swap spreads. Journal of International Money and Finance, 31(5), 1299–1318.
- Engardio, P. (2006). Chindia: How China and India are revolutionizing global business. New York: McGraw-Hill Professional.
- Engle, R. (2002). Dynamic conditional correlation: A simple class of multivariate generalized autoregressive conditional heteroskedasticity models. Journal of Business & Economic Statistics, 20(3), 339–350. doi: 10.1198/073500102288618487
- Engle, R. F., & Granger, C. W. (1987). Co-integration and error correction: Representation, estimation, and testing. Econometrica: Journal of the Econometric Society, 55(2), 251–276. doi: 10.2307/1913236
- Engle, R. F., & Kroner, K. F. (1995). Multivariate simultaneous generalized ARCH. Econometric Theory, 11(01), 122–150. doi: 10.1017/S0266466600009063
- Errunza, V. R. (1977). Gains from portfolio diversification into less developed countries’ securities. Journal of International Business Studies, 8(2), 83–99. doi: 10.1057/palgrave.jibs.8490688
- Fang, V., Lin, E., & Lee, V. (2007). Volatility linkages and spillovers in stock and bond markets: Some international evidence. Journal of International Finance and Economics, 7(1), 1–10.
- Forbes, K. J., & Rigobon, R. (2002). No contagion, only interdependence: Measuring stock market comovements. The Journal of Finance, 57(5), 2223–2261. doi: 10.1111/0022-1082.00494
- Graham, M., Kiviaho, J., & Nikkinen, J. (2012). Integration of 22 emerging stock markets: A three-dimensional analysis. Global Finance Journal, 23(1), 34–47.
- Granger, C. W. J., & Newbold, P. (1977). Forecasting economic time series. USA: Economic Theory and Mathematical Economics.
- Grubel, H. G. (1968). Internationally diversified portfolios: Welfare gains and capital flows. The American Economic Review, 58(5),1299–1314.
- Gulzar, S., Feng, H. X., & Yajie, W. (2007). The current account balance of Pakistan 1972–2005: A cointegration analysis. Information Technology Journal, 6(5), 664–671. doi: 10.3923/itj.2007.664.671
- Guo, F., Chen, C. R., & Huang, Y. S. (2011). Markets contagion during financial crisis: A regime-switching approach. International Review of Economics & Finance, 20(1), 95–109. doi: 10.1016/j.iref.2010.07.009
- Gupta, R., & Guidi, F. (2012). Cointegration relationship and time varying co-movements among Indian and Asian developed stock markets. International Review of Financial Analysis, 21, 10–22. doi: 10.1016/j.irfa.2011.09.001
- Hamao, Y., Masulis, R. W., & Ng, V. (1990). Correlations in price changes and volatility across international stock markets. Review of Financial Studies, 3(2), 281–307. doi: 10.1093/rfs/3.2.281
- Hilliard, J. E. (1979). The relationship between equity indices on world exchanges. The Journal of Finance, 34(1), 103–114. doi: 10.1111/j.1540-6261.1979.tb02074.x
- Huang, B. N., Yang, C. W., & Hu, J. W. S. (2000). Causality and cointegration of stock markets among the United States, Japan and the South China Growth Triangle. International Review of Financial Analysis, 9(3), 281–297. doi: 10.1016/S1057-5219(00)00031-4
- Huang, Y., & Feng, G. (2007). The role of oil price shocks on China’s real exchange rate. China Economic Review, 18(4), 403–416. doi: 10.1016/j.chieco.2006.02.003
- Huyghebaert, N., & Wang, L. (2010). The co-movement of stock markets in East Asia: Did the 1997–1998 Asian financial crisis really strengthen stock market integration? China Economic Review, 21(1), 98–112. doi: 10.1016/j.chieco.2009.11.001
- Johansen, S., & Juselius, K. (1990). Maximum likelihood estimation and inference on cointegration with applications to the demand for money. Oxford Bulletin of Economics and Statistics, 52(2), 169–210. doi: 10.1111/j.1468-0084.1990.mp52002003.x
- Kayani, G. M., Xiaofeng, H., & Gulzar, S. (2013). Financial contagion: Mean spillover effect of US financial market to the emerging financial markets in perspective of global financial crises. Journal of Convergence Information Technology, 8(17), 58.
- Kayani, G. M., Xiaofeng, H., & Gulzar, S. (2014). Global financial crisis: An EGARCH approach to examine the spillover effect on emerging financial markets. Journal of Applied Sciences, 14(20), 2622. doi: 10.3923/jas.2014.2622.2627
- Kearney, C., & Patton, A. J. (2000). Multivariate GARCH modeling of exchange rate volatility transmission in the European monetary system. The Financial Review, 35(1), 29–48. doi: 10.1111/j.1540-6288.2000.tb01405.x
- Kenourgios, D., & Padhi, P. (2012). Emerging markets and financial crises: Regional, global or isolated shocks? Journal of Multinational Financial Management, 22(1–2), 24–38. doi: 10.1016/j.mulfin.2012.01.002
- Kenourgios, D., Samitas, A., & Paltalidis, N. (2011). Financial crises and stock market contagion in a multivariate time-varying asymmetric framework. Journal of International Financial Markets, Institutions and Money, 21(1), 92–106. doi: 10.1016/j.intfin.2010.08.005
- Kim, B. H., Kim, H., & Lee, B. S. (2015). Spillover effects of the US financial crisis on financial markets in emerging Asian countries. International Review of Economics & Finance,39, 192-210.
- King, M. A., & Wadhwani, S. (1990). Transmission of volatility between stock markets. Review of Financial Studies, 3(1), 5–33. doi: 10.1093/rfs/3.1.5
- Kizys, R., & Pierdzioch, C. (2009). Changes in the international comovement of stock returns and asymmetric macroeconomic shocks. Journal of International Financial Markets, Institutions and Money, 19(2), 289–305. doi: 10.1016/j.intfin.2008.01.002
- Koop, G., Pesaran, M. H., & Potter, S. M. (1996). Impulse response analysis in nonlinear multivariate models. Journal of Econometrics, 74(1), 119–147. doi: 10.1016/0304-4076(95)01753-4
- Le, S. V. (1991). International investment diversification before and after the October 19, 1987 stock market crisis. Journal of Business Research, 22(4), 305–310. doi: 10.1016/0148-2963(91)90037-X
- Lee, S. B., & Kim, K. J. (1993). Does the October 1987 crash strengthen the co-movements among national stock markets? Review of Financial Economics, 3(1), 89. doi: 10.1002/j.1873-5924.1993.tb00574.x
- Lessard, D. R. (1974). World, national, and industry factors in equity returns. The Journal of Finance, 29(2), 379–391. doi: 10.1111/j.1540-6261.1974.tb03052.x
- Lessard, D. R. (1976). World, country, and industry relationships in equity returns: Implications for risk reduction through international diversification. Financial Analysts Journal, 32(1), 32–38. doi: 10.2469/faj.v32.n1.32
- Levy, H., & Sarnat, M. (1970). International diversification of investment portfolios. The American Economic Review, 668–675.
- Liang, C. C., Chen, M. Y., & Yang, C. H. (2015). The interactions of stock prices and exchange rates in the ASEAN-5 countries: New evidence using a bootstrap panel Granger causality approach. Global Economic Review, 44(3), 324–334. doi: 10.1080/1226508X.2015.1035300
- Lucey, B. M., & Voronkova, S. (2008). Russian equity market linkages before and after the 1998 crisis: Evidence from stochastic and regime-switching cointegration tests. Journal of International Money and Finance, 27(8), 1303–1324. doi: 10.1016/j.jimonfin.2008.07.004
- Lucey, B. M., & Zhang, Q. (2010). Does cultural distance matter in international stock market comovement? Evidence from emerging economies around the world. Emerging Markets Review, 11(1), 62–78.
- Malik, F., & Hammoudeh, S. (2007). Shock and volatility transmission in the oil, US and Gulf equity markets. International Review of Economics & Finance, 16(3), 357–368. doi: 10.1016/j.iref.2005.05.005
- Malliaris, A. G., & Urrutia, J. L. (1992). The international crash of October 1987: Causality tests. Journal of Financial and Quantitative Analysis, 27(3), 353–364. doi: 10.2307/2331324
- Markowitz, H. (1952). Portfolio selection. The Journal of Finance, 7(1), 77–91. doi: 10.1111/j.1540-6261.1952.tb01525.x
- Masih, A. M., & Masih, R. (1999). Are Asian stock market fluctuations due mainly to intra-regional contagion effects? Evidence based on Asian emerging stock markets. Pacific-Basin Finance Journal, 7(3–4), 251–282. doi: 10.1016/S0927-538X(99)00013-X
- Morales, L., & Andreosso-O’Callaghan, B. (2014). The global financial crisis: World market or regional contagion effects? International Review of Economics & Finance, 29, 108–131. doi: 10.1016/j.iref.2013.05.010
- Panton, D. B., Lessig, V. P., & Joy, O. M. (1976). Comovement of international equity markets: A taxonomic approach. Journal of Financial and Quantitative Analysis, 11(3), 415–432. doi: 10.2307/2330417
- Pesaran, H. H., & Shin, Y. (1998). Generalized impulse response analysis in linear multivariate models. Economics Letters, 58(1), 17–29. doi: 10.1016/S0165-1765(97)00214-0
- Phylaktis, K., & Ravazzolo, F. (2005). Stock prices and exchange rate dynamics. Journal of International Money and Finance, 24(7), 1031–1053.
- Pretorius, E. (2002). Economic determinants of emerging stock market interdependence. Emerging Markets Review, 3(1), 84–105. doi: 10.1016/S1566-0141(01)00032-2
- Qiao, Z., Qiao, W., & Wong, W. K. (2010). Examining stock volatility in the segmented Chinese stock markets: A SWARCH approach. Global Economic Review, 39(3), 225–246. doi: 10.1080/1226508X.2010.513138
- Ripley, D. M. (1973). Systematic elements in the linkage of national stock market indices. The Review of Economics and Statistics, 55(3), 356–361. doi: 10.2307/1927959
- Sharpe, W. F. (1963). A simplified model for portfolio analysis. Management Science, 9(2), 277–293. doi: 10.1287/mnsc.9.2.277
- Sims, C. A. (1980). Macroeconomics and reality. Econometrica: Journal of the Econometric Society, 48(1), 1–48. doi: 10.2307/1912017
- Solnik, B. H. (1974). Why not diversify internationally rather than domestically? Financial Analysts Journal, 51(1), 89–94. doi: 10.2469/faj.v51.n1.1864
- Stiglitz, J. E. (2003). Globalization and growth in emerging markets and the new economy. Journal of Policy Modeling, 25(5), 505–524. doi: 10.1016/S0161-8938(03)00043-7
- Syllignakis, M., & Kouretas, G. P. (2010). German, US and Central and Eastern European stock market integration. Open Economies Review, 21(4), 607–628. doi: 10.1007/s11079-009-9109-9
- Syllignakis, M. N., & Kouretas, G. P. (2011). Dynamic correlation analysis of financial contagion: Evidence from the Central and Eastern European markets. International Review of Economics and Finance, 20(4), 717–732. doi: 10.1016/j.iref.2011.01.006
- Syriopoulos, T., Makram, B., & Boubaker, A. (2015). Stock market volatility spillovers and portfolio hedging: BRICS and the financial crisis. International Review of Financial Analysis, 39, 7–18. doi: 10.1016/j.irfa.2015.01.015
- Tuluca, S., & Zwick, B. (2001). The effects of the Asian crisis on global equity markets. The Financial Review, 36 (1), 125–141. doi: 10.1111/j.1540-6288.2001.tb00007.x
- Valls, N., & Chuliá, H. (2012). Volatility transmission and correlation analysis between the USA and Asia: The impact of the global financial crisis. Global Economic Review, 41(2), 111–129. doi: 10.1080/1226508X.2012.686476
- Wang, L. (2014). Who moves East Asian stock markets? The role of the 2007–2009 global financial crisis. Journal of International Financial Markets, Institutions and Money, 28, 182–203. doi: 10.1016/j.intfin.2013.11.003
- World Federation of Exchanges and the B.S.E. 2016. Retrieved from https://www.world-exchanges.org/our-work/statistics.
- Worthington, A., & Higgs, H. (2006). Market risk in demutualized self-listed stock exchanges: An international analysis of selected time-varying betas. Global Economic Review, 35(3), 239–257. doi: 10.1080/12265080600887894
- Yang, J., Kolari, J. W., & Min, I. (2003). Stock market integration and financial crises: the case of Asia. Applied Financial Economics, 13(7), 477–486.
- Yarovaya, L., Brzeszczyński, J., & Lau, C. K. M. (2016). Intra- and inter-regional return and volatility spillovers across emerging and developed markets: Evidence from stock indices and stock index futures. International Review of Financial Analysis, 43, 96–114. doi: 10.1016/j.irfa.2015.09.004
- Yoon, S. M., & Kang, S. H. (2011). Dynamic relationship between exchange rate and stock price: Evidence from Korea.
- Zalduendo, M. J. (2006). Determinants of Venezuela’s equilibrium real exchange rate (Working Paper No. 6-74). International Monetary Fund.
Appendix A
Vector error correction method results
Table A1. Pre-crisis vector error correction model (V.E.C.M.)
Table A2. During crisis vector error correction model (V.E.C.M.)
Table A3. Post-crisis vector error correction model (V.E.C.M.)
Appendix B
Figure B1. Impulse response Pre-Crisis Period (01/07/2005-30/07/2007)
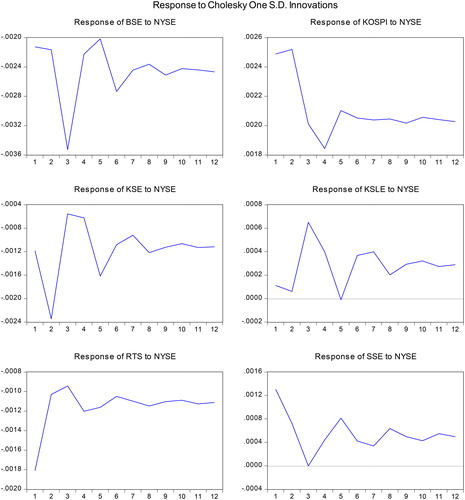
Figure B2. Impulse response During-crisis Period (01/08/2007-30/05/2009)
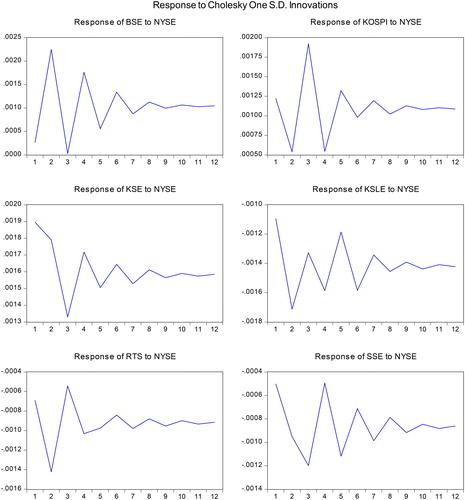
Figure B3. Impulse response Post-Crisis Period (01/06/2009-30/06/2015).