
Abstract
Investor sentiment is a research area in the theoretical field of behavioural finance that analyses the sentiment of investors and the way it influences stock market activity. Recently, there has been an increase in the number of publications in this area, which indicates its incremental relevance. To date, there is no consensus on the theoretical structure of behavioural finance nor on the investor sentiment research area. We have used co-citation, bibliographic coupling and co-occurrence analysis to provide an overview of the structure of investor sentiment. Therefore, this study contributes to defining the theoretical structure of investor sentiment by identifying the foundations of the research area and main journals, references, authors, or keywords, which represent the core of knowledge of this research area. The results obtained suggest that investor sentiment is related to efficient market theory and behavioural finance theories. Furthermore, investor sentiment is a relevant research field, especially since 2014. Advances in computer science or theories based on physics or mathematics can help to better define the influence of investor sentiment on stock markets. This study advances research on investor sentiment within the field of behavioural finance, thus showing its relevance.
1. Introduction
Behavioural finance is a research area that applies psychological theories to financial models to explain market anomalies (Shiller, Citation2003). One of these theories is prospect theory, based on expected utility theory with the probability replaced by weights (Kahneman & Tversky, Citation1979). Another theory is the disposition effect or the tendency of investors to hold assets that have lost value (losers) for too long and sell those that have gained value (winners) too early (Shefrin & Statman, Citation1985). Overconfidence is another theory that refers to the tendency to overestimate our own abilities and knowledge (Fischhoff, Slovic, & Lichtenstein, Citation1977; Michailova, Mačiulis & Tvaronavičienė, Citation2017). Therefore, behavioural finance analyses investor behaviour and how it affects stock markets from a psychological point of view. Since ethics and emotions influence financial performance (Cuomo et al., Citation2018) and behavioural functions are used to analyse financial markets (Khan, Shaorong & Ullah, Citation2017), behavioural finance has become an interesting research field.
Within the great variety of concepts studied by behavioural finance, there is one that is acquiring great relevance in recent years: investor sentiment and its relationship with real economy (Lacalle, Citation2018) or stock market activity (Barberis, Shleifer & Vishny, Citation1998). This relevance is reflected in the increase in the number of publications in recent years from around 10 in 2002 to over 100 in 2016. This increase is partly due to the emergence of a new measure of sentiment – microblogging or social network sentiment – encouraged by social networks and the emergence of language processing software (Houlihan & Creamer, Citation2017; Kim & Kim, Citation2014; Makrehchi, Shah, & Liao, Citation2013; Piñeiro-Chousa, López-Cabarcos, & Pérez-Pico, Citation2016).
Due to the recent increase in publications, investor sentiment literature lacks cohesion. This situation is also a defining trait of the area of behavioural finance. The main reason is that both are young areas that are still growing rapidly. In this sense, Costa, de Melo Carvalho, de Melo Moreira and do Prado (Citation2017) conducted a bibliometric analysis of the association between ‘behavioural finance,’ ‘financial and managerial decision making,’ ‘overconfidence,’ ‘anchoring effect’ and ‘confirmation bias’. Their study has contributed to the advancement of knowledge in this research area, but it addresses only part of the theoretical field of behavioural finance. To date, no bibliometric analyses have focused on investor sentiment as part of the field of behavioural finance. Therefore, the aim of this study is to identify the foundations, relevant authors, relevant journals and the core of knowledge of investor sentiment research in the theoretical field of behavioural finance. This analysis will provide a general overview of the structure of investor sentiment, establishing its basis and the most relevant aspects studied. Furthermore, the study will identify possible future research lines within the investor sentiment research field. To this end, we collected information from the Web of Science database about all studies related to investor sentiment published between 1987 and 2017. We have used bibliometric analysis, which is a technique that is growing in popularity thanks to technological advances such as the Internet (Roig-Tierno, Gonzalez-Cruz & Llopis-Martinez, Citation2017). This analysis provides an overview of the structure of a research area in a quick and easy way. Specifically, we have analysed co-citation of authors and references, bibliographic coupling of sources and co-occurrence of author keywords to provide a more comprehensive picture of the investor sentiment research area.
The following section reviews the theoretical research on investor sentiment. The subsequent sections describe the data and methodology used, and present and discuss the results, respectively, with the final section concluding and suggesting future research directions.
2. Literature review
Behavioural finance is defined by Shiller (Citation2003, p. 83) as ‘finance from a broader social science perspective including psychology and sociology’. The main characteristic of behavioural finance is that it contradicts efficient markets theory. Efficient markets theory states that investors act rationally, whereas behavioural finance considers that investors are not always rational and explains their behaviour from a psychological and sociological perspective. One of the greatest supporters of the theory of efficient markets is Eugene Fama. This author has criticised behavioural finance in light of two ideas: -1) market anomalies are random results, and 2) anomalies tend to disappear when there are changes in the methodology used to measure them (Fama, Citation1998).
The importance of behavioural finance increased in the 1990s, when some researchers replaced the econometric models that analysed time series of prices or dividends with financial models based on psychology (Shiller, Citation2003). Theories such as prospect theory (Kahneman & Tversky, Citation1979), loss aversion (Kahneman & Tversky, Citation1984), mental accounting (Thaler, Citation1980) or human behaviours such as disposition effect (Shefrin & Statman, Citation1985) or over-/under-reaction (Daniel, Hirshleifer & Subrahmanyam, Citation1998) were applied to finance to explain market anomalies that efficient markets theory failed to explain.
As previously mentioned, behavioural finance studies how investors make decisions from a psychological point of view. When investors make a decision, their sentiment, or state of mind, influences that decision (Blajer-Gołębiewska, Wach, & Kos, Citation2018; Lucey & Dowling, Citation2005). Investor sentiment can be defined as the optimism/pessimism of an investor about future stock market activity (Baker & Wurgler, Citation2006) or as the way investors form beliefs (Barberis et al., Citation1998). Several authors have proposed different ways to measure investor sentiment. There are measures based on surveys such as the Michigan Consumer Sentiment Index (MCSI) or Investors’ Intelligence, and measures that draw on market variables such as the closed-end fund discount (CEFD) (Qiu & Welch, Citation2004). Investor sentiment can also be measured through indices constructed from other market variables, such as the Equity Market Sentiment Index (EMSI) (Bandopadhyaya & Jones, Citation2006) or the Baker and Wurgler index (Baker & Wurgler, Citation2006, Citation2007). Recently, a new measure of sentiment has appeared: microblogging sentiment. This measure draws on the different communication platforms that exist on the Internet. In this sense, some studies have used investor sentiment taken from social networks such as Twitter (Sprenger, Tumasjan, Sandner & Welpe, Citation2014; Zhang, Li, Shen & Teglio, Citation2016), StockTwits (Piñeiro-Chousa, López-Cabarcos, & Pérez-Pico, 2017; Renault, Citation2017) or Facebook (Siganos, Vagenas-Nanos & Verwijmeren, Citation2017); message boards such as Yahoo! Finance (Kim & Kim, Citation2014) or RagingBull.com (Tumarkin & Whitelaw, Citation2001); and even Google searches (Da, Engelberg & Gao, Citation2011).
Investor sentiment clearly affects stock market activity, for example through asset valuation (Brown & Cliff, Citation2005). Moreover, a high investor sentiment can mean investors are bullish about stock markets (Liu, Citation2015), which can produce noise trading (De Long, Shleifer, Summers & Waldmann, Citation1990; Renault, Citation2017). High investor sentiment could also indicate high overconfidence (Odean, Citation1998a). Additionally, investor sentiment can be related to over-reaction, which increases when investor sentiment is low (Piccoli & Chaudhury, Citation2018). Additionally, investor sentiment can help explain other anomalies such as fire sales or limit of arbitrage (Yang & Zhou, Citation2015). Therefore, there is empirical evidence that investor sentiment is related to other behaviours studied in behavioural finance, and to market effects such as the Monday effect (Abu Bakar, Siganos & Vagenas‐Nanos, 2014) or bubbles (Feldman, Citation2010). Research also shows that high investor sentiment can predict low future returns (Frazzini & Lamont, Citation2008), and that social network sentiment can predict stock market activity (Asur & Huberman, 2010) or stock price movements (Makrehchi et al., Citation2013; Oh & Sheng, Citation2011). Moreover, social media sentiment can be used as a risk factor in asset pricing frameworks (Houlihan & Creamer, Citation2017). However, there is no standardised way to measure microblogging sentiment. Sul, Dennis and Yuan (Citation2017) found that Twitter sentiment influences stock returns by analysing the cumulative sentiment, whereas Logunov and Panchenko (Citation2011) did not find any influence of their index based on emoticons in Twitter messages. More recent studies have also shown that stock market activity can influence microblogging investor sentiment. In this sense, Kim and Kim (Citation2014) confirmed stock price performance’s positive influence on investor sentiment, and Piñeiro-Chousa et al. (Citation2016) showed that Tobin’s Q, P/E ratio and capitalisation are related to increases in microblogging investor sentiment. Therefore, these results suggest the existence of a causal relationship between investor sentiment and stock market activity (Li, Guo & Park, Citation2017).
This empirical evidence corroborates that investor sentiment is an important area in the theoretical field of behavioural finance, which is maturing and touching different areas. As such, a deeper analysis of the foundations and knowledge structure of this research area is necessary. This step will help to understand better market activity, certain investor behaviours, the tendency of particular financial variables or the relationship between the stock market activity and investor sentiment at specific moments.
3. Data and method
3.1. Data
We used the Web of Science database to search for publications on investor sentiment in the theoretical field of behavioural finance because it includes the largest number of articles published in journals classified in the JCR index. This database also gives a complete and relatively easily accessible information (Cancino, Merigó & Coronado, Citation2017). The terms used in the search were ‘behavioral finance’ and ‘sentiment’. The search system of the Web of Science database uses Boolean operators (OR, AND, etc.). As such, following Costa et al.’s (Citation2017) search method, we used the OR operator between the terms that define the general theoretical field (behavioural finance OR finance behaviour) and the AND operator to relate the terms applied to the field (behavioural finance OR finance behaviour AND sentiment). Therefore, the sentence used in the Web of Science Core Collection was: Topic: (behavio$ral_financ*) OR Topic: (financ*_behavio$ral) AND Topic: (sentiment). The $symbol allows the word ‘behavioural’ to be included in the results as well. This procedure ensures that all publications on behavioural finance are included in the study. The * symbol allows searching for all words beginning with ‘financ’ regardless of their ending, assuring that any word referring to finance is included.
We only selected articles to obtain more accurate results. Therefore, all those publications that are not classified as an article, namely book chapters, editorials or news, were not included. We did not limit the year of publication, scientific field of the study or language used to consider all the articles published on investor sentiment. As a result, we downloaded information about 709 studies published from 1987 to 2017, comprising the title, abstract, keywords, basic information about the authors and references cited in each article. We used Microsoft Excel and VOSViewer 1.6.6 to process and analyse the data.
3.2. Sample description
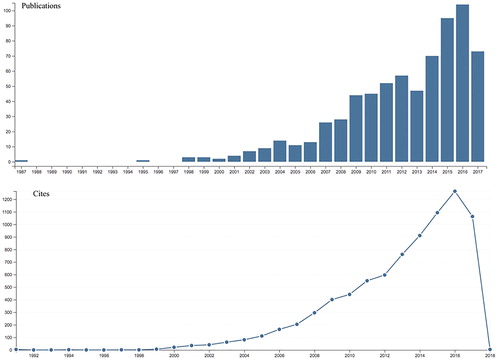
shows the publications and citations per year of investor sentiment in our database. The first article in the database dates from 1987. There is a gap between this year and the year when the next article was published, 1995. From 1998 onwards, there has been a constant and increasing publication activity, especially from 2014 onwards. This result suggests that investor sentiment is a current and interesting research field. All articles considered in this study were published before November 2017, the moment when the data were collected. There has also been an upward trend in the number of citations, which is more pronounced from 2012. This result corroborates the idea that investor sentiment is a booming topic.
Figure 1. Number of articles published and number of citations per year.
Source: Web of Science. Recovered 16th November 2017.
presents the main Web of Science categories and the most cited studies in the sample. As expected, the main categories are ‘Economics’ and ‘Business Finance’. It is relevant that the third category is ‘Mathematics Interdisciplinary Applications,’ instead of ‘Business’ or ‘Management’. Moreover, the sixth position is held by ‘Social Sciences Mathematical Methods’. This could mean that investor sentiment and behavioural finance had an important mathematical development. One example is the study by Abreu and Brunnermeier (Citation2003), in which a mathematical model is employed to explain bubbles. Additionally, the relevance of the category ‘Computer Science Artificial Intelligence’ may owe to the fact that some articles about investor sentiment apply artificial intelligence methodologies such as data mining or knowledge engineering (Leigh, Modani & Hightower, Citation2004). The eighth position is held by the ‘Physics Multidisciplinary’ category, which can be justified by the presence of some articles that apply physics models to investor sentiment. One example is the study by Choustova (Citation2007), which uses the pilot wave (Bohmian) model of quantum mechanics.
Table 1. Main Web of Science categories and most cited papers.
The most cited article within the sample is Market efficiency, long-term returns, and behavioral finance, by Fama (Citation1998). This author is known for his theory on efficient markets. The theory states that financial markets behave rationally, which is an idea that behavioural finance challenges. Without a doubt, this explains the high citation rate of Fama’s article. In this study, Fama criticises behavioural finance and argues that the efficiency of markets should not be discarded, concluding that anomalies of long-term returns tend to disappear when the measurement form is changed.
The article From efficient markets theory to behavioral finance, by Shiller (Citation2003), was cited 263 times. This study reviews financial theories from efficient markets theory to behavioural finance theories. Shiller criticises Fama’s (Citation1998) article and concludes that behavioural finance theories can explain some market anomalies that efficient markets theory cannot, such as bubbles or crashes.
The third most cited article is Bubbles and crashes, by Abreu and Brunnermeier (Citation2003), with 259 citations. This article presents a model that explains bubbles and crashes, arguing that bubbles can survive despite a rational arbitrage, which challenges the premises of efficient markets. These authors assume that rational arbitrageurs disagree about the moment when bubbles occur, which could be explained as the heterogeneities among traders.
The rest of the articles are on traditional finance (e.g., Campbell, Citation2000; Kothari et al., Citation2010) or stock market behaviour and investor behaviour (e.g., Boswijk, Hommes & Manzan, Citation2007; Daniel, Hirshleifer & Teoh, Citation2002; Hirshleifer, Hou, Teoh & Zhang, Citation2004).
This brief contextualisation provides a first look at the investor sentiment research field. We can conclude that this is a financial area that applies psychological theories, although other disciplines such as management, physics or computer science also find application here.
3.3. Method
We employed three bibliometric techniques: co-citation analysis, bibliographic coupling and co-occurrence. Co-citation analysis allows analysing the similarity between cited documents; bibliographic coupling analyses the similarity of citing documents; and co-occurrence identifies the core knowledge of the scientific field (Kovács, Van Looy & Cassiman, Citation2015; Su & Lee, Citation2010). Co-citation applied to authors and references is the most appropriate technique to identify the main authors and studies published on investor sentiment (Boyack & Klavans, Citation2010). We used bibliographic coupling with sources in order to identify the journals that are currently publishing articles related to this research field. The difference between co-citation analysis and bibliographic coupling is that co-citation measures the number of common forward citations of two studies or journals, whereas bibliographic coupling measures the number of common backward citations (Kovács et al., Citation2015). These two techniques provide an overview of the past (co-citation) and the present (bibliographic coupling) of the research area. We also employed the co-occurrence of author keywords to identify the core of the studied field. The keywords with a comparably higher network centrality are closer to the core of the scientific field studied than the others (Su & Lee, Citation2010). Thus, the identification of key concepts related to investor sentiment provides an overview of the research area.
The VOS approach provides a visual outline of the relationships among authors, publications, journals, and keywords. VOSViewer is an adequate software for this type of analysis because it constructs a map based on a co-occurrence matrix through a process consisting of three steps: 1) calculating a similarity matrix based on the co-occurrence matrix; 2) constructing a map applying the VOS mapping technique to the similarity matrix; and 3) translating, rotating, and reflecting the map (Van Eck & Waltman, Citation2010). This software has also been used in other recent bibliometric analyses in different areas such as business and management (Mingers & Leydesdorff, Citation2015), management and strategy (Appio, Cesaroni, & Di Minin, Citation2014) and neuroeconomics (Levallois, Clithero, Wouters, Smidts, & Huettel, Citation2012). However, it has never been applied to the analysis of investor sentiment research.
4. Results
4.1. Co-citation analysis
shows the top ten results for the co-citation analysis of references and authors. The analysis of references shows the basis of the research field. The most cited reference is Prospect theory: An analysis of decision under risk, by Kahneman and Tversky (Citation1979), with 184 citations. This article presents prospect theory as an alternative to expected utility theory, considering the value assigned to gains or losses instead of the value of the final asset.
Table 2. Reference co-citation and author co-citation results.
The article Investor psychology and security market under- and over-reactions, by Daniel et al. (Citation1998), is the second most cited article, with 92 citations. It analyses two psychological biases, overconfidence and biased self-attribution on the securities market, showing that both affect volatility, short-run earnings and future returns.
The next article in the list is Efficient capital markets: A review of theory and empirical work, by Fama (Citation1970), with 84 citations. The author reviews the efficient markets model, testing the weak, semi-strong, and strong forms of market. The preponderant position of this article is understandable because one of the statements of behavioural finance theory is the critique of efficient markets theory.
A model of investor sentiment, by Barberis et al. (Citation1998), is the first article about investor sentiment in the list and holds the fourth position, with 81 citations. It proposes a model of investor sentiment based on psychological evidence, conservatism, and the representativeness heuristic, producing under- and over-reaction and showing that investor sentiment is related to these behaviours.
The disposition to sell winners too early and ride losers too long: Theory and evidence, by Shefrin and Statman (Citation1985), is the fifth most cited article, with 79 citations. It deals with the behaviour pattern known as the disposition effect, which is the disposition to sell winners too early and hold losers for too long.
Noise trader risk in financial markets, by De Long et al. (Citation1990), has 75 citations and is in the sixth position. It presents a model whereby irrational noise traders affect prices. The model explains some anomalies such as the excess of volatility of asset prices or the mean reversion of stock returns.
Judgment under uncertainty: Heuristics and biases, by Tversky and Kahneman (Citation1974), is in the seventh position and has 74 citations. It explains three heuristics (representativeness, availability of instances or scenarios and adjustment from an anchor) employed in making judgments under uncertainty, and their application in economics.
The next article is Does the Stock Market Overreact? by De Bondt and Thaler (Citation1985), with 71 citations. It analyses if over-reaction behaviour influences stock prices, finding inefficiencies in the weak form market proposed by the efficient markets theory.
Are Investors Reluctant to Realize Their Losses? by Odean (Citation1998b) holds the ninth position with 71 citations. It shows that individual investors present a higher disposition effect, which depends on the other market participants.
The last article is Common risk factors in the returns on stocks and bonds, by Fama and French (Citation1993), with 68 citations. It analyses the risk factors of returns on stocks and bonds from an asset-pricing theory perspective. It also identifies three stock market factors (overall market factor, factors related to firm size and factors related to book-to-market equity) and two bond-market factors related to shared variations on the bond market.
Regarding link strength, which measures the strength of the link between the articles, the results change a little. In this sense, Barberis et al. (Citation1998) have a better link strength (link strength = 78) than Fama (Citation1970) (link strength = 77). Odean (Citation1998b) has a higher link strength (link strength = 71) than Tversky and Kahneman (Citation1974) (link strength = 67) and De Bondt and Thaler (Citation1985) (link strength = 68). The results show that the article with the highest link strength is Kahneman and Tversky (Citation1979) (link strength =163), meaning that the distance between this article and others is quite high.
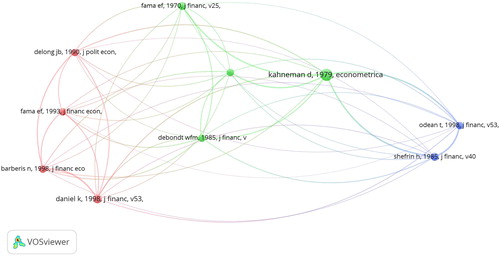
shows the top 10 references derived from the reference co-citation analysis. A label represents each reference and the font size indicates the times the reference is cited in the database. Therefore, the greater the size, the more often the reference is cited. The distance between two references denotes the probability that the two references are cited together. Therefore, the shorter the distance, the greater the probability of being cited together. The colours show the different clusters of cited references included in the analysis. References included in a cluster are more likely to be cited with other references from the same cluster. The graph shows three different clusters. The first cluster, in blue, is composed of two articles, by Odean (Citation1998b) and Shefrin and Statman (Citation1985). Both studies deal with the disposition effect, so the cluster can be labelled ‘Disposition effect’. The second cluster, in green, includes four references: Kahneman and Tversky (Citation1979), Tversky and Kahneman (Citation1974), De Bondt and Thaler (Citation1985) and Fama (1970). These articles are at the centre of the network, which means that they are the most relevant. This cluster includes the article with the highest link strength. Moreover, the articles in this cluster are the oldest and are linked with articles included in the other two clusters. Therefore, this cluster conforms to the basis of investor sentiment research and can be labelled ‘Fundamental base of investor sentiment’. The third cluster, in red, is composed of four articles: De Long et al. (Citation1990), Fama and French (Citation1993), Barberis et al. (Citation1998) and Daniel et al. (Citation1998). These articles analyse investor and market behaviours from different perspectives. Therefore, this cluster can be labelled ‘Investor and market behaviour’.
Figure 2. Reference co-citation analysis results.
Author co-citation results show the most cited authors. Most have written some articles included in the top 10 most cited references. If we consider link strength, the order does not change. Fama is the author with the highest link strength (link strength = 453.67).
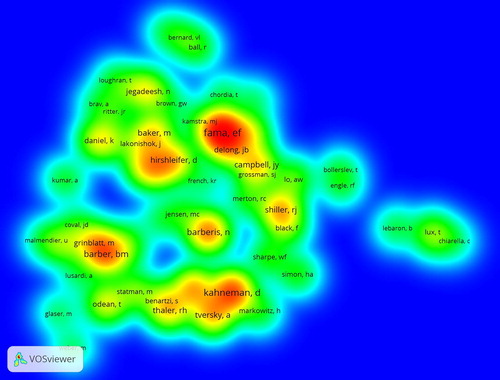
shows the density map of author co-citation analysis. The most cited authors are shown in red. Conversely, the green colour corresponds to the authors with fewer citations. The authors’ position on the map represents the proximity among them. Therefore, the closer they are, the greater the chance of appearing together. In the end, five groups are differentiated. The first group, led by Fama, includes authors whose main work is based on traditional finance (e.g., Campbell, Grossman). The second group, led by Kahneman, is formed by authors whose main publications are about psychological theories applied to finance (e.g., Kahneman, Tversky, Thaler). We could say that both groups form the basis of the investor sentiment research field. The other three groups are compounded of authors whose main work is based on different areas of behavioural finance such as overconfidence (e.g., Barber), disposition effect (e.g., Grinblatt) or investor sentiment (e.g., Baker, Barberis).
Figure 3. Author co-citation density map.
These results suggest that the basis of the investor sentiment research field is composed of articles on traditional and behavioural finance. The most relevant authors are Fama and Kahneman. In addition, investor sentiment is related to other behaviours studied by behavioural finance.
4.2. Bibliographic coupling of sources
shows the journals with a significant number of publications on investor sentiment. The journal with the most publications is the Journal of Behavioural Finance, with 51 articles. It is the journal with the highest link strength but, in terms of citations, there are other journals with higher citation rates. In this sense, the Journal of Financial Economics is the journal with the highest number of citations (citations = 1992). A reason could be that the Journal of Behavioural Finance is younger than the Journal of Financial Economics. Therefore, the most relevant results are those related to the number of publications and link strength.
Table 3. Bibliographic coupling results.
In terms of published articles, the second position is held by Quantitative Finance (documents = 35) and the third one by the Journal of Banking & Finance (documents = 33). However, the link strength of the Journal of Banking & Finance (link strength = 602.6) is higher than the link strength of Quantitative Finance (link strength = 525.05). This means that although Quantitative Finance has published more articles related to this field, the articles published by the Journal of Banking & Finance are more related to the study field.
These results show that the highest number of articles is published by the Journal of Behavioral Finance despite being a young journal. This result stresses the relevance of this journal for behavioural finance and investor sentiment. The second conclusion is the presence of Physica A—Statistical Mechanics and its Applications among the top ten sources; this journal is classified by Web of Science as a physics and multidisciplinary journal. This can explain the low link strength (link strength = 93.95) of this journal, which nevertheless has more citations than other finance and economics journals (Pacific-Basin Finance Journal, Economic Modelling, or European Journal of Finance). This result suggests that investor sentiment studies are not only based on financial and psychological theories but also on statistical mechanics, whose objective is to explain the behaviour of systems using probability theory (Gibbs, Citation1902). Finally, the third conclusion is the low number of citations of the European Journal of Finance (citations = 18) and its high link strength (link strength = 326.43). This result highlights the strong relationship between the publications of this journal and investor sentiment.
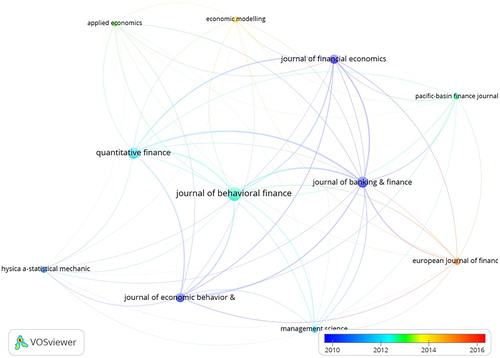
Regarding the average publication year (), the Journal of Behavioral Finance is at the centre of the map. This reinforces the relevance of this journal in investor sentiment research. Moreover, the colour of the circle is turquoise, which means that the average year of the publications about investor sentiment in this journal is 2012. The result indicates that this journal published articles on investor sentiment throughout the period considered. According to the graph, the journal that has published the most on investor sentiment in recent years is the European Journal of Finance, which is consistent with the aforementioned conclusion relative to the link strength of this journal. In addition, the journals that have published at the beginning but now have fewer publications on investor sentiment are Physica A—Statistical Mechanics and its Applications, Journal of Economic Behavior & Organization, Journal of Banking and Finance and Journal of Financial Economics.
Figure 4. Sources bibliographic coupling results by average publication year.
4.3. Author keywords co-occurrence
shows the average publication year of the articles in which a keyword appears. The most common keyword is ‘behavioral finance’ because its circle is the largest. It is at the centre of the map in green, which means that the average year of the publications containing this keyword is between 2012 and 2013. The next keyword is ‘market efficiency,’ followed by ‘investor sentiment,’ ‘disposition effect,’ ‘overconfidence,’ ‘prospect theory,’ ‘asset pricing’ and ‘financial markets’ (). This means that the core of knowledge of investor sentiment includes articles related to market efficiency and behavioural finance. This reinforces the results obtained in previous analyses, showing that investor sentiment is a research area of behavioural finance related to other market behaviours and anomalies and to traditional finance, market efficiency and asset pricing theory.
Figure 5. Author keywords co-occurrence results by average publication year.
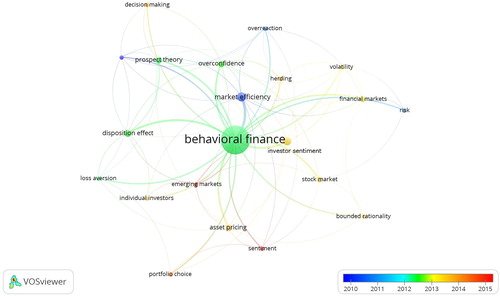
Table 4. Author keywords co-occurrence results.
At the beginning of the analysed period, the prevailing keywords were rather related to traditional finance (e.g., market efficiency, risk) and only half way through the period did the keywords on behavioural finance appear (e.g., behavioural finance, overconfidence, disposition effect, prospect theory). From 2014 onwards, the keywords specifically related to investor sentiment appeared; this situation is consistent with the boom of publications on the subject, thus corroborating the relevance of investor sentiment studies.
5. Limitations
Bibliometric analyses are subject to certain limitations that are generally derived from the choice of data and the analytical method used. An adequate selection of the search criteria is key to obtaining a database containing the largest number of articles on the subject under analysis. Otherwise, the results will not be valid. To avoid this situation, the search was carried out following the instructions detailed in the Method section. In addition, author co-citation analysis only considers the first author of a study, which implies loss of information regarding collaborating researchers (Córdoba-Cely, Alpiste, Londoño, & Monguet, Citation2012). Furthermore, in this kind of analysis, having authors with identical names can affect the results. In any case, this study has tried to avoid these limitations through an exhaustive search, by checking the existence of an exact correspondence between the name of the selected authors in the database and the name of the authors included in the articles considered.
6. Conclusions
This bibliometric analysis is the first about the investor sentiment research area in the theoretical field of behavioural finance. The analysis assesses the foundations of investor sentiment and the results show that this research area is based on articles related to traditional finance (mainly efficient markets theory) and to behavioural finance. This is corroborated because the most relevant authors are Fama and Kahneman. Fama is a reference author in efficient markets theory, whereas Kahneman is a reference author in behavioural finance.
Moreover, the analysis of the foundations of investor sentiment through reference co-citation analysis shows that investor sentiment is related to other behaviours studied by behavioural finance such as the disposition effect. The results obtained from the bibliographic coupling analysis of sources reveal that the Journal of Behavioral Finance is the most relevant journal in terms of publications, and that investor sentiment is related to other scientific disciplines such as physics. In addition, the European Journal of Finance is also a relevant journal because its publications have a strong relationship with investor sentiment and it is the journal that has published the highest number of articles on this topic over recent years. Finally, the relevance of investor sentiment seems clear from 2014 onwards if we consider the author keywords co-occurrence results. Altogether, the results show that investor sentiment is a fashionable research area considering the increasing number of publications on this topic over the last few years.
The study has many implications for researchers because the results obtained can be a guide for future new research. The results indicate the most relevant topics within the investor sentiment area and also the main journals that are publishing articles on this topic. In this sense, this research offers highly useful information for researchers in the area of investor sentiment to advance the knowledge in the behavioural finance research field.
In summary, investor sentiment has many expansion possibilities given its relation to other research areas such as physics, computer science or mathematics. In this sense, the application of physics or mathematical theories to obtain improved insights on the effect of investor sentiment on stock market activity could provide new lines of research. Logically, new research scopes and technological advances will provide new ways of considering and measuring investor sentiment, perhaps in relationship with pre-/post-human physiological responses that we cannot yet imagine.
Disclosure statement
No potential conflict of interest was reported by the authors.
References
- Abreu, D., & Brunnermeier, M. K. (2003). Bubbles and crashes. Econometrica, 71(1), 173–204. doi:10.1111/1468-0262.00393
- Abu Bakar, A., Siganos, A., & Vagenas-Nanos, E. (2014). Does mood explain the Monday effect? Journal of Forecasting, 33(6), 409–418. doi:10.1002/for.2305
- Appio, F. P., Cesaroni, F., & Di Minin, A. (2014). Visualizing the structure and bridges of the intellectual property management and strategy literature: A document co-citation analysis. Scientometrics, 101(1), 623–661. doi:10.1007/s11192-014-1329-0
- Asur, S., & Huberman, B. A. (2010, August). Predicting the future with social media. In Proceedings of the 2010 IEEE/WIC/ACM International Conference on Web Intelligence and Intelligent Agent Technology-Volume 01 (pp. 492–499). IEEE Computer Society.
- Baker, M., & Wurgler, J. (2006). Investor sentiment and the cross-section of stock returns. The Journal of Finance, 61(4), 1645–1680. doi:10.1111/j.1540-6261.2006.00885.x
- Baker, M., & Wurgler, J. (2007). Investor sentiment in the stock market. Journal of Economic Perspectives, 21(2), 129–151. doi:10.1257/jep.21.2.129
- Bandopadhyaya, A., & Jones, A. L. (2006). Measuring investor sentiment in equity markets. Journal of Asset Management, 7(3-4), 208–215.
- Barberis, N., Shleifer, A., & Vishny, R. (1998). A model of investor sentiment. Journal of Financial Economics, 49(3), 307–343.
- Blajer-Gołębiewska, A., Wach, D., & Kos, M. (2018). Financial risk information avoidance. Economic Research, 31(1), 521–536. doi:10.1080/1331677X.2018.1439396
- Boswijk, H. P., Hommes, C. H., & Manzan, S. (2007). Behavioral heterogeneity in stock prices. Journal of Economic Dynamics and Control, 31(6), 1938–1970. doi:10.1016/j.jedc.2007.01.001
- Boyack, K. W., & Klavans, R. (2010). Co-citation analysis, bibliographic coupling, and direct citation: Which citation approach represents the research front most accurately? Journal of the American Society for Information Science and Technology, 61(12), 2389–2404. doi:10.1002/asi.21419
- Brown, G. W., & Cliff, M. T. (2005). Investor sentiment and asset valuation. The Journal of Business, 78(2), 405–440. doi:10.1086/427633
- Campbell, J. Y. (2000). Asset pricing at the millennium. The Journal of Finance, 55(4), 1515–1567. doi:10.1111/0022-1082.00260
- Cancino, C. A., Merigó, J. M., & Coronado, F. C. (2017). A bibliometric analysis of leading universities in innovation research. Journal of Innovation and Knowledge, 2(3), 106–124. doi:10.1016/j.jik.2017.03.006
- Choustova, O. A. (2007). Quantum Bohmian model for financial market. Physica A: Statistical Mechanics and Its Applications, 374(1), 304–314. doi:10.1016/j.physa.2006.07.029
- Córdoba-Cely, C., Alpiste, F., Londoño, F., & Monguet, J. (2012). Análisis de cocitación de autor en el modelo de aceptación tecnológico, 2005-2010. Revista Española De Documentación Científica, 35(2), 238–261. doi:10.3989/redc.2012.2.864
- Costa, D. F., de Melo Carvalho, F., de Melo Moreira, B. C., & do Prado, J. W. (2017). Bibliometric analysis on the association between behavioral finance and decision making with cognitive biases such as overconfidence, anchoring effect and confirmation bias. Scientometrics, 111(3), 1775–1799. doi:10.1007/s11192-017-2371-5
- Cuomo, M. T., Tortora, D., Mazzucchelli, A., Festa, G., Di Gregorio, A., & Metallo, G. (2018). Impacts of code of ethics on financial performance in the Italian listed companies of bank sector. Journal of Business Accounting and Finance Perspectives, 1(1), 157–179.
- Da, Z., Engelberg, J., & Gao, P. (2011). In search of attention. The Journal of Finance, 66(5), 1461–1499. doi:10.1111/j.1540-6261.2011.01679.x
- Daniel, K., Hirshleifer, D., & Subrahmanyam, A. (1998). Investor psychology and security market under-and overreactions. Journal of Finance, 53(6), 1839–1885. doi:10.1111/0022-1082.00077
- Daniel, K., Hirshleifer, D., & Teoh, S. H. (2002). Investor psychology in capital markets: Evidence and policy implications. Journal of Monetary Economics, 49(1), 139–209. doi:10.1016/S0304-3932(01)00091-5
- De Bondt, W. F., & Thaler, R. (1985). Does the stock market overreact? The Journal of Finance, 40(3), 793–805. doi:10.2307/2327804
- De Long, J. B., Shleifer, A., Summers, L. H., & Waldmann, R. J. (1990). Noise trader risk in financial markets. Journal of Political Economy, 98(4), 703–738. doi:10.1086/261703
- Fama, E. F. (1970). Efficient capital markets: A review of theory and empirical work. The Journal of Finance, 25(2), 383–417. doi:10.2307/2325486
- Fama, E. F. (1998). Market efficiency, long-term returns, and behavioral finance. Journal of Financial Economics, 49(3), 283–306. doi:10.1016/S0304-405X(98)00026-9
- Fama, E. F., & French, K. R. (1993). Common risk factors in the returns on stocks and bonds. Journal of Financial Economics, 33(1), 3–56. doi:10.1016/0304-405X(93)90023-5
- Feldman, T. (2010). A more predictive index of market sentiment. Journal of Behavioral Finance, 11(4), 211–223. doi:10.1080/15427560.2010.526892
- Fischhoff, B., Slovic, P., & Lichtenstein, S. (1977). Knowing with certainty: The appropriateness of extreme confidence. Journal of Experimental Psychology: Human Perception and Performance, 3(4), 552–564. doi:10.1037//0096-1523.3.4.552
- Frazzini, A., & Lamont, O. (2008). Dumb money: Mutual fund flows and the cross-section of stock returns. Journal of Financial Economics, 88(2), 299–322. doi:10.1016/j.jfineco.2007.07.001
- Gibbs, J. W. (1902). Elementary Principles in Statistical Mechanics: Developed with Special Reference to the Rational Foundation of Thermodynamics. New York: Charles Scribner's Sons.
- Hirshleifer, D., Hou, K., Teoh, S. H., & Zhang, Y. (2004). Do investors overvalue firms with bloated balance sheets? Journal of Accounting and Economics, 38, 297–331.
- Houlihan, P., & Creamer, G. G. (2017). Can sentiment analysis and options volume anticipate future returns? Computational Economics, 50(4), 669–685. doi:10.1007/s10614-017-9694-4
- Khan, W., Shaorong, S., & Ullah, I. (2017). Doing business with the poor: The rules and impact of the microfinance institutions. Economic Research, 30(1), 951–963. doi:10.1080/1331677X.2017.1314790
- Kahneman, D., & Tversky, A. (1979). Prospect theory: An analysis of decision under risk. Econometrica, 47(2), 263–291. doi:10.2307/1914185
- Kahneman, D., & Tversky, A. (1984). Choices, values, and frames. American Psychologist, 39(4), 341–350. doi:10.1037//0003-066X.39.4.341
- Kim, S., & Kim, D. (2014). Investor sentiment from internet message postings and the predictability of stock returns. Journal of Economic Behavior & Organization, 107, 708–729. doi:10.1016/j.jebo.2014.04.015
- Kothari, S. P., Ramanna, K., & Skinner, D. J. (2010). Implications for GAAP from an analysis of positive research in accounting. Journal of Accounting and Economics, 50(2-3), 246–286. doi:10.1016/j.jacceco.2010.09.003
- Kovács, A., Van Looy, B., & Cassiman, B. (2015). Exploring the scope of open innovation: A bibliometric review of a decade of research. Scientometrics, 104(3), 951–983. doi:10.1007/s11192-015-1628-0
- Lacalle, D. (2018). Are the effects of unconventional monetary policy on financial markets causing bubbles? Journal of Business Accounting and Finance Perspectives, 1(1), 95–117.
- Leigh, W., Modani, N., & Hightower, R. (2004). A computational implementation of stock charting: Abrupt volume increase as signal for movement in New York stock exchange composite index. Decision Support Systems, 37(4), 515–530. doi:10.1016/S0167-9236(03)00084-8
- Levallois, C., Clithero, J. A., Wouters, P., Smidts, A., & Huettel, S. A. (2012). Translating upwards: Linking the neural and social sciences via neuroeconomics. Nature Reviews Neuroscience, 13(11), 789–797. doi:10.1038/nrn3354
- Li, H., Guo, Y., & Park, S. Y. (2017). Asymmetric relationship between investors' sentiment and stock returns: Evidence from a Quantile Non-causality Test. International Review of Finance, 17(4), 617–626. doi:10.1111/irfi.12120
- Liu, S. (2015). Investor sentiment and stock market liquidity. Journal of Behavioral Finance, 16(1), 51–67. doi:10.1080/15427560.2015.1000334
- Logunov, A., & Panchenko, V. (2011). Characteristics and predictability of Twitter sentiment series. In 19th International Congress on Modelling and Simulation, Modelling and simulation society of Australia and New Zealand, December 2011, 1617–1623.
- Lucey, B. M., & Dowling, M. (2005). The role of feelings in investor decision-making. Journal of Economic Surveys, 19(2), 211–237. doi:10.1111/j.0950-0804.2005.00245.x
- Makrehchi, M., Shah, S., & Liao, W. (2013). November). Stock prediction using event-based sentiment analysis. In Web Intelligence (WI) and Intelligent Agent Technologies (IAT), 2013 IEEE/WIC/ACM International Joint Conferences (Vol. 1, pp. 337–342). IEEE.
- Malmendier, U., & Shanthikumar, D. (2007). Are small investors naive about incentives? Journal of Financial Economics, 85(2), 457–489. doi:10.1016/j.jfineco.2007.02.001
- Michailova, J., Mačiulis, A., & Tvaronavičienė, M. (2017). Overconfidence, risk aversion and individual financial decisions in experimental asset markets. Economic Research, 30(1), 1119–1131. doi:10.1080/1331677X.2017.1311234
- Mike, S., & Farmer, J. D. (2008). An empirical behavioral model of liquidity and volatility. Journal of Economic Dynamics and Control, 32(1), 200–234. doi:10.1016/j.jedc.2007.01.025
- Mingers, J., & Leydesdorff, L. (2015). Identifying research fields within business and management: A journal cross-citation analysis. Journal of the Operational Research Society, 66(8), 1370–1384. doi:10.1057/jors.2014.113
- Odean, T. (1998). Volume, volatility, price, and profit when all traders are above average. Journal of Finance, 53(6), 1887–1934. doi:10.1111/0022-1082.00078
- Odean, T. (1998). Are investors reluctant to realize their losses? Journal of Finance, 53(5), 1775–1798. doi:10.1111/0022-1082.00072
- Oh, C., & Sheng, O. (2011, December). Investigating predictive power of stock micro blog sentiment in forecasting future stock price directional movement. In ICIS, 1–19.
- Piccoli, P., & Chaudhury, M. (2018). Overreaction to extreme market events and investor sentiment. Applied Economics Letters, 25(2), 115–118. doi:10.1080/13504851.2017.1302052
- Piñeiro-Chousa, J. R., López-Cabarcos, M. Á., & Pérez-Pico, A. M. (2016). Examining the influence of stock market variables on microblogging sentiment. Journal of Business Research, 69(6), 2087–2092.
- Piñeiro‐Chousa, J., Vizcaíno‐González, M., & Pérez‐Pico, A. M. (2017). Influence of social media over the stock market. Psychology & Marketing, 34(1), 101–108.
- Qiu, L., & Welch, I. (2004). Investor Sentiment Measures (No. w10794). National Bureau of Economic Research.
- Renault, T. (2017). Intraday online investor sentiment and return patterns in the US stock market. Journal of Banking & Finance, 84, 25–40. doi:10.1016/j.jbankfin.2017.07.002
- Roig-Tierno, N., Gonzalez-Cruz, T. F., & Llopis-Martinez, J. (2017). An overview of qualitative comparative analysis: A bibliometric analysis. Journal of Innovation and Knowledge, 2(1), 15–23. doi:10.1016/j.jik.2016.12.002
- Shefrin, H., & Statman, M. (1985). The disposition to sell winners too early and ride losers too long: Theory and evidence. Journal of Finance, 40(3), 777–790. doi:10.2307/2327802
- Shiller, R. J. (2003). From efficient markets theory to behavioral finance. Journal of Economic Perspectives, 17(1), 83–104. doi:10.1257/089533003321164967
- Siganos, A., Vagenas-Nanos, E., & Verwijmeren, P. (2017). Divergence of sentiment and stock market trading. Journal of Banking & Finance, 78, 130–141. doi:10.1016/j.jbankfin.2017.02.005
- Sprenger, T., Tumasjan, A., Sandner, P., & Welpe, I. M. (2014). Tweets and trades: The information content of stock microblogs. European Financial Management, 20(5), 926–957. doi:10.1111/j.1468-036X.2013.12007.x
- Su, H., & Lee, P. (2010). Mapping knowledge structure by keyword co-occurrence: A first look at journal papers in Technology Foresight. Scientometrics, 85(1), 65–79. doi:10.1007/s11192-010-0259-8
- Sul, H. K., Dennis, A. R., & Yuan, L. (2017). Trading on Twitter: Using social media sentiment to predict stock returns. Decision Sciences, 48(3), 454–488. doi:10.1111/deci.12229
- Thaler, R. (1980). Toward a positive theory of consumer choice. Journal of Economic Behavior and Organization, 1(1), 39–60. doi:10.1016/0167-2681(80)90051-7
- Tumarkin, R., & Whitelaw, R. F. (2001). News or noise? Internet postings and stock prices. Financial Analysts Journal, 57(3), 41–51. doi:10.2469/faj.v57.n3.2449
- Tversky, A., & Kahneman, D. (1974). Judgment under uncertainty: Heuristics and biases. Science, 185(4157), 1124–1131. doi:10.1126/science.185.4157.1124
- Van Eck, N. J., & Waltman, L. (2010). Software survey: VOSviewer, a computer program for bibliometric mapping. Scientometrics, 84(2), 523–538. doi:10.1007/s11192-009-0146-3
- Yang, C., & Zhou, L. (2015). Sentiment approach to underestimation and overestimation pricing model. Economic Modelling, 51, 280–288.
- Zhang, W., Li, X., Shen, D., & Teglio, A. (2016). Daily happiness and stock returns: Some international evidence. Physica A-Statistical Mechanics and Its Applications, 460, 201–209. doi:10.1016/j.physa.2016.05.026