
 ?Mathematical formulae have been encoded as MathML and are displayed in this HTML version using MathJax in order to improve their display. Uncheck the box to turn MathJax off. This feature requires Javascript. Click on a formula to zoom.
Abstract
Facing enormous differences in factor endowments across European agriculture the aim of the study was to identify the significance of differences in land, capital and labour endowments on the efficiency of different agricultural production types in the EU. The Ward Cluster Analysis was used to distinguish groups of EU regions, significantly differing in factor endowment, DEA model to determine the relative differences in technical efficiency of different types of agricultural production in EU regions and ANOVA analysis to assess the significance of differences in the efficiency of agricultural production types between these EU regions. It was found that generally the agriculture of the EU-12 regions was characterised in 2015 by higher efficiency of transforming inputs into effects than households in the EU-15 regions. Therefore, factor endowments play a significant role in transformation of production factors into effects. The article shows that there is a diversity of factor endowments in agriculture between EU region groups, which translates into differences in the technical efficiency of agricultural holdings of various types of production.
1. Introduction
It is primarily the utilisation of the production resources that determines the effects of farming. W. Petty considered land and labour as the primal factors of national wealth (Kunasz Citation2006, p. 34). In the real world, the prices of goods are determined by the cash costs of production comprising wages/salaries, pensions, and profits as the remuneration of the traditional production factors, labour, land, and capital, respectively. It was recognised in A. Smith’s later theory and became the basis for the formulation of the so-called Smith’s dogma, developed further by J. B. Say, who also noticed the value-creating role of capital and land, thus rejecting value theories based solely on labour (Kunasz Citation2006, p. 35). This also applies to agricultural products. According to the above theories, the supplies of production resources determine the production costs. Although the topic of efficiency in agricultural production is a subject of many analyses (mostly concerning specific type of production – such as analysis of milk farms or oilseed crop production efficiency (Rusielik and Prochowicz Citation2007, Prochowicz and Rusielik Citation2007)), to the best of our knowledge there is still a lack of comprehensive comparative study on efficiency of all agricultural production types on a regional scope in European Union agriculture. Regional approach is crucial because of the high differentiation of European agriculture which occurs also at the national level. Moreover, all of the existing analysis does not take into account differences in the scale of the European Union regions – there is some research on the impact of local spatial differences or some chosen farms from different countries (Rusielik and Świtłyk Citation2012, Rusielik Citation2013), but European regional scope was not the subject of such research. The case of the European Union allows us to compare the situation of countries having a different course of structural changes (in the eastern and western parts of the European Union) being the subject of the Common Agricultural Policy. Therefore, the aim of the article is to assess the link of agriculture’s supplies of resources: land, capital, and labour with the technical efficiency of various directions of agricultural production on the example of the European Union. The paper is organised as follows. In the next section we review different approaches to the measuring of technical efficiency and links to resource analysis. Then we discuss the advantages and limitations of the chosen methods, i.e., DEA method. In the methodology section we construct a division of EU regions as a result of cluster analysis, conduct DEA in distinguishable groups and check the statistical significance of differences. The final section contains results, discussion and general conclusions.
2. Technical efficiency and resources analysis in literature
To date, the influence of the supplies of production factors on the efficiency relationships in agriculture was researched by various authors only selectively and involved selected types of specialisation of agricultural production and selected EU countries. The influence of the supplies of resources on the efficiency of various types of production, including agricultural production, results from the function of production. The factor-product relationship is one of the main economic characteristics of production processes. An improvement of the factor-product relationship, i.e., improvement of the efficiency of production, is the fundamental endogenous source of maximising the producer’s objective function. We can talk about this improvement only in the case of fixed prices (Bezat-Jarzębowska, Rembisz & Sielska Citation2012). The same applies to the assessments which are aimed at specifying changes in the total factor productivity (TFP) (Latruffe Citation2010, p. 18). Examples of the production function include the CES function and the Cobb-Douglas function. In agricultural economics, the three-factor (dynamic) Cobb-Douglas function is usually used (Rembisz & Sielska Citation2012, p. 127; Bezat, & Rembisz, Citation2011, p. 23). The properties of the Cobb-Douglas production function in the analyses of the factor-product relationship in agricultural production are mentioned by A. Bezat and W. Rembisz (Citation2011). The CES production function, in turn, conveys the factor relationships in agricultural production quite well, particularly in the context of the intensification theory (Bezat-Jarzębowska, Rembisz, Sielska Citation2012, p. 107). Various approaches exist in the literature to quantify agricultural efficiency and productivity. According to Dudu and Kristkova (Citation2017), these studies can be grouped in two categories: the growth accounting based and the frontier based approaches. The first group, concerning traditional growth accounting and regression analysis, which derives productivity growth as a mechanical residual. The second – frontier approaches such as the non-parametric data envelopment analysis (DEA), which is based on linear mathematical programming and the estimation of the efficiency limit, and the parametric stochastic frontier analysis (SFA), have an advantage in deriving technical efficiency (static analysis) and technical change and combining them into the Malmquist TFP index (dynamic analysis). It is important to stress here that technical efficiency is only one of the components of total factor productivity (TFP) which measures the distance of the individual to the frontier which represents the best possible production technology for the sample.
In the context of the production function, we can talk about the so-called technical efficiency of production, i.e., a situation in which, maximising the production output, the producer will not put more factors into production than necessary in order to achieve this output level. The establishment of relationships between various entities in this respect is possible with the use of the non-parametric data envelopment analysis (DEA) method. In the sample of objects under study, the one whose efficiency is the highest is determined (we then talk about full efficiency). It constitutes a point of reference for the remaining units, whose efficiency indicators are relativised relative to this object (Charnes, Cooper, Lewin & Seiford Citation1994). The use of the non-parametric approach to measuring the relative efficiency of units was introduced by Charnes, Cooper & Rhodes (Citation1978). The theoretical basis for the DEA method is M. J. Farell’s definition of productivity. Relying on the approach assuming variable economies of scale is in keeping with the law of diminishing returns, common in economic reality (Rembisz & Sielska Citation2012, p. 22). The use of the non-parametric data envelopment analysis method makes it possible to determine synthetic indicators of the technical efficiency of the entities under study, within a range from 0 to 1, and the higher the indicator, the higher the technical efficiency (Coelli et al. Citation2005, p. 67), which constitutes a considerable advantage of this method compared to the often applied partial indicators of efficiency assessment, i.e., for example, the efficiency of fixed assets, land productivity, and labour productivity. One of the advantages of the DEA method in the analyses of efficiency in agriculture is also the possibility of using inputs and outputs with different identifiers.
The impact of farm size on technical efficiency or on productivity change is investigated using various indicators of size, among which the most common are: total output (e.g., Latruffe et al., Citation2004); utilised agricultural area (e.g., Hadley, Citation2006; Rios & Shively, Citation2006; Carroll et al., Citation2009); herd size or number of animals (Hadley, Citation2006; Tonsor & Featherstone, Citation2009); European Size Units (ESU) (e.g., Zhu et al., Citation2008a and Citation2008b; Latruffe et al., Citation2009); farm value added (Hallam & Machado, Citation1996) and labour used or assets (e.g., Bojnec & Latruffe, Citation2009). A considerable range of results can be quoted: on the one hand larger farms happen to be better performers (e.g., Latruffe et al., Citation2004 and Citation2008, for crop farms in Poland during 1996–2000; Hadley, Citation2006, for various production types in England and Wales during 1982–2002; Rios & Shively, Citation2006, for coffee farmers in Vietnam in 2004; Zhu et al., Citation2008a, for dairy farms in Germany and Sweden during 1995–2004; Carroll et al., Citation2009, for farms specialised in cattle rearing, cattle finishing, cereals and dairy in Ireland during 1996–2006); but on the other hand also smaller farms are better performers (e.g., Munroe, Citation2001, for Polish farms in 1996; Zhu et al., Citation2008b, for Greek olive farms during 1995–2004). Moreover, it should be stated that the results depend on the size variable used (e.g., Bojnec and Latruffe, Citation2009, for Slovenian farms during 1994–2003). Also the effect of factor intensity on technical efficiency is often investigated (e.g., Latruffe et al., Citation2004; Carroll et al., Citation2009; Latruffe et al., Citation2009). Factor intensity is usually defined as capital to labour or to animal ratio, or as land to labour or to animal ratio. However, the studies on technical efficiency provided rather ambiguous findings. Nivievskyi and von Cramon-Taubadel (Citation2008) in the study on dairy production in Ukraine in 2004–05 found that labour intensity and feed land per cow has a negative influence. Resorting to external factors is often considered as a determinant of farm technical efficiency. Therefore, the share of hired labour in total labour input, the share of rented land in total land used, and the indebtedness level (understood as the level of debts or the debt to asset ratio) are used in the regression of technical efficiency. Ambiguous results are found also regarding the share of hired labour and rented land (e.g., Latruffe et al., Citation2004; Hadley, Citation2006; Zhu et al., Citation2008a and Citation2008b; Lambarra et al., Citation2009; Latruffe et al., Citation2009; Tonsor & Featherstone, Citation2009). On the one hand hired labour may imply better educated workers or specifically skilled workers, but on the other hand it may result in supervision issues. Renting land in turn may be an incentive for farmers to be productive in order to pay rentals, but it may also prevent them from applying long-term improvements.
Some authors investigated the impact of farm specialisation on technical efficiency. Farm specialisation might be beneficial to technical efficiency while it enables farmers to concentrate their attention on a few activities, and therefore improves the management process. It helps to avoid conflicts in crop rotations and prevents competition for the same resource, e.g., land. This effect is found by Zhu et al. (Citation2008a) for Swedish and German dairy farms during 1995–2004, Carroll et al. (Citation2009) for Irish crop and dairy farms during 1996–2006 and Błażejczyk-Majka et al. (Citation2011) for large and small field crop farms and mixed farms of the old and new EU regions during 2004–2007. Diversification may also improve efficiency by reducing the risk related to the loss of all crops in cases of disease (e.g., Hadley (Citation2006), Bojnec & Latruffe (Citation2009) and Carroll et al. (Citation2009)).
Unlike these approaches, this study concerns the technical efficiency of all types of agricultural production and all EUFADN regions, so it is comprehensive in nature. Also the use of the DEA method for this purpose gives the article certain features of novelty, as this method is mostly used in the bank, educational, and health care sectors (Cvetkoska & Savić Citation2017, p. 318). This approach as stated in the introduction, has some valuable advantages, e.g., there is no need for definition of functional forms a priori, and it allows for the use of multiple inputs and outputs (Bojnec – Latruffe Citation2009). We used the data for the FADN regions, because we assumed that the data on the EU countries is characterised by too high a level of aggregation. Agricultural economists (e.g., Gorton & Davidova Citation2004; Swinnen Citation2009) claim that technical efficiency in agriculture depends on a combination of various factors such as technology used and relative factor abundance, institutional and policy reforms with input and output market environment, farm size and scale economies, organisation and management, farm’s specialisation, etc. Technical efficiency analyses in the literature are numerous, but inter-country and moreover regional comparisons are rather rare (Lissitsa et al. Citation2007). The novelty of this paper lies in the in-depth analysis of technical efficiency in the agriculture of different production types in clusters of EU regions of similar combinations of factor endowments.
3. Research methodology
We used a three-stage statistical procedure. At the first stage, in EU-28, we isolated areas (aggregations of EU-28 regions) significantly different in terms of agriculture’s supplies of land, capital, and labour in 2015. For that purpose, we carried out a cluster analysis using Ward’s method with the use of Euclidean distance, including 136 representative farms for all the EUFADN regions (representing 4,673,550 EU-28 farms in 2015). The results of the cluster analysis made it possible for us to isolate EU region aggregations characterised by similar factor endowments. The farms’ supplies of land were determined with the use of an average-size farm in ha of agricultural land (AL), their supplies of labour with the use of labour input in AWU and their supplies of capital through the representative farm’s supplies of total assets owned by the farmer without land value. Due to the fact that the assumption of the equinumerosity of the groups (aggregations) was not met, we applied the non-parametric Mann-Whitney U-test to assess the statistical significance of the differences between the means. In order to determine the various kinds of production, we used production types according to FADN. To manage the problem of price diversity across the European Union noted among others in the Beugeldsijk, Klasing and Milionis (Citation2018) study on regional economic development in Europe and the role of total factor productivity, we corrected nominal data by purchasing power parity indicators taken from Eurostat on a country basis.
At the second stage of research, we compared the technical efficiency indicators of representative farms of the same production type in the EU regions forming aggregations differing in terms of land, capital, and labour supplies. The efficiency of the individual types of representative farms from the EU regions was examined with the use of input-oriented DEA models, with variable economies of scale. In order to establish the optimum technology for farms, we therefore used the following formula (Cooper, Seiford, & Tone Citation2007):
(1)
(1)
where:
P(x,y) – set of production capabilities in the farm sample under study,
xj – input vector m (labour in man-hours, land in hectares of AL, and total assets in EUR) on the j-th farm,
X – input matrix (labour in man-hours, land in hectares of AL, and total assets in EUR) sized (n*m) for all n farms,
yj – output vector s (agricultural income in EUR) on the j-th farm,
Y – output matrix (agricultural income in EUR) sized (n*s) for all n farms,
λj – weights which are the coefficients of the linear combination.
The establishment of the set of production capabilities made it possible for us to then measure the distance between the best farms, representing the optimum technology, and the remaining farms, which is reflected in the following formula:
(2)
(2)
where:
E (xj,yj) – function of distance between the point characterising the technology of the given farm and the optimum technology (envelope),
θ – efficiency coefficient of the given farm,
P(x,y), xj, yj – as in formula 1.
Arranging the objects under research (representative farms from the EU regions) according to the level of their technical efficiency made it possible for us to assess the differences in the efficiency of the individual types of agricultural production given the specific supplies of labour, land, and capital resources. To determine the efficiency indicators of various types of agricultural production in 2015 in the individual EU regions, we used agricultural income in EUR as the production output. With regard to input, we used: land input in hectares of agricultural land, total working time of people as part of the farm’s operational activity expressed in hours, and the value of total assets in EUR, including the value of the farm buildings, machinery and equipment, fixed assets in the investment phase, and current assets (Floriańczyk et al. Citation2014, pp. 28–30). As observed by Rembisz and Sielska (Citation2012, p. 166), the classification of variables in terms of their connection with the production factors is an individual matter and depends on the subjective assessment of the researcher and the characteristics of the research problem (Rembisz and Sielska Citation2012, pp. 165–66). Therefore, the technical efficiency indicators calculated by us expressed the efficiency of the transformation of land, capital, and labour input into the final production output measured in agricultural income within the given EU region relative to the other regions with the same type of agricultural production and different factor endowments.
At the next, third stage of research, we carried out a unidimensional and single-factor analysis of variance (ANOVA), in which the qualitative predictor was the given region’s inclusion in the A, B or C aggregation, and the dependent variable – the indicators of technical efficiency for the same types of agricultural production within these aggregations. We used the F-statistic, which makes it possible to conclude whether one independent variable (inclusion in the given aggregation) has an influence on the results in terms of one dependent variable (efficiency). Because the F-test does not say which aggregations differ from each other in terms of the efficiency of various types of agricultural production, for the assessment of the significance of the differences in the dependent variable vector between aggregations A and B, A and C, and B and C, we used the multidimensional post-hoc tests: Scheffe’s test, Tukey’s HSD test for unbalanced observations and LSD.
The quite restrictive assumptions of the ANOVA analysis may pose a certain degree of difficulty. They were met with the following reservations:
the assumption of measurability of dependent variables – met without comments;
the assumption of the randomness of the sample and independence of measurements – met without comments;
the assumption of the randomness of selection in terms of the supplies of resources models – met without comments (inclusion in the given group was determined by the representative farms’ supplies of land, capital, and labour, which is a factor independent of the authors’ decision);
the assumption of the normal distribution of the analysed dependent variables in each of the subgroups of the qualitative predictor – met with comments (the points illustrating the value of the dependent variable in each aggregation and production type were situated close to the straight line. Only in the field crops and horticulture types in aggregation B, the concentration of farms with efficiency coefficients equal to a unity caused the distribution of the dependent variable to deviate slightly from the straight line. Therefore, it was concluded that the dependent variable has a similar distribution to normal distribution in each group);
the assumption of the homogeneity of variance – met with comments; only the variables which met this assumption in full were subjected to the analysis. Variance analysis tests require the assumption that in different groups the variances are homogenous. The most powerful test to verify this assumption is Levene’s test, yet in a situation in which two (or more) groups have different numerical strengths, the Brown-Forsythe test should be used. Because of that, the assumption of the homogeneity of variance was verified with the Brown-Forsythe test, as the groups of regions (aggregations) had different numerical strengths. Its results confirmed that the assumption of the homogeneity of variance for all the types of agricultural production is met, with the exception of farms specialised in granivore breeding – p-value lower than 0.05 (see ). Therefore, this type of agricultural production was excluded from further analyses.
The temporal scope of the analyses included the year 2015, the spatial scope – the individual regions of the EU, and the subjective scope focused on the representative farms from these regions.
4. Results and discussion
Regional diversity of EU-28 according to agriculture’s supplies of production factors
In the EU in 2015, there were three aggregations of regions differing in the resource-related determinants of agricultural production (see ). The aggregation with the lowest numerical strength (A), including only seven EU regions, was characterised by the highest supplies of each of the production resources compared to the other regions (see ). This results from the analysis of mean values and was confirmed with the Mann-Whitney U-test, which proved that the differences in the land, capital, and labour supplies between the regions from aggregations A and B and between the regions from aggregations A and C were statistically significant (see ). This aggregation included five German regions (Brandenburg, Mecklenburg-Vorpommern, Sachsen, Sachsen-Anhalt, Thueringen), as well as the Czech Republic and Slovakia. The remaining regions of Germany belonged to aggregation C, including a total of 63 European regions. This aggregation also included all the Scandinavian regions, the regions of the United Kingdom, Ireland, and France, except for two regions, namely Languedoc-Roussillon and Provence-Alpes-Cote d’Azur, which belonged to aggregation B, as well as Belgium and the Netherlands. Compared to the representative farms from aggregation A, it was characterised by more than five times lower land resources, more than three times lower labour resources, and nearly four times lower capital resources per one representative farm from these regions.
Figure 1. Clusters of EU regions differing in resource conditions of agriculture in 2015.
Source: Own study based on EUFADN data.
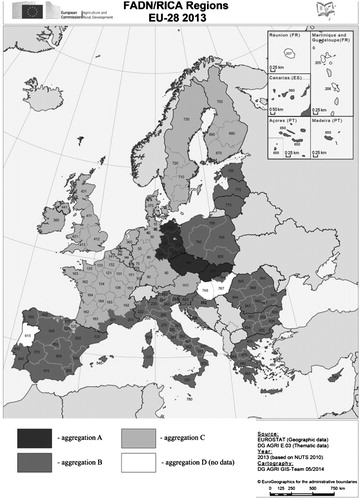
Table 1. Average factor endowment of representative farms in clusters of EU regions in 2015.
Table 2. Results of the statistical significance assessment of differences between the average values determining land, labour and capital endowment of representative farms from the EU regions in 2015 (p level in the Mann-Withney U-test – the differences are significant with p < 0.05).
At the same time, the supplies of land (nearly three times) and total assets (four times higher) were much higher in the case of farms from aggregation C than aggregation B. The difference between the farms from the two aggregations (B and C) was the lowest regarding the supplies of the labour factor (see ), but the differences between them in this respect were also statistically significant, just as in the case of the other two production factors (see ).
In terms of numerical strength, aggregation B was the largest, including regions characterised by the lowest supplies of production resources of the representative farms compared to the other two aggregations. It included most of the regions from the EU-12 countries, except for the Czech Republic and Slovakia, as well as all the regions of Spain, Italy, Greece, and Croatia. The results of the cluster analysis made it possible to isolate groups of EU regions with similar and significantly different farm supplies of all the traditional production factors, i.e., land, capital, and labour (see ). At the next stage of our research, we decided to answer the question of whether the differences in this respect significantly translate into the efficiency of various types of agricultural production. We expected that there is an interrelationship in this respect, i.e., that the differences in farm supplies of land, labour, and capital cause the occurrence of statistically significant differences in the technical efficiency of the same directions of agricultural production between the EU regions that differ in terms of these supplies.
Factor endowments and the efficiency of various directions of agricultural production in the european union
The efficiency of various kinds of agricultural production in 2015 was the highest in the case of farms from the regions included in aggregation A with the highest factor endowments. This applied to all the directions of agricultural production found in the representative farms from the regions making up this aggregation (see ). These results are comparable with conclusions of Bojnec et. al. (Citation2014) who found that relative natural agricultural factor endowments are important for efficiency in a positive way. Endowments of labour and land should therefore be the same.
Table 3. Indicators of technical efficiency of various agricultural production types in clusters of EU regions, differing in factor endowment in 2015.
Farms from aggregation B with the lowest factor endowments came second in terms of the efficiency of various kinds of agricultural production. This included all the types of specialisation of agricultural production in the EU, as well as the farms combining its different types, i.e., multidirectional farms with the exception of horticulture and other permanent crops (see ). In 2015, the lowest average efficiency of agricultural production, compared to the other aggregations, could be found in the farms from aggregation C, which included regions from the EU-15 countries (see ), with higher agricultural supplies of land, capital, and labour than in the case of farms from aggregation B. The differences in the efficiency of agricultural production between farms from aggregations B and C equalled 0.03 in 2015, in favour of the farms from the regions making up aggregation B. The average efficiency of agricultural production of the farms from aggregation B was 0.76 in 2015, and in the case of the farms from aggregation C, it was 0.73. Therefore, it should be noted that in 2015, the farms from the EU-12 regions were characterised by higher efficiency of transforming input into output than the farms from the EU-15 regions with the exception of horticulture and other permanent crops from these two clusters. This included all the EU regions except for the farms from the regions making up aggregation A and all the types of agricultural production (see ).
The reason for these differences may be the differences in the prices of inputs used in agriculture and agricultural products between the EU-12 and EU-15 countries. Another reason for this tendency may be relying to a larger extent on own labour inputs in the EU-12 agriculture than in the EU-15 agriculture. Own labour inputs are not evaluated by FADN and so they are not included in the costs of production factors and do not cause an increase in the value of inputs used in agriculture (Floriańczyk et. al. 2013). As a result, differences in agricultural efficiency also result from differences in the agricultural system between the EU-15 and EU-12 countries which translate into a larger percentage of family farms in the EU-12 than in the EU-15 (for more, see Majchrzak Citation2015) . Further, we checked whether the differences in the technical efficiency of various directions of agricultural production between the aggregations of EU regions, which differ in land, capital, and labour supplies, were statistically significant. For this purpose, we carried out the analysis of variance (ANOVA) for all the types of agricultural production except for grazing livestock and mixed farms, because in these types of production, the assumption of the homogeneity of variance in the clusters was not met (see ).
Ttcase 4. The probability of incorrectly rejecting H0 of homogeneity of the variance coefficients in the clusters A, B, C for H1 which says that the variances are not homogeneous - the Brown-Forsythe test.
The results of the one-factor analysis of variance showed that the values of the efficiency coefficients of milk production (see ), in the aggregations of EU regions do differ significantly. The post-hoc tests confirmed that there are significant differences in the efficiency of dairy cow breeding in the region aggregations A and B and A and C, differing in agriculture’s supplies of land, labour, and capital (see ).
Table 5. The results of the assessment of statistical significance of differences in the efficiency of different types of agricultural production between the EU regions in 2015 (one-way analysis of variance, differences are significant with p < 0.05).
Table 6. Results of statistical significance assessment of average differences in the efficiency of dairy cows and multidirectional production between regions from A, B and C clusters in 2015 (differences are significant with p < 0.05).
The significance of the differences in the efficiency of milk and mixed production was definitely higher between the farms from aggregations A and C, than A and B (cf. ). Therefore, the earlier conclusion that the farms from aggregation A specialising in these types of production achieved higher indicators of production efficiency than the farms from aggregation C seems justified.
The results of the analysis also confirmed the statistical significance of the differences in the efficiency of the same types of agricultural production between the farms from aggregations B and C. However, it was shown only when using the NIR test. More conservative tests (Scheffe and HSD) did not confirm the statistical significance of differences between these clusters in the efficiency of rearing dairy cows. The research did not confirm the significance of differences in the efficiency of multidirectional production between B and C clusters. It is therefore justified to say that the farms from the regions of aggregation B, characterised by the lowest agriculture supplies of land, capital, and labour compared to the other two, had no higher indicators of efficiency for the same types of agricultural production than for the farms from aggregation C. Higher efficiency of farms from cluster A than from aggregation B and C is confirmed by the substitution relationship of productivity and resource size of a given factor, which translates into an answer to the question of which of an extensive or intensive growth is more effective. The results of this study confirm the results of Bezat-Jarzębowska and Rembisz (Citation2017, pp. 32–36) concerning such a dependence in terms of land factor in EU agriculture.
It is also interesting when we take into account the fact that aggregation B included most of the regions from the EU-12 countries, as well as all the regions of Spain, Italy, and Greece, and Croatia, and aggregation C comprised regions from the EU-15 countries.The results of the analysis therefore confirm higher efficiency of the agriculture of the EU-12 countries, Spain, Italy, Greece, and Croatia than that of the EU-15 countries The only exception in this respect included the following regions of Germany: Brandenburg, Mecklenburg-Vorpommern, Sachsen, Sachsen-Anhalt, Thueringen, as well as the Czech Republic and Slovakia, which compared to the other EU regions, had the highest indicators of the efficiency of dairy cow breeding and higher indicators of the efficiency of grazing livestock breeding and mixed (multidirectional) production than in other EU-15 regions. In general, in the literature, it is emphasised that subventions have a negative impact on technical efficiency (cf. e.g., Giannakas et al. (Citation2001), Hadley (Citation2006), Bojnec and Latruffe (Citation2009), Bakucs et al. (Citation2010)), which results from the decrease in the efforts of the relatively more supported farms to decrease the value of inputs used or increase the production output (through technical or technological progress or the use of economies of scale). The research results do not confirm these views, as in the years 2005–2015 in the EU-12 countries, the average support of agricultural income was 43% higher than in the EU-15 countries (EUFADN 2017). However, we should bear in mind that higher subventions from agricultural policy in the EU-12 countries could translate into a relatively higher production output relative to the input involved than in the EU-15 countries –which would explain these contradictions and would refer to the issue of taking advantage of political rent by farmers in the EU-12 countries to a larger extent than in the EU-15 countries (see Bezat-Jarzębowska, Rembisz 2013). In accordance with the FADN methodology, agricultural income is calculated by adding the balance of subsidies and taxes on investments to the net value added and subtracting the cost of external factors (Floriańczyk et al. Citation2014, Dudu and Kristkova Citation2017, Czyżewski, Guth and Matuszczak Citation2018). It should be remembered here that only the increase in labour productivity causes a permanent increase of technical efficiency. This is also confirmed by the research of Yee et al. (Citation2004), in which it was shown that public investments in research and development positively impact technical efficiency. Bernstein and Mamuneas (Citation2008) state that such investments contribute to increasing TFP, acting as a substitute for technological changes. This is also in keeping with the views of Rembisz and Waszkowski (Citation2017, pp. 211 and 212), who claim that an increase in the involvement of the physical capital factor as a result of certain investments (motivational factor) has been the most tangible endogenous basis for growth in agriculture to date. Also desirable is a situation in which an increase in labour productivity is reflected in an increase in the remuneration of this factor. Accordingly, it should be noted that only support from the agricultural policy, addressed and oriented towards an increase in labour productivity, will lead to permanent higher technical efficiency of the same directions of production, as this will stimulate technical progress. In view of what was also said here, it will enable an increase in the remuneration of the labour factor. This also means that it is the quality, not the quantity of the labour factor that is of fundamental significance for the efficiency relationship. In our research, we only used the quantitative approach to the labour factor. In further analyses, it would therefore be a good idea to present the qualitative aspect.
5. Conclusions
Resource-related determinants, understood as the supplies of the traditional factors of production, i.e., land – particularly important in agriculture, capital, and labour, condition the efficiency of production. The supplies of production factors also play an important role in agricultural production, which is in keeping with the producer’s objective function, which is the maximisation of profit, and in the case of farmers – of agricultural income. This statement is universal and timeless, regardless of the form of the production function and the sector of the economy. The article shows that in the case of agriculture, there are significant differences in the supplies of the production factors between individual regions of the EU. Three aggregations of EU regions can be distinguished, significantly different in terms of agriculture’s supplies of these factors. It was shown that the groups of EU regions significantly differing in terms of factor endowment differ also in terms of the technical efficiency of the same types of agricultural production. The higher the agriculture’s supplies of resources, the higher the efficiency of dairy cow breeding and mixed (multidirectional) type of agricultural production. In the types of agricultural production such as: crop production, horticulture, wine growing, permanent crops, and granivores, no such tendency was demonstrated. Research therefore proved that agriculture’s supplies of land, capital, and labour do impact the efficiency of milk production and multidirectional type of agricultural production in the EU. Therefore it can be concluded that the differences in efficiency of particular types of agricultural production (except for milk and multidirectional production) in both types of farming – small and large scale – are not statically significant, which should be noted while forming the next CAP financial perspectives and giving the chances for development of both by forming vast lists of possible, dedicated income supporting instruments. This may be accomplished by maintaining the path of sustainable development of EU agriculture, focusing not only on the economic rationality, but also remuneration of supplying social and environmental public goods generated in agriculture. In further analyses, an attempt should be made at answering the question of whether the heterogeneity of the resource-related determinants of the EU’s agriculture and the efficiency of agricultural production found in the research, is reflected in the prices of agricultural products and whether this dependency also occurred in other periods and groups other than the EU. This would enable us to conclude that it is permanent and universal.
Related Research Data
References
- Bakucs, L. Z., Latruffe, L., Fertő, I., & Fogarasi, J. (2010). Impact of EU accession on farms technical efficiency in Hungary. Post-Communist Economies, 22(2), 165–175. doi:10.1080/14631371003740639
- Bernstein, J., & Mamuneas, T. (2008). Public infrastructure, input efficiency and productivity growth in the Canadian food processing industry. Journal of Productivity Analysis, 29(1), 1–13.
- Beugeldsijk, S., Klasing, M., & Milionis P. (2018). Regional economic development in Europe: The role of total factor productivity. Regional Studies, 52(4), 461–476. doi:10.1080/00343404.2017.1334118
- Bezat-Jarzębowska, A., Rembisz, W., & Sielska, A. (2012). Wybrane postacie analityczne funkcji produkcji w ocenie relacji czynnik-czynnik oraz czynnik-produkt dla gospodarstw rolnych FADN [Selected analytical forms of the production function in the assessment of factor-factor and factor-product relationship for FADN farms]. IERiGŻ, Warszawa, 4, 213.
- Bezat, A., & Rembisz, W. (2011). Zastosowanie funkcji typu Cobba-Douglasa w ocenie relacji czynnik-produkt w produkcji rolnej [Application of the Cobb-Douglas type function in the assessment of the factor-product relationship in agricultural production], IERiGŻ, Warszawa, 1–23.
- Bezat-Jarzębowska, A., & Rembisz, W. (2017). Wprowadzenie do analizy inwestycji, produktywności, efektywności i zmian technicznych w rolnictwie [Introduction to the analysis of investment, productivity, efficiency and technical changes in agriculture], IERiGŻ-PIB, Warszawa.
- Błażejczyk-Majka, L., Kala, R., & Maciejewski, K. (2011). Productivity and efficiency of large and small field crop farms and mixed farms of the old and new EU regions. Agricultural Economics, 58(2), 61–71.
- Bojnec, Š., & Latruffe, L. (2009). Determinants of Technical Efficiency of Slovenian Farms. Post-Communist Economies, 21(1), 117–124. doi:10.1080/14631370802663737
- Bojnec, Š., Fertő, I., Jámbor, A., & Tóth, J. (2014). Determinants of technical efficiency in agriculture in new EU member states from Central and Eastern Europe. Acta Oeconomica 64(2), 197–217. doi:10.1556/AOecon.64.2014.2.4
- Carroll, J., Greene, S., O‟Donoghue, C., Newman, C., & Thorne, F. (2009). Productivity and the Determinants of Efficiency in Irish Agriculture (1996-2006), paper presented at the 83rd AES Conference, Dublin, Ireland, 30 March-1 April.
- Coelli, T., Prasada Rao, D., O’Donnell, C., & Battese, G. (2005). An Introduction to Efficiency and Productivity Analysis. Second Edition, Springer, New York.
- Charnes, A., Cooper, W., & Rhodes, E. (1978). Measuring efficiency of decision-making units. European Journal of Operational Research, 2(6), 429–444. doi:10.1016/0377-2217(78)90138-8
- Charnes, A., Cooper, W., Lewin, A., & Seiford, L. (Eds.) (1994). Data envelopment analysis: Theory, methodology and applications. Boston, MA: Kluwer Academic.
- Cooper, W., Seiford, L., & Tone, K. (2007). Data envelopment analysis. A comprehensive text with models, applications, references and DEA-Solver Software. New York: Springer.
- Cvetkoska, V., & Savić, G. (2017). Efficiency of bank branches: empirical evidence from a two-phase research approach. Economic Research - Ekonomska Istraźivanja, 30(1), 318–333. doi:10.1080/1331677X.2017.1305775
- Czyżewski, B., Guth, M., & Matuszczak, A. (2018). The Impact of the CAP Green Programmes on Farm Productivity and its Social Contribution. Problemy Ekorozwoju – Problems of Sustainable Development, 13, no (1), 173–183.
- Dudu, H., & Kristkova, Z. (2017). Impact of CAP Pillar II Payments on Agricultural Productivity. Luxembourg: EUR 28589 EN, Publications Office of the European Union. ISBN 978-92-79-68723-5, JRC106591 doi:10.2760/802100,
- Floriańczyk, Z., Mańko, S., Osuch, D., & Płonka, R. (2014). Wyniki Standardowe 2013 uzyskane przez gospodarstwa rolne uczestniczące w Polskim FADN Część I [Standard Results 2013 obtained by agricultural holdings participating in the Polish FADN Part I|]. Wyniki Standardowe, Warszawa: IERiGŻ-PIB.
- Giannakas, K., Schoney, R., & Tzouvelekas, V. (2001). Technical efficiency, technological change and output growth of wheat farms in Saskatchewan. Canadian Journal of Agricultural Economics/Revue Canadienne d&Apos;Agroeconomie, 49(2), 135–152. Vol. doi:10.1111/j.1744-7976.2001.tb00295.x
- Gorton, M., & Davidova, S. (2004). Farm Productivity and Efficiency in the CEE Applicant Countries: A Synthesis of Results. Agricultural Economics, 30(1), 1–16. doi:10.1111/j.1574-0862.2004.tb00172.x
- Hadley, D. (2006). Efficiency and Productivity at the Farm Level in England and Wales 1982 to (2002), Report for the Department for Environment, Food and Rural Affairs (DEFRA), London, UK, March.
- Hallam, D., & Machado, D. (1996). Efficiency analysis with panel data: A study of Portuguese dairy farms. European Review of Agricultural Economics, 23(1), 79–93. doi:10.1093/erae/23.1.79
- Kunasz, M. (2006). Zasoby przedsiȩbiorstwa w teorii ekonomii [Enterprise resources in economic theory]. Gospodarka Narodowa, 10, 33–48.
- Lambarra, F., Stefanou, S., Sarra, T., & Gil, J. (2009). The impact of the 1999 CAP reforms on the efficiency of the COP sector in Spain. Agricultural Economics, 40, 355–364. doi:10.1111/j.1574-0862.2009.00378.x
- Latruffe, L., Balcombe, K., Davidova, S., & Zawalinska, K. (2004). Determinants of technical efficiency of crop and livestock farms in Poland. Applied Economics, 36(12), 1255–1263. doi:10.1080/0003684042000176793
- Latruffe, L., Davidova, S., & Balcombe, K. (2008). Application of a double bootstrap to the investigation of determinants of technical efficiency of farms in Central Europe. Journal of Productivity Analysis, 29(2), 183–191. Vol. No. doi:10.1007/s11123-007-0074-2
- Latruffe, L., Guyomard, H., & Le Mouël, C. (2009). The role of public subsidies on farms’ managerial efficiency: An application of a five-stage approach to France, Working Paper SMART-LERECO No. 09-05, Rennes, France.
- Latruffe, L. (2010). Competitiveness, Productivity and Efficiency in the Agricultural and Agri-Food Sectors. OECD Food, Agriculture and Fisheries Working Papers, 30, 18–63.
- Lissitsa, A., Rungsuriyawiboon, S., & Parkhomenko, S. (2007). How Far are the Transition Countries from the Economic Standards of the European Union? Measuring Efficiency and Growth in Agriculture. Eastern European Economics, 45(3), 51–75. doi:10.2753/EEE0012-8775450303
- Majchrzak, A. (2015). Ziemia rolnicza w krajach Unii Europejskiej w warunkach ewolucji wspólnej polityki rolnej [Agricultural land in the European Union countries in the conditions of Common Agricultural Policy evolution], Wydawnictwo Naukowe PWN, Warszawa
- Munroe, D. (2001). Economic efficiency in Polish peasant farming: An international perspective. Regional Studies, 35(5), 461–471. doi:10.1080/00343400123499
- Nivievskyi, O., & von Cramon-Taubadel, S. (2008). The Determinants of Dairy Farming Competitiveness in Ukraine, paper presented at the 12th EAAE Congress, Gent.
- Rembisz, W., & Sielska, A. (2012). Mikroekonomiczna funkcja produkcji – właściwości analityczne wybranych jej postaci [Microeconomic production function - analytical properties of selected forms], Warszawa, IERiGŻ-PIB, 22–166.
- Rembisz, W., & Waszkowski, A. (2017). Czynnik kapitału jako endogeniczne źródło wzrostu w rolnictwie [The capital factor as an endogenous source of growth in agriculture], Scientific Journal Warsaw University of Life Sciences. Problems of World Agriculture, 17(XXXII), 211–223. Z2,
- Rios, A., & Shively, G. (2006). Farm size and nonparametric efficiency measurements for coffee farms in Vietnam. Forests, Trees, and Livelihoods, 16(4), 397–412. Vol. doi:10.1080/14728028.2006.9752575
- Rusielik, R., & Prochowicz, J. (2007). Porównanie efektywności skali produkcji mleka w wybranych gospodarstwach Europy w 2005 roku, Roczniki Nauk Rolniczych. Issue Seria G T94, 1, 29–34.
- Prochowicz, J., & Rusielik, R. (2007). Relative efficiency of oilseed crops production in the selected farms in Europe and the world in 2005. Acta Scientiarum Polonorum, Oeconomia, 6(4), 57–62.
- Rusielik, R., & Świtłyk, M. (2012). Efektywność techniczna produkcji mleka w wybranych europejskich gospodarstwach w latach 2008–2010 [Technical efficiency of milk production in chosen European farms in 2008-2010]. Roczniki Nauk Rolniczych, Seria G, 99(1), 88–99.
- Rusielik, R. (2013). Efektywność techniczna produkcji mleka w gospodarstwach Europejskiego Stowarzyszenia Producentów Mleka w 2011 roku [Technical efficiency of milk production in EDF farms in 2011]. Roczniki Naukowe Stowarzyszenia Ekonomistów Rolnictwa i Agrobiznesu, 2(15), 57–62.
- Swinnen, J. (2009). Reforms, Globalization, and Endogenous Agricultural Structures. Agricultural Economics, 40(1), 719–732. doi:10.1111/j.1574-0862.2009.00410.x
- Tonsor, G., & Featherstone, A. (2009). Production efficiency of specialized swine producers. Review of Agricultural Economics, 31(3), 493–510. doi:10.1111/j.1467-9353.2009.01450.x
- Yee, J., Ahearn, M., & Huffman, W. (2004). Links among farm productivity, off-farm work, and farm size in the Southeast. Journal of Agricultural and Applied Economics, 36(03), 591–603. VolNo.doi:10.1017/S1074070800026882
- Zhu, X., Demeter, R., & Oude Lansink, A. (2008a). Competitiveness of Dairy Farms in Three Countries: The Role of CAP Subsidies, Paper presented at the 12th EAAE Congress, Gent, Belgium.
- Zhu, X., Karagiannis, G., & Oude Lansink, A. (2008b). Analyzing the Impact of Direct Subsidies on the Performance of the Greek Olive Farms with a Non-Monotonic Efficiency Effects Model, paper presented at the 12th EAAE Congress, Gent, Belgium.