
 ?Mathematical formulae have been encoded as MathML and are displayed in this HTML version using MathJax in order to improve their display. Uncheck the box to turn MathJax off. This feature requires Javascript. Click on a formula to zoom.
Abstract
Scholars and policymakers agree that early-stage venture capital is the most important element of innovation pipeline in the health care industry. However, securing the financing at the very beginning of innovation pathway in health care is challenging and relies on an in-depth understanding of investment strategies implemented by venture capitalists. In turn, this requires us to take a broader look at global trends in early-stage venture capital funding of health care oriented life-science projects. Referred to the above, this article aims to provide the outlook for early-stage venture capital investment in Europe and provide its benchmarking performance analysis. Using data on early-stage venture investments in health care-related life-science projects, we present its long-term dynamics and analyse current trends. Additionally, we check whether investment decisions are motivated by the short-term return opportunities or they are made as a part of long-term strategy. We find that Europe, with uneven and volatile financings, is still lagging behind the investment levels of the U.S. Our findings also support the cautionary behaviour of investors and their awareness towards the highly volatile nature of short-term returns.
Keywords:
Introduction
For many years health care has been the largest sector in many developed and developing economies. It is also one of the most rapidly changing, being the arena for dramatic achievements and failures, a continuous battlefield for resources in times of disruptive technology. It is precisely this technological progress that is the key factor that not only transforms and redefines the practice of medicine, but profoundly redesigns its economic and social dimensions. Indeed, many new medicines, devices or medical services seem to be extremely promising in eradicating illnesses and/or raising quality of life for sick patients, but their potential is frequently dimmed by insufficient financial resources of health providers, leading frequently to systemic inefficiencies.
There are still important obstacles on the road towards a healthier population. For instance, it might be the case that a new molecule, after being discovered and successfully tested in clinical trials, becomes available on the market, but the manufacturer’s asking price is beyond the reach of patients or the reimbursement capacity of health care system payer (DiMasi, Feldman, Seckler, & Wilson, Citation2010). As a result, it is impossible for patients to get access to the treatment. This situation is also extremely harmful for a drug developer, who finds himself in a difficult situation of not being able to cover his R&D expenses and, eventually, make him slow down or stop innovation efforts altogether.
This situation is unfortunately a very frequent one. The good news is, however, that the solution to the problem lies in creating the highest value from available resources, which consists on raising health outcomes while decreasing costs of care.
This is precisely what both scholars and policymakers agree on: raising economically sustainable health outcomes is only possible when there is sufficient innovation. Clearly, fuelling the innovation pipeline has become a priority in many countries. It must be remembered, however, that innovation processes in health care industry require substantial investments in terms of resources and time.Footnote1 Moreover, transforming knowledge into innovative medical devices, services, or identifying the promising active molecule of a future drug, is a risky endeavour, since the entire innovation process in health care displays high levels of uncertainty.Footnote2 Therefore, maintaining the levels of innovation supposed to improve health outcomes remains challenging and somehow fragile.
For many years now, the global health care industry has been confronted to some important adverse phenomena that might potentially slower its innovation dynamics. First, spending on health-related R&D in Europe, both public and private, is lagging behind the financing levels of the U.S. (Politico, Citation2015). Second, the pharmaceutical sector, which has always been the leader and main development driver of the health care industry, has witnessed the decline in economic returns from new drugs (Berndt, Nass, Kleinrock, and Aitken, Citation2015). Finally, for the last five years, there has been a pronounced decline in the amount of venture capital engaged in the early development stages of the life cycles of health care-related products (Fleming, Citation2015).
Having in mind the current industrial organisation of innovation in health care,Footnote3 securing the finance at the very beginning of the innovation pathway in health care is challenging and requires an in-depth understanding of investment strategies implemented by venture capitalists. In turn, this creates an urgent need to take a broader look at global trends in early-stage venture capital funding of health care-oriented life-science projects.
This article aims to provide the outlook for early-stage venture capital investment in Europe. There is a double rationale for it: first, most literature investigating this topic focuses on the U.S.; second, we wish to test empirically whether data support claims on the decline of financing for early-stage innovation efforts in life sciences in Europe.
This article is organised as follows. The first section analyses the trends in V.C.-backed funding of European companies operating within technology and life sciences related to health. It presents the related V.C. investment activities in the perspective of last decade. In the subsequent section, we describe how European companies perform in attracting V.C. compared to other regions. Finally, we check whether investors’ decision towards allocation of funds have a short-term, speculative character, or whether they are motivated by long-term expectations regarding the performance of highly innovative companies within the health care sector. In the final section we present concluding remarks and some policy recommendations, which are discussed in the light of existing debates on the issue.
V.C. Dynamics: material and methods
We began our analysis by describing the relative position of the health care sector in overall V.C. financing flows. This first comparison turned out to be the most difficult one, since there are no standard international definitions of either venture capital or venture capital by development stage. Moreover, the methodology of data collection differs across countries and sectoral views vary across commercial data providers. In order to partly overcome these difficulties, for international sectoral comparison, we decided to explore the O.E.C.D. data (O.E.C.D. Entrepreneurship Financing Database). The organisation collects and provides information on V.C. streams for Europe and the U.S. for three industrial sectors, namely: I.C.T., Life sciences and Industrial/Energy. Therefore, health care falls within Life Science category. By analysing the V.C. data over the last decade, we may conclude that the venture capital investment gap widened between the U.S. and Europe in all sectors. Moreover, in 2016, the American I.C.T. sector received more than half of the total V.C. investments (53.6%), followed by life sciences (20.7%). In Europe, the I.C.T. sector attracted almost 45% of total V.C. funds (44% of the total), whereas life sciences sector received 27%. This situation is depicted in :
Figure 1. Venture Capital investments by sector (the U.S. versus Europe, US$ millions).
Source: Own calculation based on O.E.C.D. data.
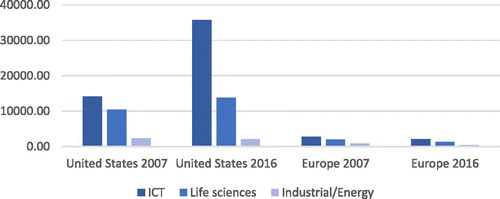
The O.E.C.D. sectoral analysis is supported by recent analyses from consulting firms (P.W.C., 2018; KPMG, Citation2017). According to their findings, financing of pharma and biotechnology sectors are booming in Europe; for the sole fourth quarter of 2017, companies from those sectors attracted more than US$300 million.
At this time, it is important to recall that V.C. dynamics were strongly affected by the financial crisis of 2007–2009. Block, De Vries, and Sandner (Citation2010) provide the evidence of this adverse phenomena for a series of countries (Europe and the U.S.) and across industries. In general, the global financial crisis led to a decrease in the number of funding rounds, at first hitting funding more severely than in later rounds. Additionally, the amount raised per funding round decreased, significantly impacting sectors such as I.T./Internet and health care. However, the crisis did not have a significant impact on the biotechnology sector.
As a further step, while exploring Thomson-Reuters E.I.K.O.N. platform, we have identified the flows of early stage V.C. funding (seed and/or series A funds) to European companies operating within health care industry. E.I.K.O.N. data include a detailed tagging for all subsectors, and thus we had possibility to select all companies having their main activity within life-science and technology with relation to health care). The annual streams of investments since 2007 are depicted in :
Figure 2. Seed/Series A V.C. Flows to European companies operating within health care industry (US$ millions, Q1 2007–Q3 2017).
Source: Authors’ compilation based on Thomson-Reuters data.
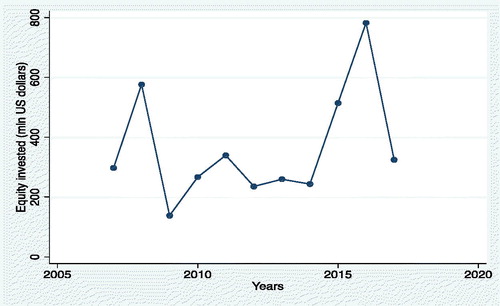
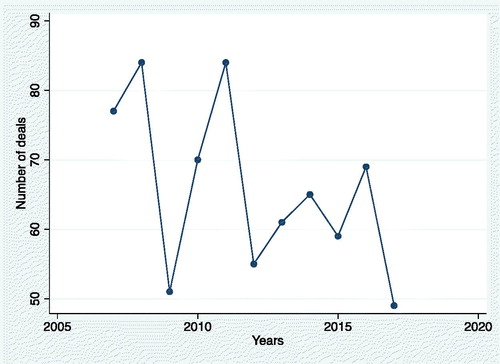
In 2007, nearly US$300 million was invested; the historical low was observed in 2009 with only US$138 million allocated to European firms, which roughly constitutes 25% of funding in the record year of 2016. Since 2007, US$3.8 billion has been raised in Europe. These funds have been split over 724 deals (). While comparing the annual dynamics, deal numbers were uneven, ranging from 49 in 2009 to 84 in 2016, with the mean deal value of US$5.5 million.Footnote4
Figure 3. Number of deals (Q1 2007–Q3 2017).
Source: Authors’ compilation based on Thomson-Reuters data.
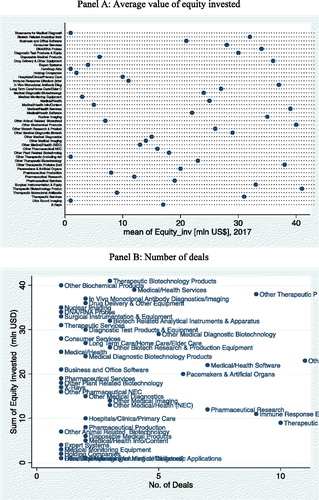
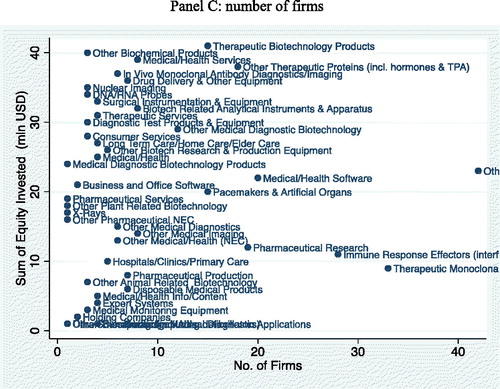
When controlling for subsectors in the health care industry, since 2008 there has been a pronounced increase in the variety of health care businesses in the eye of investors: at the beginning of the analysed period, investors were attracted only by eight activities (led by DNA/RNA Probes), while in 2017, funding streams were dispersed across 44 subsectors. In we present the recent level of funding across health care industry branches. The highest amounts were allocated to firms offering biotechnology products, while companies supplying health services have attracted less attention from investors (panel A). Moreover, the majority of deals were concluded in less than five deals in most sectors, and this regardless of equity invested (panel B). Finally, in most cases, up to 20 companies received financing in each subsector (with an average number of 7, as depicted in panel C).
Figure 4. Seed/Series A V.C. Flows to European companies by health care industry subsectors (US$ millions, 2017).
Panel A: Average value of equity invested
Panel B: Number of deals
Panel C: number of firms
Source: Authors’ compilation based on Thomson-Reuters data
The accumulation of V.C. funds in health care subsectors since 2007 is presented in .
Figure 5. V.C. by health care subsector in Europe (value of investments, 2007–2017).
Source: Authors’ compilation based on C.B. Insights data.
Bricks are scaled to reflect the relative position of a subsector in attracting V.C. investments. Color shades reflect the value of deals, while the bricks’ size represent the quantity of deals.
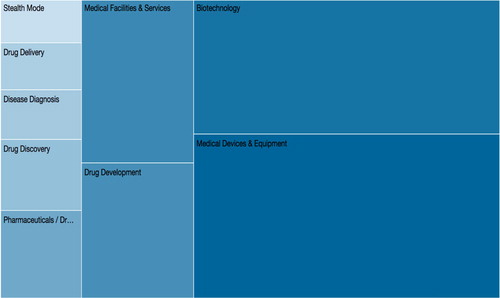
As depicted in , in terms of value since 2007, companies developing medical devices and equipmentFootnote5 have received the most attention (US$49.48 billion), followed by biotech firms (US$40.84 billion). In turn, companies focused on drug development collected assets of US$24.58 billion.
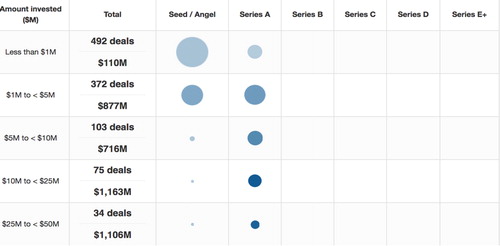
In order to investigate simultaneously the structure of deals by investment stage and value range, we have analysed the C.B. Insights data from 2009 to 2017. Fifty-seven per cent of deals were provided as seed investment and the majority of these vital fund injections had value of less than US$5 million ().
Figure 6. Value of V.C. flows (deals and stages (Q1 2009–Q3 2017).
Source: Authors’ compilation based on C.B. Insights data.
The geographical concentration of V.C. funding is clearly visible on the health care industry heat-map ().
Figure 7. Destination of V.C. flows in relation to health care (value of investments, Q1 2009–Q3 2017).
Source: Authors’ compilation based on C.B. Insights data.
Bricks are scaled to reflect the relative position of a country in attracting V.C. investments. Color shades reflect the value of deals, while the bricks’ size represent the quantity of deals.

Companies from North America, dominated by the U.S. since 2007, have received more than a half of total funds, valued at US$500 billion.
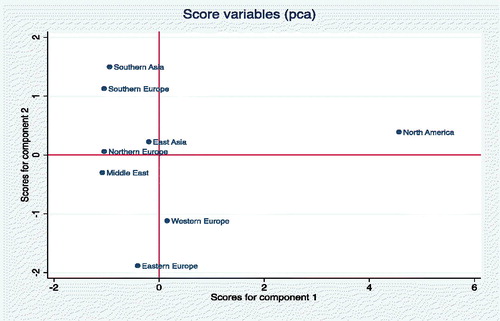
Applying factor analysis on the global data on early stage V.C. financing in the health care sector supports the leading position of the U.S. Specifically, since we have information on deals (including the number of deals and their values), as well as on location of investment destination (regional split), the factorisation procedure is possible. The resulting bi-dimensional performance of regions is presented in , where North America largely outperforms all remaining regions in terms of accumulated equity and number of deals.Footnote6
Figure 8. Factor analysis of V.C. flows in relation to health care.
Source: Authors’ own elaboration
In Europe, U.K.-based companies attract the most of funding (US$74.7 billion), followed by firms originated in Germany and France (). There are only few companies in Central and Eastern Europe backed by V.C.
Figure 9. Recipients of V.C. funds in Europe (in value, 2008–2017).
Source: Authors’ compilation based on C.B. Insights data.
Bricks are scaled to reflect the relative position of a country in attracting V.C. investments. Colour shades reflect the value of deals, while the bricks’ size represent the quantity of deals.

The specific territorial attractiveness for V.C. funds can be attributable to the market size and profitability conditions. More specifically, it is without surprise that the U.S. takes the pole position: in this country, the intensity of V.C. capital measured as a percentage of G.D.P. has been relatively stable over time, reaching 0.14 for early stage investments and 0.22 for late fundraising in 2016 (OECD, Citation2017). The values of this indicator are more than halved for Europe: the European leader – the U.K. – in 2017 had the highest share of venture capital investments as a percentage of G.D.P. of any European country at 0.08%. Only Sweden, France and Finland had a share of venture capital as a percentage of G.D.P. that was also over 0.05% (Invest Europe, Citation2017). Moreover, if we consider the trends in earnings from capital investment in health care industry, the U.S. and the U.K. display the highest rate of return from the investments, especially in health care technology and medical equipment (annual average E.B.I.T.D.A. were of 15–20% over the last decade in these countries). However, the return on investment was dramatically low and uneven for biotech and pharmaceutical subsectors: this finding supports the view that in pharmaceutical subsectors earnings are particularly uncertain considering the length time for the products to enter the market (and to exit from the deals by V.C. investors). The poor performance of the pharmaceutical sector in attracting V.C. can be mainly attributed to the characteristics of regulatory environment. Clearly, when comparing review times for new drugs approved by the U.S. Food and Drug Administration (F.D.A.) and the European Medicines Agency, it appears that drugs were approved more quickly in the U.S. with the median difference in approval time of 77 days (Downing, Zhang, and Ross, Citation2017). Therefore, the American Agency moves faster, shortening the regulatory cycle, thus making it more attractive for investors.
We have also identified the top 10 investors providing seed capital to European companies within the health care sector (). The benchmark is made upon the value of seed capital allocated the over the period 2013–2017.
Table 1. The most active V.C. fund providers in Europe.
Among the most active seed fund providers we can observe the heterogeneity of profiles. For instance, the leading investor in our sample (High-Tech Grunderfonds) is Germany's most active seed stage investor. The firm, however, does not focus solely on health care firms. It also finances technology-driven companies operating in the fields of robotics, cleantech or software. On the other hand, pharma moguls are seizing opportunities among young biotech companies with help of their corporate venture arms. This is precisely the case of Merc Ventures or Boehringer Ingelheim Ventures; these entities invest wisely in firms whose innovativeness may speed-up the R&D of their core activities. Their goal is also to create the spin-offs and thus leverage on synergies. Usually, these investors allocate the initial capital of up to US$2 million per venture, with subsequent staged investments made to align with each venture's progress, up to a total of US$10–15 million per venture over its life.Footnote7 Finally, we may notice the presence of public institutions, such as Banque Publique d'Investissement (B.P.I. France), whose mission is to support small and medium innovative enterprises in a wide array of sectors in France. The active participation of public institutions supports the view of ‘patient capital’, that takes risks by providing necessary capital injections to new entrepreneurial endeavours, and displays long-term financial commitment to firms, and therefore lower risk of early divestments (Lazonick and Mazzucato, Citation2013). Furthermore, Corporate Venture Capital starts to play an important role in V.C. ecosystems as it creates the new source of capital for financing health care innovation. According to the C.B. Insights data, C.V.C. activities in the health care industry have reached an all-time record in 2017, which corresponds to US$6.2 billion, with 218 deals, compared to 2016 when it reached US$4.9 billion with a total of 187 deals. It is also important to notice that the growing number of C.V.C.’s have engage at the seed stage (243 deals in 2017 compared to 168 deals in 2016); this implies that corporations are becoming aware of the importance of having an ‘early seat’ on the value creation chain in innovative companies.
Finally, it is worth mentioning that the success of the venture capital fundraising is dependent on earlier successful divestments. The exit opportunity is a key part of the venture capital cycle and allows the quantitative assessments of venture capital firms’ performance (Schwienbacher Citation2008). As far as the health care industry is concerned, by 2017, they accounted for 26% of overall global cross-industry divestments and reached US$6.7 billion. Moreover, substantial differences between the U.S. and Europe have been noticed. Divestment processes move faster in the U.S. than in Europe, and differ mainly with respect to exit stage, the use of convertible securities, the replacement of former management and deal syndication.
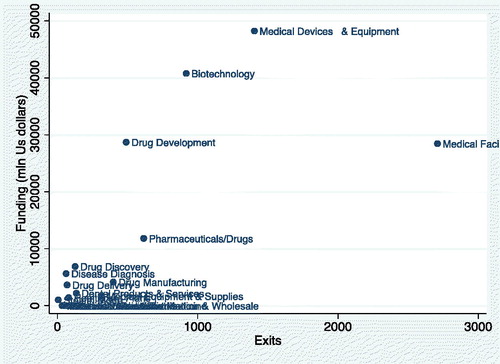
The exit strategies in European health care industry are presented in . Over the last decade, five subsectors have stood out from other subsectors by the amount of funding and a number of divestments, namely: Medical Devices & Equipment, Biotechnology, Medical Facilities & Services and Pharmaceuticals/Drugs.
Figure 10. European health care exits.
Source: Authors’ own elaboration based on C.B. Insights data.
Determinants of investment
In the literature, authors usually distinguish four main groups of factors that can possibly determine the V.C. investment. First, there are V.C. firm-related factors, such as experience, specialization and reputation; Second, there are factors related to investor’s portfolio preferences, such as industry, development stage or geographic proximity. Another group is composed of market factors, such as macroeconomic environment and regulatory schemes. Finally, there are factors associated directly with V.C. contracting and rights.
Independently of these factors, the logic of V.C. is the following one: capital providers invest in a specific company only when the potential return on investment is sufficient compared to the investment risk. Moreover, investing in early life cycle stage of a company is a risky endeavour, since the chances for a successful exit are low. Accordingly, the V.C. investor requires more return from ‘young’ firms compared to mature companies. Reiner (Citation2013) provides a comprehensive review of I.R.R. from V.C. investments since the first empirical study on V.C. returns of Chiampou and Kallett (Citation1989). According to this long-term performance benchmark, the average I.R.R. of V.C. is 11.5%.
In this article, we take another direction: we relate the streams of quarterly ‘early’ V.C. financings in the European health care sector to the equity returns metric. The idea is to check whether V.C. investors’ decisions are driven by the opportunities of short-term profits or maybe they privilege long-term investment strategy eventually leading to buyouts and spin-offs eliminating high risk levels in the short horizon.
In order to verify the above-mentioned hypothesis, we propose the following model:
(1)
(1)
where lVCt denotes current stocks of V.C. investment (in logarithm) and PE_VC measures current and past returns from investmentsFootnote8. In case investors have a long-term strategy, we expect coefficients on equity return to be statistically insignificant.
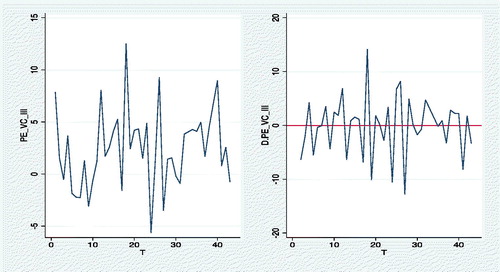
Using data from Thomson-Reuters E.I.K.O.N., we have compiled data sample with quarterly V.C. investments (Q1 2007–Q2 2017) and added quarterly information on returns from V.C. financing provided by Cambridge Associates. This metric is a composite performance indexFootnote9 frequently used for benchmarking P.E./V.C. performance. It is important to notice, the levels of returns are characterised by substantial variance and display high volatility over time, as depicted in .
Figure 11. Quarterly returns on P.E./V.C. and its volatility (in %).
Source: Authors’ elaboration based on Cambridge Associates data.
Since we have confirmed a stationarity of time series, the consistent ordinary least squares estimates of (1) are presented in .
Table 2. Estimation results.
Dependent variable: l_E_inv
The coefficient on return displays a limited significance and also rather unattended, negative sign. It might be the case that V.C. investors pay attention to short-term benefits but, at the same time, they remain sensitive to the cyclical nature of returns and therefore, their decisions are based on internalising the ex post risks.
Conclusion
In the light of our analysis, it is difficult to detect a clear pattern in early stage V.C. financings of European companies within the health care sector. Since 2007, the flows have been uneven, characterised by high volatility. Moreover, the number of deals varies greatly over time. Companies that managed to raise the most of capital are located in the U.K., Germany and France. Sadly, there are only few firms that succeed in raising V.C. in Central and Eastern Europe. At the same time, the low levels of V.C. invested in Europe can be partly explained by the high volatility and thus uncertainty of returns. It must be remembered, however, that health care industry returns in long-term perspective, outperformed all remaining sectors, including financials and consumer goods (both P.E. favourites). From this perspective, scepticism of V.C. to invest in the health care sector remains much of a puzzle.
In terms of both value and deals, Europe is lagging behind the funding levels of the U.S.
In policy language, this means that Europe can miss the opportunities of biotechnology and pharma revolution and may not be able to positively impact people’s health. Clearly, in the situation of insufficient private financing, Europe should increase the level of public financial support to help promising companies innovate. The fuelling of the innovation pipeline should include, among others: supporting small companies with necessary financing for early-stage periods (and thus substitute the missing venture-capital streams), lowering regulatory uncertainties by creating fast Health Technology Assessment mechanism and providing financial support for expensive clinical trials. Already, some positive signs are visible. European Union, through grants and other financial schemes, is allocating substantial resources to projects of high societal value, especially in the area of public health. Many small companies providing innovative technologies in genomics or big data are being injected with necessary funds, and frequently participate in advancing science within health care-oriented alliances or public–private partnerships.
Disclosure Statement
No potential conflict of interest was reported by the author.
Notes
1 In the health care industry, it takes, on average, 12 years from conception to market lunch, compared to five years in automotive industry and seven in commercial aircraft manufacturing; the development of a new drug requires on average US$2.6 billion (Deloitte, Citation2014).
2 Firms operating within the health care sector spend the highest proportion of their revenue on R&D compared to other technology-intense sectors (Janssen Health Policy Center, Citation2015).
3 Literature acknowledges the rise of cooperative activities within health care industry, starting with R&D alliances or joint-ventures in biotechnology and pharma sectors, up to creation or extending the markets for innovative medical devices, procedures or services. In the end, innovative activities, from being 100% in-house, have shifted towards a heterogeneity of organisational form based on pooled resources, combining efforts of industry moguls and specialised start-ups. A comprehensive study on this topic can be found in Baker, Gibbons, & Murphy (Citation2008) and Lazonick and Tulum (Citation2011).
4 Median value is US$4.25 million.
5 The Medical devices and equipment category embraces surgical devices, imaging and diagnostic equipment, therapeutic devices, and patient monitoring.
6 Factor 1 (component 1) is built on the following variables: number and value of deals and number of companies that received V.C. investment; factor 2 (component 2) represent the total value of equity invested.
7 This supports the recent findings of Lehoux et. al. (2016)
8 The choice of log-level model has been confirmed by histograms. Lags have been determined with autocorrelation matrix.
9 P.E./V.C. Impact Investing Fund Size ≤ US$100 million: Fund Index Details: One Quarter Horizon Pooled Return. This index is ‘a horizon calculation based on data compiled from 43 private equity and venture capital funds, including fully liquidated partnerships, formed between 1998 and 2014. All returns are net of fees, expenses, and carried interest. Historic quarterly returns are updated in each year-end report to adjust for changes in the index sample’ (Cambridge Associates Citation2017: PE/VC Impact Investing Index & Benchmark Statistics, available at: https://www.cambridgeassociates.com/benchmarks/ accessed 20 November 2017).
Related Research Data
References
- Baker, G. P., Gibbons, R., & Murphy, K. J. (2008). Strategic alliances: Bridges between “islands of conscious power”. Journal of Japanese and International Economies, 22(2), 146–163. doi:10.1016/j.jjie.2008.03.001
- Berndt, E. R., Nass, D., Kleinrock, M., & Aitken, M. (2015). Decline in economic returns from new drugs raises questions about sustaining innovations. Health Affairs, 34(2), 245–252. doi:10.1377/hlthaff.2014.1029
- Block, J., De Vries, G., & Sandner, P. (2010). Venture capital and the financial crisis: An empirical study across industries and countries. In D. Cumming (Ed.), The oxford handbook of venture capital (pp. 37–61). Oxford University Press.
- Cambridge Associates (2017). PE/VC impact investing index & benchmark statistics. Retrieved from https://www.cambridgeassociates.com/benchmarks/ (accessed on November 20, 2017).
- Chiampou, G. F., & Kallett, G. F. (1989). Risk/return profile of venture capital. Journal of Business Venturing, 4(1), 1–10. doi:10.1016/0883-9026(89)90030-X
- Deloitte, L. L. P. (2014). Measuring the return from pharmaceutical innovation 2014: Turning the corner? Retrieved from https://www2.deloitte.com/uk/en/pages/life-sciences-and-healthcare/articles/measuring-the-return-from-pharmaceutical-innovation-2014.html (accessed on October 5, 2017).
- DiMasi, J. A., Feldman, L., Seckler, A., & Wilson, A. (2010). Trends in risks associated with new drug development: success rates for investigational drugs. Clinical Pharmacology & Therapeutics, 87(3), 272–277. doi:10.1038/clpt.2009.295
- Downing, N. S., Zhang, A. D., & Ross, J. S. (2017). Regulatory review of new therapeutic agents – FDA versus EMA, 2011–2015. New England Journal of Medicine, 376(14), 1386–1387.
- Fleming, J. J. (2015). The decline of venture capital investment in early-stage life sciences poses a challenge to continued innovation. Health Affairs, 34, 270–276.
- Invest Europe (2017). European Private Equity. Statistics on Fundraising, Investments and Divestments. available at: https://www.investeurope.eu/media/711867/Invest-Europe-2017-European-Private-Equity-Activity.pdf (accessed on October 5, 2017).
- Janssen Health Policy Center (2015). Investing in the future of health. Retrieved from http://www.janssen-emea.com/node/1154 (accessed on October 2, 2017).
- KPMG (2017). Venture Pulse. Retrieved from https://assets.kpmg.com/content/dam/kpmg/xx/pdf/2018/01/venture-pulse-report-q4-17.pdf (accessed on October 15, 2018).
- Lazonick, W., & Tulum, O. (2011). US biopharmaceutical finance and the sustainability of the biotech business model. Research Policy, 40(9), 1170–1187. doi:10.1016/j.respol.2011.05.021
- Lazonick, W., & Mazzucato, M. (2013). The risk-reward nexus in the innovation-inequality relationship: who takes the risks? who gets the rewards? Industrial and Corporate Change, 22(4), 1093–1128. doi:10.1093/icc/dtt019
- OECD (2017). Entrepreneurship at a Glance 2017. Retrieved from https://doi.org/10.1787/22266941 (accessed on October 15, 2018).
- Politico (2015). Are levels of health R&D investment in Europe sufficient to cope with health challenges? Retrieved from https://www.politico.eu/sponsored-content/are-levels-of-health-rd-investment-in-europe-suffi-cient-to-cope-with-health-challenges/ (accessed on October 5, 2017).
- PWC/CB Insights (2018). MoneyTree report. Retrieved from: https://www.pwc.com/us/en/moneytree-report/moneytree-report-q3-2018.pdf (Accessed on October 20, 2018).
- Reiner, U. H. (2013). Determinants of venture capital performance – empirical evidence (PhD dissertation), Technische Universität München, Munich. Retrieved from https://d-nb.info/104587888X/34 (accessed on October 2, 2017).
- Schwienbacher, A. (2008). An empirical analysis of venture capital exits in Europe and in the United States. Financial Markets and Portfolio Management, 22(3), 195–217. DOI 10.1007/s11408-008-0080-z doi:10.1007/s11408-008-0080-z