
 ?Mathematical formulae have been encoded as MathML and are displayed in this HTML version using MathJax in order to improve their display. Uncheck the box to turn MathJax off. This feature requires Javascript. Click on a formula to zoom.
Abstract
This study utilises a time-varying wavelet analysis to examine the relationship between the onshore spot market and the offshore non-deliverable forward (N.D.F.) market of the Chinese Yuan (C.N.Y.). Given the presence of structural changes in the two markets, we did not find any stable causality during the sample period. However, in some sub-samples, we found that there is a strong nonlinear causal relationship running from the onshore spot market to the offshore N.D.F. market. Ties between the two markets are closer after the widening of the onshore trading band, first in April 2012, second in March 2014 and again in August 2015. The onshore spot market is heavily influenced by interventions by the People's Bank of China (P.B.C.). These findings imply that offshore N.D.F. market development is not divorced from onshore development, as developments in the onshore spot market influence the offshore N.D.F. market. The results show that the exchange rate markets for the C.N.Y. are not efficient. Thus, to successfully internationalise the C.N.Y., financial expansion of the onshore spot market should keep pace with the growing offshore N.D.F. market to minimise destabilisation of the C.N.Y.
1. Introduction
The main objective of this research is to investigate the relationship between the onshore spot and offshore non-deliverable forward (N.D.F.) markets for the Chinese Yuan (C.N.Y.). The onshore market, known as the C.N.Y. market, notwithstanding its increasing flexibility, remains constrained by interventions by the People's Bank of China (P.B.C.) and the stipulation of a daily trading band. To promote a market-oriented C.N.Y. exchange rate, China introduced a floating exchange rate mechanism based on market supply and demand with reference to a basket of currencies on July 21, 2005. The C.N.Y. is no longer tied to the US dollar (U.S.D.), and the C.N.Y. exchange rate regime is currently more flexible (Liang & Gao, Citation2012). Among different types of trading, spot contracts have a larger amount of transactions, whereas forwards have a smaller share (Shu, He, & Cheng, Citation2015). Access to the wholesale market is restricted to domestic entities, including banks, finance companies, and the domestic subsidiaries of foreign banks (Subramanian & Kessler, Citation2013). Importantly, foreign exchange transactions between banks and their customers must be backed by underlying real demand (e.g., current account transactions), and purely speculative trades are prohibited (Fratzscher & Mehl, Citation2014). The P.B.C. tries to maintain exchange rate stability on the market; however, continuing constraints on exchange rate movement may dampen the development of the onshore market.
In contrast, the offshore N.D.F. markets, which have a short history and are growing exponentially, are more likely to reflect market sentiment and expectations, which are specifically established for the not-fully convertible currencies of countries with capital controls (Doukas & Zhang, Citation2013). To control appreciation or depreciation risk, C.N.Y. derivatives have become increasingly popular in offshore N.D.F. markets. The most actively traded derivatives are offshore N.D.F.s. An offshore N.D.F. is a cash-settled, short-term forward contract on a thinly traded or non-convertible foreign currency, with profit or loss on maturation calculated and settled using an agreed-upon currency, normally the U.S.D. (Liang & Gao, Citation2012). The time periods quoted for offshore N.D.F.s are usually one month to one year, such as N.D.F.1M, N.D.F.3M, N.D.F.6M, and N.D.F.12M, with other intervals available upon request. Because of the limited exchange rate regime, the onshore C.N.Y. exchange rate cannot be used in offshore markets. However, given the significant improvement in the quality of foreign capital utilisation in China, an increasing number of international businesses are trading with Chinese firms. These international corporations need to either hedge or speculate in the market for currency exchanges. China has taken steps toward developing offshore markets for C.N.Y. trading and toward liberalising the exchange rate determination in its onshore market (Owyong, Wong, & Horowitz, Citation2015). In fact, the volume of transactions in the offshore N.D.F. market is continuously increasing. Offshore N.D.F.s currently display greater volatility in daily movements over a wider trading range.
While liberalising its trade activities, China remains conscientious about maintaining the stability of its financial sector. Regulations and capital control measures are in place to restrict and manage cross-border capital movements (Cheung, Steinkamp, & Westermann, Citation2016). The distinctive features of the C.N.Y. and N.D.F. markets, and the continuing segmentation of the onshore and offshore C.N.Y. markets in general (including money, bond and foreign exchange markets), frequently cause the two exchange rates to diverge from each other (Shu et al., Citation2015). In a perfect market where currency forward and spot markets simultaneously reflect the same aggregate information, price discrepancies would be instantly arbitraged away. According to the model developed by Callen, Chan, and Kwan (Citation1989), in an efficient exchange rate market, the information conveyed by past spot rates should be fully impounded in future spot and forward rates. However, various market frictions and investment restrictions may affect the relationship between the onshore spot market and the offshore N.D.F. market. In particular, an Asian N.D.F. market has developed for currencies of countries where the government controls the currency market and restricts foreign capital movements (Doukas & Zhang, Citation2013). Our study will assist policymakers who seek a better understanding of the relationship between the onshore spot and offshore N.D.F. markets. In particular, we will answer the question of whether the development of the offshore N.D.F. market is divorced from the onshore spot market. This approach will prove particularly helpful as policymakers in emerging market economies consider capital controls and policies that support a non-convertible exchange rate regime.
Thus, knowledge of the interrelation and information flows between the onshore spot and offshore N.D.F. markets is important for understanding financial market integration. Such an understanding has important implications. First, for investors who need to hedge their currency exposure or take speculative positions using the N.D.F. market instead of the illiquid local forward market, understanding these cross-market relationships is important for developing an investment strategy. Second, from a broader perspective, markets for non-deliverable currency forwards are of interest to policymakers because they are a product generally used to hedge exposure or speculate about a move in a currency where local market authorities limit such activity. Prices on the N.D.F. market can provide useful information for authorities and investors to gauge market expectations under potential pressures on an exchange rate regime in the future.
This study contributes to the existing literature in several important ways. First, we consider the lead-lag effects between the onshore spot and offshore N.D.F. markets, noting that the two markets are driven by different participants with different exchange rate expectations. Furthermore, we also consider the time-varying lead-lag effects of the daily exchange rates across different sub-samples (Balcilar, Ozdemir, & Arslanturk, Citation2010; Balcilar & Ozdemir, Citation2013; Loh, Citation2013). This time-varying view is crucial for identifying the differences in lead-lag effects across the different time horizons.
Second, the existing studies exclusively utilise conventional time-domain methods, namely, conventional Granger causality tests and correlation analysis (e.g., Ma, Ho, & McCauley, Citation2004; Misra & Behera, Citation2006; Chen, Gong, & Zheng, Citation2009). That is, they typically ignore any time variation in the relationships between the two markets. Moreover, these studies do not explore the frequency variation in such relationships in these time-domain approaches. Thus, we employ non-linear Granger causality, such as wavelet analysis (Grinsted, Moore, & Jevrejeva, Citation2004; Aguiar-Conraria & Soares, Citation2014). Wavelet analysis possesses significant advantages over conventional time-domain methods. It expands the underlying time series into a time-frequency space where researchers can visualise both time- and frequency-varying information of the series in a highly intuitive way. Wavelet coherency and phase differences simultaneously assess how the co-movements and causalities between two markets vary across frequencies and change over time in a time-frequency window. In this way, we can observe high-frequency (short-term) and low-frequency (long-term) relationships between the two markets as well as possible structural changes and time variations. The time- and frequency-varying features in such relationships provide important practical implications for portfolio management. Time-varying co-movement implies that the risk exposure and diversification benefits of asset portfolios evolve over time, and investors should incorporate such effects when evaluating the risk and returns of these portfolios. Frequency-varying co-movement suggests that investors with different investment horizons should consider co-movements at corresponding frequencies to allocate their assets more effectively. The time- and frequency-varying features in the causality can also significantly affect the accuracy of market performance predictions and, hence, the investment benefits for practitioners and the regulatory benefits for policymakers. This article identifies co-movements and causality in time and frequency domains between the onshore spot and offshore N.D.F. markets using distinctive methods and deriving new insights and implications for investment strategies and market forecasts.
Third, in contrast to the findings of Yang and Leatham (Citation2001), we find that no long-term equilibrium relationship exists between the C.N.Y. and N.D.F. markets, implying that there were structural changes in the two markets. However, in some sub-samples, we find strong nonlinear causality running from the C.N.Y. market to the N.D.F. market. Our results affirm the findings of Tian and Chen (Citation2013) and indicate that the C.N.Y. market is heavily influenced by the interventions of the P.B.C. Given the frequent interventions of the P.B.C. and the greater influence it wields over the C.N.Y. market, the direction of causality should be stronger in the N.D.F. market than in the C.N.Y. market, which we find to be true for the onshore spot market. These issues are clearly concerns for Chinese policymakers, who seek to promote the internationalisation of the C.N.Y. exchange rate but would also prefer to avoid excessive exchange rate volatility. Thus, to successfully internationalise China’s currency, onshore financial expansion should keep pace with the growing offshore markets to minimise the destabilisation of the C.N.Y. exchange rate.
This empirical study is organised as follows: Section 2 provides a literature review. Section 3 describes the theoretical background. Section 4 illustrates the methodology. Section 5 presents the data used and discusses the empirical results. Section 6 presents the conclusions.
2. Literature review
Extensive work has been done to understand the relationships between spot and N.D.F. markets. Park (Citation2001) focused on the impact of reforms of the Korean exchange rate systems, which occurred in December 1997 in response to the currency crisis, and their impacts on the relationship between the spot and N.D.F. markets. He found that during the pre-reform period, a mean spillover effect existed from the spot to the N.D.F. markets but not vice versa; furthermore, a volatility spillover effect existed in both directions. After the reforms, however, the results reversed, and a mean spillover effect existed from the N.D.F. to the spot markets. Additionally, the volatility spillover effect existed only in the same direction. These findings suggest that there are information flows between the two markets, and the reforms changed the direction of the dynamic relationship. Park and Rhee (Citation2001) found that during a currency crisis, offshore N.D.F. rates reflect market fundamentals more closely than onshore spot and forward exchange rates, which are usually tightly regulated and heavily affected by government intervention during a non-normal event, such as a financial crisis. The Korean Won was significantly overvalued on the eve of the country’s crisis in 1997 and became undervalued at the beginning of 1998 due to sharp nominal depreciation, but the degree of under-valuation was not large enough to spark the resumption of foreign capital inflows. Ma et al. (Citation2004) found that Asian N.D.F. volatility was typically larger than the spot counterpart owing in part to official intervention in the spot market. Asian N.D.F.s tend to correlate more positively with each other than do their spot counterparts and respond similarly to movements in the forwards of major currencies. The wide range in values between onshore spot and offshore N.D.F. rates suggest effective segmentation of the two markets in Asia, except for Korea. Misra and Behera (Citation2006) found that there has been an increase in liquidity in the Indian Rupee (I.N.R.) N.D.F. market. This market essentially draws information from the onshore spot and forward markets. The bid-offer spread and volatility in this market has, however, generally remained higher than that of onshore counterparts. While the offshore N.D.F. rates do not directly influence the spot and forward rates in the domestic markets, volatility in the N.D.F. markets was empirically determined to influence the onshore markets. Chen et al. (Citation2009) found that opening up N.D.F. and capital liberalisation produces better market integration as well as higher volatility. At the same time, the effectiveness of central bank interventions and the independence of economic policies might be affected. Market segmentation policies help to improve the influence of onshore markets on price discovery, especially when N.D.F. markets are not well developed. Guru (Citation2009) found that N.D.F. markets are currently exerting increased influence on the domestic spot markets through spillover effects and improved informational content. Policymakers may need to take a closer look at these markets, as there could be risks that are overlooked; Indian regulators have sought to keep short-term capital movements under control. In a study by Cadarajat and Lubis (Citation2012), the evidence of mean spillover was observed to be unidirectional from the N.D.F. to both spot and forward rupiah markets. However, there were two ways to return transmissions between the N.D.F. and forward rate changes during the European crisis. In terms of volatility, spillover was only significant from the N.D.F. market to the spot market for the entire period. However, during a time of crisis, there is interdependence between volatility in the offshore N.D.F. and changes in the onshore spot rate, whereas information transmission is only valid from the N.D.F. to forward rate changes. Gu and McNelis (Citation2013) found not only that the Japanese Yen directly and significantly influences the onshore spot market but also that the Japanese Yen exerts strong direct pressure on offshore financial markets through speculative movements in the N.D.F. markets. The N.D.F. market for the Korean Won, which is based on the more flexible spot exchange market and open access by domestic banks, plays little or no role linking Yen/U.S.D. to domestic currency or financial markets in Korea. Wang, Fawson, Chen, and Wu (Citation2014) found that spot and N.D.F. markets are related to each other with price feedback effects in Korea. Offshore Korean N.D.F. market factors have become a potentially important informational tool for gauging the spot exchange rate regime going forward. In Taiwan, the spot market exerts influence over N.D.F. markets. In contrast to Korea, the offshore Taiwanese N.D.F. market has less influence on the spot market and follows directly or lags behind returns on the spot market. The authors also found greater intensity of cross-market volatility spillovers within markets in Korea, reflecting the considerable information transmission that occurs through spot and N.D.F. markets. However, this may expose the Korean spot market to higher volatility as appreciation/depreciation shocks propagate from offshore markets. In Taiwan, they found that shocks in spot markets induce increased volatility in N.D.F. markets. The irrelevance of information flows from the N.D.F. to spot markets might be beneficial to Taiwanese policymakers, whose monetary policy targets domestic currency market stability. Nevertheless, this might eliminate the usefulness of N.D.F. markets for hedging purposes in periods of market stress. The error correction process is a useful price-discovery vehicle for predicting subsequent price movements on spot and N.D.F. markets. N.D.F. market traders should consider changes in the Yen exchange rate as a fundamental reference point for spot market returns. In a study by Keefe and Rengifo (Citation2015), an alternative mechanism to using foreign exchange reserves in the spot market in the context of volatility options issued by the Colombian central bank was found. The authors employed event study techniques to document how in a vast majority of the instances, such currency call-and-put options auctioned by the central bank have proven to be efficient in lowering exchange rate volatility. Vanitha and Kavipriya (Citation2016) found that there is a long-running relationship between onshore and offshore markets among Asian currencies. The authors also conclude that the use of N.D.F. would help to continue increasing foreign investments. Saravanan and Shanmugam (Citation2017) adopted the augmented G.A.R.C.H. formulation to compare the N.D.F. and spot market in India and found that a mean and volatility spillover effect exists between the N.D.F. and spot market. Chadha (Citation2017) found that development of transparent and robust onshore markets combined with continued liberalisation of non-resident participation in onshore markets and several measures to bring offshore markets onshore could reduce the importance of N.D.F. markets over time. Wang, Yang, Wang, and Fawson (Citation2017) showed that N.D.F. markets play a dominant role over D.F. markets with regard to price discovery during periods of tranquility. During periods of crisis, both N.D.F. and D.F. markets exhibit more balanced impacts on currency market price discovery mechanisms.
Many studies have considered the lead-lag effects between the C.N.Y. and N.D.F. markets, noting that the two markets were driven by different participants with different exchange rate expectations (e.g., Yang & Leatham, Citation2001; Owyong et al., Citation2015). In a study by Yang and Leatham (Citation2001), the C.N.Y. and N.D.F. markets were found to be cointegrated, although this cointegration emerged only after partial currency convertibility was allowed in March 1996. Their findings indicate that currency convertibility increased the informational connection between the government's official exchange rate and the swap market exchange rate, exclusively traded by foreign investors, and thus improved the information on C.N.Y. exchange rates. A report by Huang and Wu (Citation2006) also found that the relationship between the C.N.Y. and N.D.F. markets was cointegrated. According to Peng, Shu, and Yip (Citation2007), the C.N.Y. market has undergone a rapid build-up in market infrastructure and price discovery mechanisms in the past year, with empirical evidence suggesting that the pricing is increasingly determined by financial fundamentals. However, the growth of the market has been restrained by restrictions on the participant base, thus limiting variations in the C.N.Y. exchange rate. The N.D.F. market, which is concentrated in Hong Kong and Singapore, has become more developed but has the drawback that its pricing is not tied to financial fundamentals. A comparison between onshore and offshore markets suggests that two issues are of particular importance for the development of the future derivatives market in China: the balance between regulation and development and the relationship between the C.N.Y. and N.D.F. markets. Kong and Shao (Citation2010) found that after the reform of the exchange market in China, a less restrictive N.D.F. market environment appeared to incorporate a more robust set of information in the currency exchange markets, suggesting that N.D.F. prices reflect spot prices under a diversity of investors and a capitally bound situation. According to a study by Gu and McNelis (Citation2013), the three-month N.D.F. premia in the offshore C.N.Y. market is a key series that links the Yen/U.S.D. volatility to financial market movements in China through speculative pressure. Offshore N.D.F.s are driven by their own dynamics, and the movements are driven by speculative psychology generated by the Yen/U.S.D. exchange rate. Neither interest rate differentials nor the spot exchange rate of C.N.Y./U.S.D. movements affect the offshore N.D.F.s. As Yen/U.S.D. volatility increases, the C.N.Y. discount in the N.D.F. market becomes increasingly negative. The C.N.Y./U.S.D. has some predictability through information from N.D.F. markets. Ding, Tse, and Williams (Citation2014) found that price discovery is absent between onshore and offshore spot markets. However, the authors documented the presence of price discovery between onshore spot and offshore N.D.F. rates. These seemingly inconsistent results present a puzzle wherein one offshore market appears to be more informationally integrated with the onshore market than another. Price discovery differences in the offshore markets stem from offshore spot and forward contracts tracking different aspects of the C.N.Y. rates. Moreover, the introduction of offshore spot trading in Hong Kong has led to an increase in cross-market price discovery between onshore spot and offshore N.D.F. rates. The N.D.F. rates are even more relevant to onshore spot rates, leading to higher levels of cross-market price discovery and information integration. From a policy perspective, despite the increased relevance of offshore N.D.F. rates, Chinese capital controls remain largely binding. As a result, some form of market segmentation remains between onshore and offshore exchange rates. Owyong et al. (Citation2015) found that a change in the market dynamics of the C.N.Y. exchange rate occurred after April 14, 2012, when the exchange rate band widened from 0.5% to 1%. This widening afforded greater exchange rate flexibility, gave market forces free rein to determine exchange rate movements, and created the first structural breakpoint in the long-term cointegration between the C.N.Y. and N.D.F. markets. The other breakpoint was on March 15, 2014, when the band widened from 1% to 2%. There was long-term equilibrium between the onshore spot and offshore forward markets. The authors also found stronger causality from the onshore spot market to its offshore counterpart, but they found more balanced bidirectional causality in the forward market. This suggests an informational edge in the domestic market that lasts only in the very short term, probably because of the proximity to local events, such as central bank moves, policy changes, and data releases. In the longer term, factors such as economic fundamentals would be relatively dominant, and news about these could emanate from China or its export markets globally. Huszar, Zhang, and Tan (Citation2015) found that in the onshore and offshore exchange rate markets, C.N.Y. forward contracts were designed in similar ways. However, the underlying economic forces and regulatory frameworks are very different in these two markets. While the covered interest rate parity conditions do not hold in either market, the offshore N.D.F. market was shown to be more efficient by conveying more private information about investor expectations. Cheung and Yiu (Citation2016) found that offshore renminbi trading activity is affected by both the host economy’s characteristics and its links with China. For instance, the occurrence of offshore R.M.B. trading is determined by gross domestic production, stage of financial development and free trade agreements with China. McCauley and Shu (Citation2016) argued that C.N.Y. internationalisation has led to rapid displacement of N.D.F.s by deliverable forwards, while the N.D.F. market has retained or even gained in importance for other emerging market economy currencies. Burdekin and Tao (Citation2017) examined fluctuations between the offshore values of the C.N.Y. in Hong Kong and its onshore value in mainland China. They found that the size of the spot market spread appears to be influenced by stock market sentiment as reflected in the spread between the A-shares listed in Shanghai and H-shares listed in Hong Kong. Xu, Zhou, and Sornette (Citation2017) employed the thermal optimal path method to explore both the long-term and short-term interaction patterns between the onshore C.N.Y. and offshore C.N.H. exchange rates and found that both exchange rates exhibited a weak alternate lead-lag structure at most sample times.
The conflicting results provide motivation to revisit the relationship between spot and N.D.F. markets through wavelet analysis. This approach is different from most conventional mathematical methods, such as correlation analysis and Granger causality tests, which cannot identify short-run and long-run links among time series. The wavelet analysis allows expansion of time series into a time-frequency space in which the local correlation and the lead-lag nexus can be determined in a highly intuitive way based on the null hypothesis, in which there is no relation between the variables. Therefore, this method is very suitable for simultaneously assessing whether the linkage varies across frequencies and evolves over time, especially when time series are non-stationary or locally stationary (Roueff & Von Sachs, Citation2011; Jiang, Chang, & Li, Citation2015).
3. Foreign exchange market efficiency
Following a model developed by Callen et al. (Citation1989), we considered a bivariate stochastic process where
denotes the spot rate, and
denotes the forward rate at time t. It is well known that the stochastic process
can be modelled as follows:
(1)
(1)
(2)
(2)
here,
denotes the lag operator,
is the lag polynomial, and
is the zero-mean white noise. The causal relationships enter the model in a very natural way. If
then it is clear from EquationEquation (1)
(1)
(1) that the spot rates have no effect on predicting forward rates; that is, spot rates do not cause forward rates, and the foreign exchange markets are therefore efficient (semi-strong). Similarly, if
forward rates do not cause spot rates. Thus, one can determine the causal relationships between spot and forward rates using EquationEquations (1)
(1)
(1) and Equation(2)
(2)
(2) . If the markets are efficient (semi-strong), then knowledge of past spot rates should have no bearing on predicting today’s forward rates (Callen et al., Citation1989). That is, in efficient exchange rate markets, spot rates do not cause forward rates. China has taken steps to develop offshore markets for C.N.Y. trading and to liberalise exchange rate determination in its onshore markets. In this article, we employed a model developed by Callen et al. (Citation1989) to investigate the relationship between the spot and forward rates, which can assist policymakers who seek a better understanding of the relationship between onshore spot and offshore forward markets. The N.D.F. rate is a very good ex ante exchange rate expectation, with N.D.F. rates serving as a proxy for exchange rate expectations (Ding et al., Citation2014). Thus, we can substitute N.D.F. rates for forward rates. However, offshore forward rates cannot be replaced by C.N.H. (offshore spot). Thus, we did not study the relationship between C.N.Y. and C.N.H. markets or between C.N.H. and offshore N.D.F. markets. Instead, we examined the cointegration and lead-lag effects between C.N.Y. and offshore N.D.F. markets, with particular attention to how the interaction was affected by the widening of the onshore trading band, first in April 2012, second in March 2014 and further in August 2015. Especially for C.N.Y. exchange rates, the first question is whether the development of the offshore N.D.F. market is divorced from the onshore spot market. The second question is whether the ties between the onshore spot and offshore N.D.F. markets are closer after band widening. The third question is whether there is a long-term equilibrium relationship between the two markets.
4. Time-varying wavelet analysis
Wavelet analysis estimates the spectral characteristics of a time series as a function of time (Aguiar-Conraria, Azevedo, & Soares, Citation2008). Therefore, it can extract localised information in both time and frequency domains, which means that it has a significant advantage over Fourier analysis for a non-stationary or locally stationary series (Roueff & Von Sachs, Citation2011).
4.1. Continuous wavelet transform
In this article, we chose continuous wavelet transform (C.W.T.) to decompose the concerned series into wavelets, which extract features and detect data self-similarities (Grinsted et al., Citation2004; Loh, Citation2013).1 The C.W.T. of a given stochastic process is defined as a convolution type as follows:
(3)
(3)
where the * indicates the complex conjugation, and
is the complex conjugate function of
namely, this is the basis wavelet function. Notably, the basis wavelet comes from a given mother wavelet, represented by
as follows:
(4)
(4)
where
is the wavelet scale that controls how the mother wavelet is stretched, and
is the location parameter that controls where the wavelet is centred. By changing the scale parameter
and translating along the localised time index
one can construct a picture that shows how the amplitudes of the stochastic process
vary across scales and over time (Torrence & Compo, Citation1998). A mother wavelet in the C.W.T. must fulfill three conditions. First, the mean must equal zero; namely,
which ensures that it oscillates across positive and negative values and thus is nonzero locally. Second, its square must integrate to unity; that is,
which implies a limitation to an interval of time. Finally, it must satisfy the admissibility condition, which refers to the following:
(5)
(5)
where
is the Fourier transform of the mother wavelet
In wavelet theory and practice, various types of mother wavelets exist for various purposes, such as the Haar, Morlet, Daubechies, Mexican hat and other wavelets. Among them, the most popular and applicable mother wavelet for feature extraction is the Morlet wavelet, which Grossmann and Morlet (Citation1984) introduced. It is as follows:
(6)
(6)
where
ensures its unity energy, i.e.,
and
ensures that it satisfies the admissibility condition of EquationEquation (5)
(5)
(5) . In particular, when the dimensionless frequency
the Morlet wavelet achieves an optimal trade-off between time and frequency localisation (Grinsted et al., Citation2004). Since the Morlet wavelet is a complex wavelet, the C.W.T. is divided into real and imaginary parts. As such, we can calculate the amplitudes and phases of the C.W.T. for further estimations of the wavelet power spectrum, wavelet coherency and phase difference.
4.2. Wavelet power spectrum
The wavelet power spectrum of the stochastic process namely, the auto-wavelet power spectrum, is simply defined as
It presents a measure of the localised variance, that is, the localised volatility of the stochastic process
at each scale or frequency. Furthermore, since Hudgins, Friehe, and Mayer (Citation1993) first introduced the cross-wavelet transform of
and
as
the cross-wavelet power spectrum is accordingly written as follows:
(7)
(7)
where * indicates a complex conjugation. The cross-wavelet power spectrum can provide a measure of the localised covariance between
and
for the specified frequency.
4.3. Wavelet coherency and phase difference
Following the approach of Torrence and Webster (Citation1999), we estimated the wavelet coherence by using the cross-wavelet and auto-wavelet power spectrums as follows:
(8)
(8)
Here, we calculate the wavelet coherency with the above squared type and a smoothing operator 2 In this way, it provides a quantity between 0 and 1 in a time-frequency window. Zero coherencies indicate no co-movement, whereas the highest coherency implies the strongest co-movement between the two markets.
Because the wavelet coherency is squared, we cannot distinguish between positive and negative co-movements. Therefore, we subsequently used the phase difference to provide information on positive and negative co-movements as well as the lead-lag relationships between the two markets. According to Bloomfield et al. (Citation2004), the phase difference characterises a phase relationship between and
as follows:
(9)
(9)
where
and
are the imaginary and real parts of the smoothed cross-wavelet transform, respectively.
A phase difference of zero indicates that the two underlying series move together, while a phase difference of π(–π), implies that they move in opposite directions. If then the series moves in phase (positively co-moves) with
leading
If
then the series moves out of phase (negatively co-moves) with
leading
If
then the series moves out of phase with
leading
If
then the series moves in phase with
leading
Note that the phase difference can also indicate causality between
and
in both the time and frequency domains. Consequently, time-varying wavelet analysis dominates the conventional Granger causality test, which assumes that a single causal link holds for the whole sample period as well as at each frequency (Grinsted et al., Citation2004; Tiwari, Mutascu, & Andries, Citation2013). For example, if
leads
this suggests a causal relationship running from
to
at a particular time and frequency. Therefore, we rely on partial wavelet coherency and partial phase difference extensions of wavelet coherency and phase difference.
5. Data and empirical results
Following Owyong et al. (Citation2015), we used China’s daily exchange rate data to examine causality between the C.N.Y. and N.D.F. markets. The sample period started from the date on which the P.B.C. allowed the use of the C.N.Y. outside of China, which was November 2, 2009. The Chinese authorities have moved quickly to remove restrictions on the use of the C.N.Y. in current account transactions and have been gradually expanding the scope since July 2009 (Funke, Shu, Cheng, & Eraslan, Citation2015). The sample period ends on March 25, 2016, which covers the three C.N.Y. band-widening moves during the years 2012, 2014 and 2015. To enhance exchange rate flexibility, in April 2012, March 2014 and August 2015, the P.B.C. widened the daily foreign exchange trading band. This band governs the permitted degree of fluctuation in the currency within a trading day and determines the extent to which the C.N.Y.’s exchange rate movements reflect market forces rather than governmental guidance. If the P.B.C. does not allow depreciation pressure of the C.N.Y. against the U.S.D. to be released, there will be certain costs (Cheung et al., Citation2016). One cost of preventing the C.N.Y.'s depreciation is the shrinking of China’s foreign exchange reserve. For example, by the end of January 2016, China's foreign exchange reserve was US$3,230 billion, which indicated that the scale of this reserve decreased nearly US$800 billion from its peak level. There are 1,517 daily observations obtained from the Wind database, which is comprised of daily C.N.Y. exchange rates for onshore spot rates and offshore N.D.F. forward rates.
Following Ding et al. (Citation2014), we substituted N.D.F. rates for forward rates in this article. N.D.F.1M refers to a 1-month-ahead offshore forward exchange rate in the offshore N.D.F. markets. One-month forward contracts are employed in this article because they have the largest trading volume among the different maturities (Wang et al., Citation2014). C.N.Y. refers to the onshore spot exchange rate.
In comparison, several univariate unit root tests, such as the Augmented Dickey Fuller (A.D.F.) (Dickey & Fuller, Citation1981) and Phillips and Perron (P.P.) (Phillips & Perron, Citation1988), were employed to examine the null of a unit root in the exchange rate markets that we study. The results in clearly show that A.D.F. and P.P. tests cannot reject the null of the unit root of C.N.Y. and N.D.F.1M in levels but can reject the null of the unit root of D.C.N.Y. and D.N.D.F.1M (the first differences of C.N.Y. and N.D.F.1M). In sum, the A.D.F. and P.P. test results show that D.C.N.Y. and D.N.D.F.1M are stationary processes.
Table 1. Unit root tests.
Because we are interested in examining the causal relationship between the C.N.Y. and N.D.F. markets, the full-sample causality results of the chi-square and bootstrap L.R. tests are reported in . The optimal lag-lengths based on the Schwarz information criterion (S.C.) are 2. According to the p-values, the results show that the two null hypotheses are rejected, indicating bidirectional causality between the C.N.Y. and N.D.F. markets.
Table 2. Full-sample Granger causality tests.
The widening of the C.N.Y. band afforded greater exchange rate flexibility, gave market forces freer rein to determine exchange rate movements, and created structural changes in the long term between the two markets (Owyong et al., Citation2015). Therefore, full-sample causality tests with assumptions of parameter constancy and a causal relationship across the whole sample period are no longer reliable, and the ensuing results become meaningless (Zeileis, Leisch, Kleiber, & Hornik, Citation2005). Therefore, this article tests for parameter stability and determines whether structural changes exist. In this article, we employed the Sup-F, Mean-F and Exp-F tests developed by Andrews (Citation1993) and Andrews and Ploberger (Citation1994) to investigate the temporal stability of the parameters in the models formed by the two variables in their first differences. The Lc test of Nyblom (Citation1989) and Hanson (Citation2002) was also utilised here to test for the temporal stability of the parameters.
The results are reported in . The Sup-F tests are reported in the first row. The results suggest that a one-time sharp shift exists in the equation. The Mean-F and Exp-F tests are reported in the second and third rows, respectively. The results demonstrate that the parameters evolved gradually over time, except for the D.N.D.F.1M equation. The Lc statistics were tested against the alternative that the parameters follow a random walk process, as proposed by Gardner (Citation1969). This is indicative of the parameters’ non-constancy estimated by utilising the full-sample data. Consequently, these results provide robust evidence that the parameters based on the full-sample data exhibit short-run instability.
Table 3. Short-run parameter stability tests.
The two variables, the C.N.Y. and N.D.F.1M, are both I (1) processes, as indicated by the results of the A.D.F. and P.P. unit root tests. Therefore, the F.M.-O.L.S. estimator is employed to estimate cointegration. The Sup-F and Lc tests were employed to evaluate the parameter stability of the long-run relationship. The related results are presented in . According to the bootstrap p-values in the second row, the Lc statistics reject the null hypothesis of cointegration at 1%. Meanwhile, the Sup-F statistics reject the null hypothesis of parameter constancy at 1%. Although the gradual shifting of parameters in the cointegration equation cannot be identified from the Mean-F and Exp-F tests, significant evidence exists of a one-time shift in the long-run relationship. Hence, no reliable cointegration between the C.N.Y. and N.D.F. markets can be obtained from the Lc and Sup-F tests. Thus, long-run parameter stability tests demonstrate the absence of valid cointegration between the two markets, which is inconsistent with the findings of Owyong et al. (Citation2015), who also employ daily exchange rates to examine cointegration for C.N.Y.
Table 4. Long-run parameter stability tests.
Grounded on the above parameter stability tests, the short-run parameters estimated utilising the full-sample data are unstable because of the presence of structural changes. Nevertheless, this result is very suitable because in the past few decades, China has experienced economic restructuring and changes in its monetary policy (Jiang et al., Citation2015). This means that the results showing an absence of any full-sample causality between the C.N.Y. and N.D.F. markets are relatively worthless. Hence, the causality test must consider structural changes and allow for causal links between the variables to be time-varying across different sub-samples. The time-varying wavelet analysis can consider structural changes and allows simultaneous assessment of co-movement and causality between the two variables in both time and frequency domains. Therefore, we employed a time-varying wavelet analysis in a time-frequency window to revisit the dynamic causal relationship between the C.N.Y. and N.D.F. markets, which is an approach that significantly differs from those used in the existing literature (e.g., Ding et al., Citation2014).
and indicate the time series plots and auto-wavelet power spectrums of the C.N.Y. and N.D.F. markets, respectively. The thick black lines in the contours of the wavelet power spectrum plots represent the 5% significance level estimated from Monte Carlo simulations using a phase randomised surrogate series. The regions below the thin black lines are the cones of influence (C.O.I.), in which edge effects exist.3 As mentioned previously, we employed the wavelet power spectrum as an indicator of the local volatility of the underlying series. We clearly marked the squared wavelet coherency with colored bars on the right-hand side of the wavelet coherency plots, where red colors correspond to strong co-movement and blue colors correspond to weak co-movement. Wavelet coherency allows for a 3-D analysis, which simultaneously considers the time and frequency components as well as the strength of the correlation between the time series components (Loh, Citation2013). In this way, we can observe both the time and frequency variations of the correlation between series in a time-frequency space.
Figure 1. The time series of D.C.N.Y (a) and its wavelet power spectrum (b). The y-axis refers to the frequencies (measured in years); the x-axis refers to the time period from 2009 to 2016.
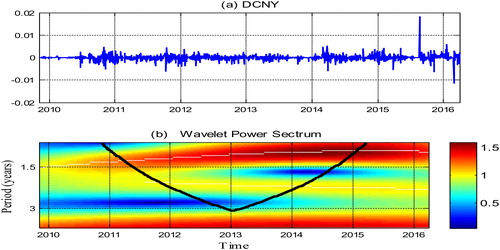
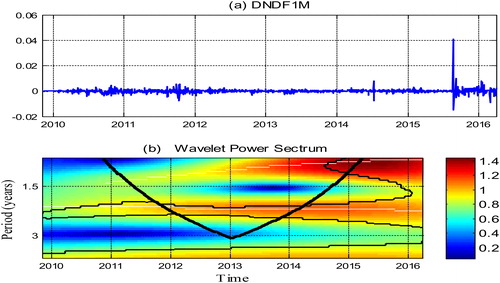
Figure 2. The time series of D.N.D.F.1M (a) and its wavelet power spectrum (b). The y-axis refers to the frequencies (measured in years); the x-axis refers to the time period from 2009 to 2016.
indicates that the volatility of the C.N.Y. market is not statistically significant. The findings from Tian and Chen (Citation2013) indicate that the onshore C.N.Y. markets are heavily influenced by interventions by the P.B.C. The authors found that China’s onshore C.N.Y. markets are regulated under a de facto political connections-based regime, which may help explain the consistent, stable performance of onshore C.N.Y. markets. This may be the reason for the volatility of onshore C.N.Y. markets that exhibit joint insignificance. Our results are consistent with the findings of Tian and Chen (Citation2013).
indicates that a relatively high wavelet power of the N.D.F. market occurred across the 0.5–3 years’ frequency band during the years 2011–2014 and 2015. Within this period, offshore trading emerged as an important market phenomenon, which is reflected by the increasing number of offshore foreign exchange transactions in N.D.F. markets. Such transactions are cash settled, contracted offshore and virtually beyond the direct jurisdictional purview of domestic monetary authorities who seek to impose currency convertibility restrictions. While offshore investors only have limited access to onshore interest markets, N.D.F. markets are derived mainly from expectations about future spot markets. For N.D.F. operations, the conversion quota for trade settlement-related C.N.Y. transactions placed severe restrictions on liquidity in the offshore C.N.Y. market. The quota ceiling was reached in October 2010 due to overwhelming offshore demand for the C.N.Y. The reverse situation occurred in Q4 2011 against the global backdrop of a sharp increase in risk aversion as the European debt crisis deepened. Since then, liquidity in the N.D.F. market has improved significantly, with much lower bid–ask spreads and narrower deviations from the C.N.Y. market. Moreover, the value of an N.D.F. can reflect pressure on C.N.Y. appreciation or depreciation (Liang & Gao, Citation2012). This is particularly apparent in the cross-border flows of investment and trade in emerging economies (Wang et al., Citation2014). For C.N.Y. outflows, Chinese firms were allowed to apply to take the C.N.Y. offshore for direct overseas investment beginning in January 2011, and Chinese banks were allowed to extend C.N.Y. loans to domestic enterprises approved for overseas investment beginning in March 2012. After the China Development Bank and the Ministry of Finance began issuing offshore C.N.Y. bonds, eligible candidates for such issuances were expanded to onshore non-financial corporations in May 2012. Furthermore, the daily trading band for the U.S.D. was increased in April 2012 and then again in March 2014. The band was widened again in 2015. After the exchange rate band-widening moves in 2012, 2014 and 2015, greater flexibility in the onshore exchange rate would plausibly cause offshore N.D.F. markets. This may be the reason that the N.D.F. market had a relatively high wavelet power during the years 2011–2014 and 2015.
In general, the wavelet power spectrums yield consistent results with the time plots, reflecting several increases and falls in the C.N.Y. and N.D.F. markets within the sample period. However, we could not examine the co-movements and lead-lag relationships, which can indicate causality, between the two markets using the wavelet power spectrums. Therefore, we resorted to wavelet coherency and phase differences between the two markets, with the results of the estimation shown in . The correlated regions inside the C.O.I. and above the 10% significance level do not provide reliable indications of co-movement and causality.
Figure 3. The wavelet coherency (a.1) and frequency band (a.2–a.3) between the D.C.N.Y and D.N.D.F.1M. The y-axis refers to the frequencies (measured in years); the x-axis refers to the time period from 2009 to 2016. The color bar on the right side corresponds to the strength of the correlation at each frequency.
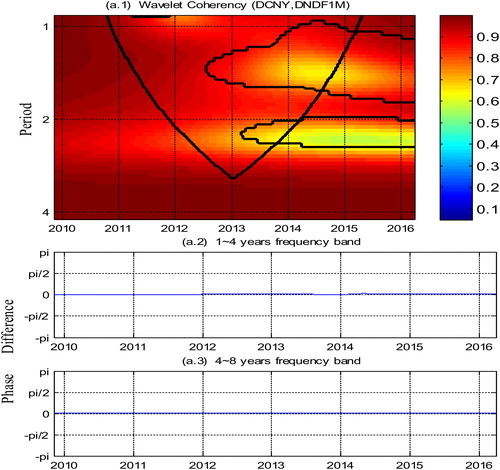
shows positive and strong co-movements between the C.N.Y. and N.D.F. markets in some sub-samples. The co-movements, however, do depend on frequency and are unstable over the period from 2009 to 2016. More specifically, from 2012 to 2015, we observed positive co-movements scattered across the 1- to 2-year frequency band, with an average coherency of 0.9 and an in-phase relationship indicated by a phase difference between 0 and From 2013 to 2014, the two variables indicate an average coherency of 0.9 across the 1- to 3-year frequency band, with an in-phase relationship indicated by a phase difference between 0 and
implying a high degree of co-movement despite frequent boom-bust fluctuations in the two markets during these periods. These findings support the existence of time and frequency-varying features in the correlations between the C.N.Y. and N.D.F. markets. This result is largely consistent with the findings of Owyong et al. (Citation2015), which indicates that stronger causality runs from the onshore spot markets to the offshore forward markets. According to the model developed by Callen et al. (Citation1989), if exchange rate markets are efficient, then spot rates have no effect on predicting forward rates. The results of this article indicate that the exchange rate markets in China are not efficient, namely, that onshore spot rates caused offshore N.D.F. rates during the years from 2012 to 2015 and from 2013 to 2014.
This may be due to several factors. One factor is the Chinese government’s marketisation policy on the C.N.Y. In October 2011, administrative rules were introduced for foreign firms undertaking direct foreign investments in the C.N.Y. An additional channel for the C.N.Y. to flow back to China was opened when the C.N.Y. Qualified Foreign Institutional Investor scheme was rolled out in December 2011. For C.N.Y. outflows, Chinese firms were allowed to apply to take the C.N.Y. offshore for direct overseas investment beginning in January 2011, and Chinese banks were allowed to extend C.N.Y. loans to domestic enterprises approved for overseas investment as of March 2012. The fixing of the interbank interest rate for the C.N.Y., the first offshore C.N.Y. interest rate benchmark, was introduced in June 2013 with the aim of facilitating the development of C.N.Y. products, such as syndicated loans and cross-currency swaps. Under this scheme, Hong Kong-based brokerage firms can, subject to an aggregate quota, offer non-Chinese residents C.N.Y. investment products that are invested in onshore bond and stock markets. Furthermore, Chinese authorities widened the daily foreign exchange trading band to enhance the exchange rate flexibility. The P.B.C. sets the opening quotes for foreign rates based on previous exchange rate data and allows a narrow range of daily fluctuation (Funke et al., Citation2015). For example, the daily trading band for the U.S.D. has been progressively widened since then, in April 2012 and then in March 2014, and this trading band was once again widened in August 2015 (Funke et al., Citation2015). The P.B.C. is concerned about the movement of the C.N.Y. exchange rates. It has attempted to influence expectations, smooth volatility, and control the direction of the exchange rate through spot market interventions using foreign exchange reserves (Ding et al., Citation2014). Thus, the onshore market for the C.N.Y. faces restrictions and controls by the P.B.C. (Owyong et al., Citation2015).
Another significant reason is that China’s currency policy over the last few years has focused on the internationalisation of the C.N.Y. In June 2012, all Chinese firms and all current account transactions became eligible to invoice and settle in the C.N.Y. It took just a few years for the quarterly volume of cross-border C.N.Y. settlements to grow from scratch to a total of approximately C.N.Y. 470 billion in the fourth quarter of 2013. Hong Kong’s C.N.Y. banking business expanded from personal deposits to bonds, trade credit and project financing as well as to interbank trading (Funke et al., Citation2015). In addition to these new channels for cross-border C.N.Y. flows, technical measures enhanced market development. The Hong Kong Special Administrative Region (H.K.S.A.R.) produced a second set of spot and forward exchange rates for delivery of the C.N.Y. against the U.S.D. outside China. A second set of C.N.Y. yield curves was also formed with active bond issuance by the Chinese Ministry of Finance and firms from both inside and outside China. C.N.Y. offshore centers have also now opened in London, Singapore and other locations. Both the C.N.Y. and N.D.F. markets have closely followed the same broad trend from 2010 to 2015 (Shu et al., Citation2015).
These marketisation and internationalisation approaches are expected to materially affect the interrelationships between the two markets because of the enhancement of exchange rate flexibility in the onshore spot market. Furthermore, the evolution of forward exchange rate markets, which are considered a gauge of the anticipated direction of a currency value change, is closely monitored by a diverse range of economic agents (Diamandis, Georgoutsos, & Kouretas, Citation2008). The greater onshore spot market flexibility will also help to transmit onshore information overseas through price movements, thereby strengthening the signaling function of the onshore spot market to participants abroad. Given the frequent intervention of Chinese authorities and the greater influence they wield over the onshore spot market, as the onshore spot market becomes more flexible, it will better reflect the same market forces that drive offshore markets. This implies a stronger causal effect running from the onshore spot market to the offshore N.D.F. market, and it may be the reason for the positive and strong co-movement between the C.N.Y. and N.D.F. markets during the years 2012–2015 and 2013–2014.
In summary, in this article, we did not identify any stable causality during the sample period. Rather, the above results provide robust evidence that the co-movement between the C.N.Y. and N.D.F. markets indeed varies across frequencies and evolves over time. From the frequency domain, the causal effects that exist between the two markets are generally across higher frequencies (i.e., short term). The identification of the co-movements between the two markets at different frequencies is clearly pivotal for investors. It suggests that investors with different investment horizons should pay more attention to the co-movements at corresponding frequencies to allocate their assets more effectively. Thus, market performance forecasts should focus on short time horizons to enhance forecasting accuracy for investors and policymakers.
In the time domain, the time-varying nature of long-run causalities between the C.N.Y. and N.D.F. markets implies structural changes in the two markets. We observed these structural changes, in terms of a short-term shift in the relationship between the two markets, intuitively from the partial phase difference at the 0.5 to three-year frequency band in . From 2009 to 2016, due to structural changes, the time-varying wavelet analysis (Especially in ) further confirmed the results of parameter stability tests (e.g., and ), for which full-sample causality tests (e.g., ) with assumptions of parameter constancy and a causal relationship across the whole sample period are no longer reliable. Thus, there is not a long-term equilibrium relationship between the two markets. According to the model developed by Callen et al. (Citation1989), in efficient exchange rate markets, spot rates do not cause forward rates. Our results indicate that there is stronger nonlinear causality running from the onshore spot market to the offshore N.D.F. market during some short periods (e.g., the years 2012–2015 and 2013–2014). The results of this article show that the exchange rate markets in China are not efficient. Ties between the onshore spot and offshore N.D.F. markets are closer after the widening of the onshore trading band, first in April 2012, second in March 2014 and further in August 2015. Therefore, developments in the onshore spot market could sometimes influence the offshore N.D.F. market.
Understanding these issues is important for policy. This suggests that domestic market participants have an informational edge over those in the N.D.F. markets, but only over the short term. In some short-term periods, information regarding central bank moves, policy changes, and other transient factors may draw more attention and hence give the domestic market an advantage. This has led monetary policymakers to conjecture that price movements in the N.D.F. market could be a useful tool to monitor market expectations and uncover information about percolating pressures on an exchange rate regime that may not be fully manifested through the traditional tools that are available in a country with capital controls. On the one hand, pricing uncertainties reflected by the different pricing signals of the two markets may increase the volatility of the onshore spot market, even with the presence of the central bank. On the other hand, the differential has implications for financial stability and the implementation of monetary policies. Arbitrage opportunities created by the differential induce cross-border fund flows. Because China’s capital is not yet fully liberalised, such flows often take place in informal channels, making it harder for authorities to assess monetary conditions and the risk exposure of banks and non-bank corporates. These are clearly concerns for Chinese policymakers who seek to promote the internationalisation of the C.N.Y. but would meanwhile prefer to avoid excessive exchange rate volatility. These findings imply that offshore market development is not divorced from developments onshore. Thus, to successfully internationalise the C.N.Y., financial deepening of the onshore spot markets should keep pace with the growing offshore N.D.F. market.
6. Conclusion
This study investigated the relationship between the onshore spot market and the offshore N.D.F. market from 2009 to 2016 in China by employing a time-varying wavelet analysis. The results suggest several findings. The first is that the C.N.Y. market is not statistically significant. We found that China’s onshore C.N.Y. markets are regulated under a de facto political connections-based regime, which can be used to explain the consistent, stable performance of onshore C.N.Y. markets. The second is the relatively high wavelet power of the N.D.F. market from 2011 to 2015, which is reflected in the increasing number of offshore foreign exchange transactions in N.D.F. markets. Finally, there is no stable causality between the C.N.Y. and N.D.F. markets during the sample period, which is due to the Chinese government’s marketisation and the P.B.C.’s currency policies. However, in some sub-samples, we found that there is a strong nonlinear causal relationship running from the C.N.Y. to the N.D.F. market, which indeed demonstrates that the co-movement varies across frequencies and evolves over time. Ties between the two markets are closer after the widening of the onshore trading band, first in April 2012, second in March 2014 and finally in August 2015. Therefore, developments in the C.N.Y. market could influence the N.D.F. market in terms of both level and volatility in the short term. These findings imply that offshore market development is not divorced from developments onshore.
Understanding these issues is essential for policymaking. First, in the short term, domestic market participants have an informational edge over those in the N.D.F. market. This has led monetary policymakers to conjecture that price movements in the N.D.F. market could be an effective tool to monitor market expectations and uncover information about percolating pressures on exchange rate regimes. Second, the differences between the onshore and offshore markets may result in arbitrage opportunities that trigger cross-border capital flows. Because China has not fully liberalised its capital, such flows make it harder for the authorities to assess monetary conditions and the risk exposure of banks and non-bank corporations. These findings imply that offshore market development is not divorced from developments onshore. Thus, to successfully internationalise the C.N.Y., financial deepening of onshore spot markets should keep pace with the growing offshore N.D.F. market.
Notes
1 Feature extraction simplifies the resources required to describe a large set of data accurately. If we carefully choose the features to extract and then use this reduced representation instead of the full-sized input, the feature set will provide the relevant information from the input data to perform the desired task. The self-similarity of a time series means the series exhibits long-term dependence (i.e., the whole series possesses the same shape, such as wave and cycle, as one or more of its parts). By taking advantage of feature extraction and self-similarity detection, the C.W.T. extracts the local amplitudes of a time series (e.g., business cycle series) in time and frequency domains. Then, the ensuing wavelet coherency and phase difference tools measure whether and how the local amplitudes of the two time series correlate and which one leads.
2 Without smoothing, the squared wavelet coherence would always equal 1 at any frequency and time. Smoothing is achieved by convolution in time and frequency; see Torrence and Compo (Citation1998) for details.
3 Following Torrence and Compo (Citation1998) and Grinsted et al. (Citation2004), the C.W.T. assumes that the time series are cyclical. When transforming and plotting wavelets for the series with finite length, the amplitudes inside the C.O.I. drop by the factor e−2 due to zero padding at the edge. In addition, the edge effects are inversely proportional to the frequency. Therefore, we must pay special attention to not misread the results inside the C.O.I.
References
- Aguiar-Conraria, L., Azevedo, N., & Soares, M. J. (2008). Using wavelets to decompose the time–frequency effects of monetary policy. Physica A: Statistical Mechanics and Its Applications, 387(12), 2863–2878. doi: 10.1016/j.physa.2008.01.063
- Aguiar-Conraria, L., & Soares, M. J. (2014). The continuous wavelet transform: Moving beyond uni-and bivariate analysis. Journal of Economic Surveys, 28(2), 344–375. doi: 10.1111/joes.12012
- Andrews, D. W. (1993). Tests for parameter instability and structural change with unknown change point. Econometrica: Journal of the Econometric Society, 61(4), 821–856. doi: 10.2307/2951764
- Andrews, D. W., & Ploberger, W. (1994). Optimal tests when a nuisance parameter is present only under the alternative. Econometrica: Journal of the Econometric Society, 62(6), 1383–1414. doi: 10.2307/2951753
- Balcilar, M., Ozdemir, Z. A., & Arslanturk, Y. (2010). Economic growth and energy consumption causal nexus viewed through a bootstrap rolling window. Energy Economics, 32(6), 1398–1410. doi: 10.1016/j.eneco.2010.05.015
- Balcilar, M., & Ozdemir, Z. A. (2013). The export-output growth nexus in Japan: A bootstrap rolling window approach. Empirical Economics, 44(2), 639–660. doi: 10.1007/s00181-012-0562-8
- Bloomfield, D. S., McAteer, R. J., Lites, B. W., Judge, P. G., Mathioudakis, M., & Keenan, F. P. (2004). Wavelet phase coherence analysis: Application to a quiet-sun magnetic element. The Astrophysical Journal, 617(1), 623–632. doi: 10.1086/425300
- Burdekin, R. C. K., & Tao, R. (2017). An empirical examination of factors driving the offshore renminbi market. China Economic Journal, 10(3), 287–304. doi: 10.1080/17538963.2017.1370093
- Cadarajat, Y., & Lubis, A. (2012). Offshore and onshore IDR market: An evidence on information spillover. Buletin Ekonomi Moneter Dan Perbankan, 14(4), 323–348. doi: 10.21098/bemp.v14i4.363
- Callen, J. L., Chan, M. W., & Kwan, C. C. (1989). Spot and forward exchange rates: A causality analysis. Journal of Business Finance & Accounting, 16(1), 105–118. doi: 10.1111/j.1468-5957.1989.tb00007.x
- Chen, R., Gong, J., & Zheng, Z. (2009). Information Flows across Non-Deliverable Forwards, Deliverable Forwards and Spot Markets: Evidence from Korean Won and Rmb. 2009 International Conference on Management and Service Science.
- Chadha, B. (2017). Understanding non-deliverable forward (NDF) markets and NDF volatility spillover to on-shore Indian Rupee Markets. International Journal of Applied Business and Economic Research, 15, 39–53.
- Cheung, Y. W., Steinkamp, S., & Westermann, F. (2016). China’s capital flight: Pre-and post-crisis experiences. Journal of International Money and Finance, 66, 88–112. doi: 10.1016/j.jimonfin.2015.12.009
- Cheung, Y. W., & Yiu, M. S. (2016). Offshore renminbi trading: Findings from the 2013 BIS Triennial Central Bank Survey. NKIMR Working Paper, 14
- Dickey, D. A., & Fuller, W. A. (1981). Likelihood ratio statistics for autoregressive time series with a unit root. Econometrica, 49(4), 1057–1072. doi: 10.2307/1912517
- Ding, D. K., Tse, Y., & Williams, M. R. (2014). The price discovery puzzle in offshore Yuan trading: Different contributions for different contracts. Journal of Futures Markets, 34(2), 103–123.
- Diamandis, P. F., Georgoutsos, D. A., & Kouretas, G. P. (2008). Testing the forward rate unbiasedness hypothesis during the 1920s. Journal of International Financial Markets, Institutions and Money, 18(4), 358–373. doi: 10.1016/j.intfin.2007.04.003
- Doukas, J. A., & Zhang, H. (2013). The performance of NDF carry trades. Journal of International Money and Finance, 36, 172–190. doi: 10.1016/j.jimonfin.2013.04.003
- Fratzscher, M., & Mehl, A. (2014). China’s dominance hypothesis and the emergence of a tri-polar global currency system. The Economic Journal, 124(581), 1343–1370. doi: 10.1111/ecoj.12098
- Funke, M., Shu, C., Cheng, X., & Eraslan, S. (2015). Assessing the CNH–CNY pricing differential: Role of fundamentals, contagion and policy. Journal of International Money and Finance, 59, 245–262. doi: 10.1016/j.jimonfin.2015.07.008
- Gardner, L. A. (1969). On detecting changes in the mean of normal variables. The Annals of Mathematical Statistics, 40(1), 116–126. doi: 10.1214/aoms/1177697808
- Grinsted, A., Moore, J. C., & Jevrejeva, S. (2004). Application of the cross wavelet transform and wavelet coherence to geophysical time series. Nonlinear Processes in Geophysics, 11(5/6), 561–566. doi: 10.5194/npg-11-561-2004
- Grossmann, A., & Morlet, J. (1984). Decomposition of Hardy functions into square integrable wavelets of constant shape. SIAM Journal on Mathematical Analysis, 15(4), 723–736. doi: 10.1137/0515056
- Guru, A. (2009). Non-deliverable forwards market for Indian rupee: An empirical study. Indian Journal of Economics and Business, 8(2), 245–260.
- Gu, L., & McNelis, P. D. (2013). Yen/Dollar volatility and Chinese fear of floating: Pressures from the NDF market. Pacific-Basin Finance Journal, 22, 37–49. doi: 10.1016/j.pacfin.2012.09.002
- Hanson, B. E. (2002). Tests for parameter instability in regressions with I (1) processes. Journal of Business & Economic Statistics, 20(1), 45–59. doi: 10.1198/073500102753410381
- Huang, X., & Wu, C. (2006). The interaction between the RMB offshore NDF and onshore spot rate: Before and after the foreign exchange reform. Journal of Financial Research, 11, 83–89.
- Hudgins, L., Friehe, C. A., & Mayer, M. E. (1993). Wavelet transforms and atmopsheric turbulence. Physical Review Letters, 71(20), 3279–3282. doi: 10.1103/PhysRevLett.71.3279
- Huszar, Z. R., Zhang, W., & Tan, R. S. K. (2015). Efficiency of regulated and unregulated FOREX markets: An analysis of onshore and offshore renminbi forward markets. International Finance Review, 17, 371–392.
- Jiang, C., Chang, T., & Li, X. L. (2015). Money growth and inflation in China: New evidence from a wavelet analysis. International Review of Economics and Finance, 35, 249–261. doi: 10.1016/j.iref.2014.10.005
- Keefe, H. G., & Rengifo, E. W. (2015). Options and central bank currency market intervention: The case of Colombia. Emerging Markets Review, 23, 1–25. doi: 10.1016/j.ememar.2015.04.011
- Kong, L., & Shao, W. (2010). An empirical study on the relationship between NDF and DF. 2010 2nd IEEE International Conference on Information Management and Engineering.
- Liang, J., & Gao, Y. (2012). Calibration of implied volatility for the exchange rate for the Chinese Yuan from its derivatives. Economic Modelling, 29(4), 1278–1285. doi: 10.1016/j.econmod.2012.03.026
- Loh, L. (2013). Co-movement of Asia-Pacific with European and US stock market returns: A cross-time-frequency analysis. Research in International Business and Finance, 29, 1–13. doi: 10.1016/j.ribaf.2013.01.001
- Ma, G., Ho, C., & McCauley, R. N. (2004). The markets for non-deliverable forwards in Asian currencies. BIS Quarterly Review, 1, 81–94.
- McCauley, R., & Shu, C. (2016). Non-deliverable forwards: Impact of currency internationalisation and derivatives reform. BIS Quarterly Review, 81–93.
- Misra, S., & Behera, H. (2006). Non deliverable foreign exchange forward market: An overview. Reserve Bank of India Occasional Papers, 27(3), 25–55.
- Nyblom, J. (1989). Testing for the constancy of parameters over time. Journal of the American Statistical Association, 84(405), 223–230. doi: 10.1080/01621459.1989.10478759
- Owyong, D., Wong, W. K., & Horowitz, I. (2015). Cointegration and causality among the onshore and offshore markets for China’s currency. Journal of Asian Economics, 41, 20–38. doi: 10.1016/j.asieco.2015.10.004
- Park, J. (2001). Information flows between non-deliverable forward (NDF) and spot markets: Evidence from Korean currency. Pacific-Basin Finance Journal, 9(4), 363–377. doi: 10.1016/S0927-538X(01)00012-9
- Park, D., & Rhee, C. (2001). Measuring the degree of currency misalignment using offshore forward exchange rates: The case of the Korean financial crisis. Journal of Asset Management, 2(1), 84–95. doi: 10.1057/palgrave.jam.2240037
- Peng, W., Shu, C., & Yip, R. (2007). Renminbi derivatives: Recent development and issues. China & World Economy, 15(5), 1–17. doi: 10.1111/j.1749-124X.2007.00082.x
- Phillips, P. C., & Perron, P. (1988). Testing for a unit root in time series regression. Biometrika, 75(2), 335–346. doi: 10.2307/2336182
- Roueff, F., & Von Sachs, R. (2011). Locally stationary long memory estimation. Stochastic Processes and Their Applications, 121(4), 813–844. doi: 10.1016/j.spa.2010.12.004
- Shu, C., He, D., & Cheng, X. (2015). One currency, two markets: The renminbi's growing influence in Asia-Pacific. China Economic Review, 33, 163–178. doi: 10.1016/j.chieco.2015.01.013
- Subramanian, A., & Kessler, M. (2013). The Renminbi Bloc is Here: Asia down, rest of the world to go? Journal of Globalization and Development, 4(1), 49–94. doi: 10.1515/jgd-2013-0017
- Saravanan, A., & Shanmugam, V. P. (2017). An empirical analysis of the interrelation between spot market & non-deliverable forward market of USD/INR in the pre- and post-currency futures era. Elk Asia Pacific Journal of Finance and Risk Management, 5, 115–125. doi: 10.16962/EAPJFRM/issn.2349-2325/2014/V5I4.01
- Shukur, G., & Mantalos, P. (1997). Size and Power of the RESET Test as Applied to Systems of Equations: A Bootstrap Approach. Working paper, Department of Statistics, University of Lund, Sweden.
- Tian, L., & Chen, L. (2013). A reinvestigation of the new RMB exchange rate regime. China Economic Review, 24, 16–25. doi: 10.1016/j.chieco.2012.09.006
- Tiwari, A. K., Mutascu, M., & Andries, A. M. (2013). Decomposing time-frequency relationship between producer price and consumer price indices in Romania through wavelet analysis. Economic Modelling, 31, 151–159. doi: 10.1016/j.econmod.2012.11.057
- Torrence, C., & Compo, G. P. (1998). A practical guide to wavelet analysis. Bulletin of the American Meteorological Society, 79(1), 61–78. doi: 10.1175/1520-0477(1998)079<0061:APGTWA>2.0.CO;2
- Torrence, C., & Webster, P. J. (1999). Interdecadal changes in the ENSO-monsoon system. Journal of Climate, 12(8), 2679–2690. doi: 10.1175/1520-0442(1999)012<2679:ICITEM>2.0.CO;2
- Vanitha, S., & Kavipriya, U. (2016). An empirical analysis of information flows between non deliverable forward and spot market of PHP/KRW-USD in Asian currency market. International Journal of Advanced Scientific Research & Development, 3(2), 122–132.
- Wang, K. L., Fawson, C., Chen, M. L., & Wu, A. C. (2014). Characterizing information flows among spot, deliverable forward and non-deliverable forward exchange rate markets: A cross-country comparison. Pacific-Basin Finance Journal, 27, 115–137. doi: 10.1016/j.pacfin.2014.01.002
- Wang, X., Yang, J. H., Wang, K. L., & Fawson, C. (2017). Dynamic information spillovers in intraregionally focused spot and forward currency markets. Journal of International Money and Finance, 71, 78–110. doi: 10.1016/j.jimonfin.2016.11.002
- Xu, H. C., Zhou, W. X., & Sornette, D. (2017). Time-dependent lead-lag relationship between the onshore and offshore Renminbi exchange rates. Journal of International Financial Markets, Institutions & Money, 49, 173–183. doi: 10.1016/j.intfin.2017.05.001
- Yang, J., & Leatham, D. J. (2001). Currency convertibility and linkage between Chinese official and swap market exchange rates. Contemporary Economic Policy, 19(3), 347–359. doi: 10.1093/cep/19.3.347
- Zeileis, A., Leisch, F., Kleiber, C., & Hornik, K. (2005). Monitoring structural change in dynamic econometric models. Journal of Applied Econometrics, 20(1), 99–121. doi: 10.1002/jae.776