
 ?Mathematical formulae have been encoded as MathML and are displayed in this HTML version using MathJax in order to improve their display. Uncheck the box to turn MathJax off. This feature requires Javascript. Click on a formula to zoom.
Abstract
This paper aims to assess whether the purchasing power parity (PPP) holds by examining the dynamic link between nominal exchange rate (NER) and relative consumer price (RCP) in China. With economic transitions and structural changes existing, we discover that by using full sample data the PPP does not hold. Consequently, we apply the rolling window causality method in order to reconsider the dynamic causal link, and as a result we observe NER having both positive and negative impacts on RCP in some sub-periods. However, RCP has no effect on the NER, meaning that the PPP does not hold. Trade cost, restrictions and imperfect competition are considered in explaining the deviations in some sub-sample periods. Therefore, this empirical result has important implications for stakeholders to distinguish factors that bring about the PPP deviations and further offers policy suggestions for the Chinese monetary authority.
1. Introduction
The intent of this paper is to investigate whether the purchasing power parity (PPP) condition fits for China. The PPP emphasises that different national price levels should be equal when expressed in a common currency. The validity of the PPP is an indication of whether two countries are financially integrated or not. Moreover, the PPP condition between nominal exchange rate (NER) and relative consumer price (RCP) is used to measure the long-run equilibrium value of the currency. Therefore, the PPP offers a basis for evaluating the effectiveness of the foreign exchange market. However, NER always deviates from the PPP. In China, with the internationalisation of the Renminbi (RMB) deepening in a decade, the volatility of the RMB exchange rate may severely affect economic development. Yi (Citation2013) proves that exchange rate fluctuations have a significant influence on producer price and consumer price through imports. Vieira, Holland, Silva, and Bottecchia, (Citation2013) reveal that highly fluctuating exchange rates have negative impacts on economic growth. Su, Zhang, Chang, and Nian, (Citation2016) assess the impact on exchange rates of inflation during the economic crisis. Therefore, the People’s Bank of China (PBOC) chooses discreet monetary policies when decreasing the negative influence from deviations. The PPP condition between RCP and NER forward premiums or discounts does not only provide a basis for the evaluation of the effectiveness of monetary policy but offers as well suggestions to promote NER mechanism reform.
Since 2005, China has experienced the following striking shocks both from inside and outside. The PBOC launched the reform of the RMB exchange rate regime by switching from the dollar peg to a basket of currencies in 2005:M07. Meanwhile, the PBOC also allow the bilateral exchange rates to float within a daily band from 0.3% to 2%. (Cui, Citation2015) indicates that the reform increases the flexibility of the RMB exchange rate. The effects of the global financial crisis are widespread, which obviously impacts on the Chinese economy, affecting exports and the NER and inducing the need for structural adjustments. The RMB is included in Special Drawing Rights (SDR) by the International Monetary Fund (IMF) in 2016 denoting a substantial progress in internationalisation and liberalisation of the RMB (Xu et al., Citation2015). All the incidents mentioned above may bring structural changes in the NER and result in the NER deviating from the PPP. Consequently, there is an imminent concern regarding whether the PPP still fits for China. If the PPP holds, the higher domestic inflation rate will result in a RMB exchange rate depreciation in the future. Meanwhile, keeping price stability is one of the main goals for the PBOC, which is greatly motivated to pursue an investigation, related to the PPP condition between the RCP and the NER in China. Combined with corresponding results, we provide suggestions for reforming the NER mechanism and implementing a discreet monetary policy.
Substantial studies have been undertaken with focus on the PPP. However, the empirical researches have not reached a consensus on whether the PPP holds or not. Engel and Rogers (Citation2004) argue that in a flexible exchange rate regime, volatile movements in nominal exchange rates due to speculative short-term capital flows might lead to frequent currency misalignments that makes PPP equilibrium harder to achieve. Paya and Peel (Citation2005, Paya & Peel, Citation2007) provide an explanation of the PPP deviations through the linear and non-linear exponential smooth transition (ESTAR) model. Lee and Chou (Citation2013) find the PPP is not established for G20 countries during the period from 1994:M06-2010:M04. Huang and Yang (Citation2015) find weaker evidence for PPP following the launch of the Euro in European countries with the panel unit root test. Ma, Li, and Park, (Citation2017) argue the PPP hypothesis is not strongly supported for Japan, Korea and China through the conventional unit root test. However, many researchers argue the PPP is valid. Chang, Chang, Su, and Lee, (Citation2012) indicate the PPP holds for most East Asian countries including Japan and South Korea. Bahmani-Oskooee, Chang, Cheng, and Wu, (Citation2015) apply the sequential panel selection method to test the PPP in six major oil exporting countries and the results support the PPP in these countries except for Russia. Lothian (Citation2016) shows the PPP, as a long-run proposition, is indeed a precise and useful approximation. Bahmani-Oskooee, Chang, and Lee, (Citation2016) apply a panel stationary test to examine the PPP in 11 emerging countries and find it holds. Vasconcelos and Júnior (Citation2016) examine the PPP in the context of unit root tests and find that deviations exist for most Latin American countries. Jiang, Jian, Liu, and Su, (Citation2016) apply a non-linear threshold unit root test to investigate the validity of the PPP and find it holds true for seven Central Eastern European countries.
Because of China’s ‘immunological strength’ to global financial contagion and also the ever-growing economy under a strictly managed exchange regime, the RMB exchange rate regime reforms have attracted a great deal of attention from researchers, investors and a wider public (Qin, Lu, Zhou, & Qu, Citation2015). Chen, Chang, Zhang, and Lee, (Citation2011) indicate the PPP holds true for China, and the adjustment towards the PPP is non-linear. Arize (Citation2011) finds the long-run PPP to be accurate; thus, the PPP is a suitable guide for exchange rate determination and exchange rate policy reform in China. Chang (Citation2012) provides strong support for the PPP in China relative to her major trading partner countries. Su, Chang, Chang, and Lee, (Citation2012) indicate that PPP holds true for all of the BRICs countries (i.e., Brazil, Russia, India, China and South Africa). Ma et al., (Citation2017) indicate that when the quantile-based approach is used, the PPP hypothesis holds for China at some quantile levels. However, many researchers hold opposite standpoints. Lee (Citation1999) finds there is little support for a long-run relationship between exchange rate and price ratio in Taiwan. Dai, Yang, and Liu, (Citation2015) show the fluctuations of the RMB exchange rate cannot meet the PPP and deviate from it.
This paper intends to be of a valuable addition to the existing literature by taking into account the time variation in the PPP condition between RCP and NER. Commonly, the previous researches just investigated the causal link under the full sample, which is liable to give inaccurate conclusions since the parameters may present instability when faced with structural changes. China experienced obvious economic reconstruction and structural changes from 2005 to 2016, producing a deep ripple effect reaching down to its economic fundamentals. Overholt (Citation2010) indicates that prior to the global financial crisis in 2008, China underwent a paradoxical combination of rapidly rising inflation and spreading bankruptcies. Zhao, Xie, Fang, and Tian, (Citation2013) show that under the influence of the European debt crisis in 2011, terms of trade in China improved while assets prices and inflation increased modestly. Ho, Zhang, and Zhou, (Citation2014) argue there are obvious responses of Chinese NER and interest rate to U.S. monetary policies, such as quantitative easing policies in 2008, 2010 and 2012, respectively. Qin et al., (Citation2015) find the first RMB regime reform undertaken in 2005:M07 has had a significant impact on the exchange market in the short term. All the above analysis shows structural changes in domestic interest rate and NER, which further indicates that such dynamic linkage existing among the two series would clearly display instability varying across sub-samples. Therefore, the bootstrap Granger full-sample causality test and sub-sample rolling-window estimation are applied to revisit the PPP condition between the RCP and the NER. The bootstrap rolling-window method is different from previous methods which cannot distinguish full-sample and sub-sample relationship changes over time. When meeting structural changes, the causal linkage between these two variables may not be accurate in previous studies (Balcilar & Ozdemir, Citation2013). This can be solved by assuming a time varying causal link with single causality holding in every sub-interval. The time-varying character may exist in the causal nexus, which has been taken into account in this paper. The test for causality on the full sample is carried out under the assumption that the causal relationship is fixed. We test for causality on the rolling sample, which captures structural changes in the model and the evolution of causality between sub-periods. The results show that there is a unidirectional causal relationship between RCP and NER with sub-sample rolling-window estimation. The NER has both positive and negative impact on the RCP in several sub-periods, but the RCP has no effects on the NER. However, the PPP does not hold under influence of both external and internal shocks. Therefore, policymakers must take into consideration specific backgrounds (e.g., economic situation, monetary policies), moderately make use of monetary policy, in order to reduce negative influence from the NER on the Chinese economy.
The rest of this paper is organised as follows: Section 2 introduces purchasing power parity. Section 3 provides the methodology. Section 4 describes the data. Section 5 analyses the empirical results and gives policy implications. Section 6 drives conclusions.
2. Purchasing power parity
According to Cheung and Lai (Citation1993), the PPP is the cornerstone for any model examining the long-run exchange rate movements and is written as:
(1)
(1)
where
is a constant,
is NER.
and
represent consumer prices indexes of China and the U.S., respectively.
is an error term. The long-run proportionality between exchage rates and prices infers
. The PPP can be motivated by the presence of measurement errors in prices (Taylor, Citation1988). We assume the PPP fits for the following Equation:
(2)
(2)
where
is a stationary process. Following the above equation,
is determined by
. When Chinese consumer prices rise, the purchasing power of its currency will fall, which further leads to devaluation. That means a unit U.S. dollar can exchange more RMB. In contrast, when foreign consumer prices rise, the domestic purchasing power would be strengthened and fewer RMB can exchage a unit U.S. dollar.
3. Methodology
3.1. Bootstrap full-sample causality test
Granger causality statistics rely on the stationarity of time series. If this precondition cannot hold, the time series may not follow standard asymptotic distributions, making it difficult to evaluate the vector autoregression (VAR) models (Sims, Stock, & Watson, Citation1990; Toda & Phillips, Citation1993, Toda & Phillips, Citation1994). The modified Wald test is estimated by using Monte Carlo simulations (Shukur & Mantalos, Citation1997), but gives unreliable results especially in small- and medium-sized samples. Compared with the modified Wald test, critical values can be improved by using the residual-based bootstrap (RB) method (Shukur & Mantalos, Citation1997) which has been proven to perform well in standard asymptotic tests through Monte Carlo simulation (Mantalos & Shukur, Citation1998). However, Shukur and Mantalos (Citation2000) further show that the likelihood ratio (LR) test performs even better in small samples. Combined with the above conclusions, this paper chooses the RB-based modified-LR statistic to revisit the causal relationship between RCP and NER.
In terms of the RB-based modified-LR causality test, the bivariate VAR (p) process can be constructed as follows:
(3)
(3)
where
is a zero mean, independent, white noise process with non-singular covariance matrix
. Schwarz Information Criteria (SIC) is selected to determine the optimal lag length p in this paper.
and L is the lag operator defined as
.
From EquationEquation (3)(3)
(3) , we assume the null hypothesis that NER does not Granger cause RCP and is tested with the restriction,
for
. In the same way, the null hypothesis that RCP does not Granger cause NER is tested with the restriction,
for
. As previously debated, the RB-based modified-LR statistic is utilised to investigate the causal link under the full sample. If one of the null hypotheses is rejected, it shows there is a unidirectional causality. When both hypotheses are rejected, the two variables can affect each other. However, no causal link would exist while the hypotheses are accepted.
3.2. Parameter stability test
The assumption that parameters in the VAR model are fixed may be false when meeting structural changes in the full sampl, leading to causal link instability (Balcilar & Ozdemir, Citation2013). Granger (Citation1996) has emphasised the importance of solving the precondition of constant parameters. Based on this, Andrews and Ploberger (Citation1994) utilise Sup-F, Mean-F and Exp-F to investigate the short-term parameters in every sub-interval. In general, the VAR model can only be constructed by underlying variables that are cointegrated in levels. Regardless, underlying variables that are cointegrated in levels require the VAR model to allow for error correction in order to be correctly specified. Therefore, it is essential to take into consideratio parameter stability. The parameter of cointegration regression is estimated by either modified ordinary least square (FM-OLS) (Hansen, Citation1999) or Lc test (Nyblom, Citation1989; Hansen, Citation1999). Meanwhile, parameter stability can also be examined by Lc test. These methods are proposed to verify whether structural breaks exist in time series and whether they can lead to parameters instability. Andrews and Ploberger (Citation1994) utilise a parametric bootstrap procedure to estimate critical values and p-values.
3.3. Sub-sample rolling-window causality test
In terms of the above analysis, it is necessary to use the rolling-window bootstrap method proposed by Balcilar, Ozdemir, and Arslanturk, (Citation2010). Two advantages of using this method should be noted. First, a rolling window is applicable when the causal link between variables is time varying. Secondly, since structural changes exist, a rolling method is unstable in different sub-samples. The rolling-window bootstrap method is grounded on fixed-size sub-samples rolling unceasingly from start to end of the full sample. In particular, when given a fixed-size rolling window including m observations, the full sample is constituted with T-m sub-samples that include -m + 1,
-m, …, T for
=m, m + 1, …, T. Then, every sub-interval can be investigated by a RB-based modified-LR causality test. Potential changes can be distinguished through computing the p-values of observed LR statistics.
and
represent influence from RCP and NER, separately.
and
are bootstrap estimates from EquationEquation (3)
(3)
(3) .
shows the bootstrap repetitions. The 90% confidence intervals are also estimated, for which the lower and upper limits equal the 5th and 95th quantiles of each of the
and
, respectively.
The main problem of the sub-sample rolling-window causality test is the determination of an optimal window size. On the one hand, to ensure accuracy the window size needs to be large enough; one the other hand representativeness requires a small window size. Since the two objectives are contradictory, it is essential to choose a suitable number of observations to achieve balance between them. Pesaran and Timmermann (Citation2005) indicate that the optimal window size should be relied on for the persistence and size of the structural breaks.
4. Data
To perform the analysis, monthly data was used, covering the period from 2005:M07 to 2016:M12. In the period, the PBOC launches the reform of the RMB exchange rate regime by switching from the dollar peg to a basket of currencies in 2005:M07. Meanwhile, the PBOC also allows the bilateral exchange rates to float within a daily band from 0.3% to 2%. (Cui, Citation2015) indicates that the reform increases the flexibility of the RMB exchange rate. The effects of the global financial crisis are widespread, which obviously impacts on the Chinese economy, affecting exports and the NER and inducing the need for structural adjustments. The RMB is included in Special Drawing Rights (SDR) by the International Monetary Fund (IMF) in 2016 denoting a substantial progress in internationalisation and liberalisation of the RMB (Xu et al., Citation2015). According to EquationEquation (2)(2)
(2) , the following variables were chosen. First, the RMB exchange rate relative to unit U.S. dollar is used and extracted from the National Bureau of Statistics of China (NBSC). Secondly, the Chinese CPI for the domestic price level is considered, and the data is taken from the PBOC. Thirdly, we choose U.S. CPI as the foreign price level, and the data comes from Thomson Reuters Datastream. RCP equals Chinese CPI minus U.S. CPI, which indicates changes in the price spread level between home and abroad and has periodic characteristic and huge fluctuation. It increased in the period 2006:M07-2008:M04, 2009:M11-2010:M11, 2013:M10-2014:M04 and 2015:M08-2016:M12. Correspondingly, RCP decreases at other times. NER is the price of another country’s currency and its fluctuation shows depreciation or appreciation in the domestic currency. Between 2005:M07-2008:M05, the RMB was in the process of appreciation and its range reached 20%. During 2008:M06-2010:M12, the RMB exchange rate kept stable. In 2011:M01-2015:M07, the RMB resumed its appreciation against the U.S. dollar. However, due to the slowdown in the domestic economy, the RMB began to depreciate since 2015:M08.
5. Empirical results
Following EquationEquation (3)(3)
(3) , the bivariate VAR model is constructed by the RCP and the NER. The optimal lag length of the VAR model is 2 based on SIC. shows the full-sample causality results from the RB-based modified-LR method. The null hypothesis of the test is that there is no causal relationship between the NER and the RCP. The statistics are 11.549 and 4.355 and the corresponding p-values are 0.178 and 0.143, which fails to reject the null hypothesis. That is to say, the movements in the RCP cannot lead to NER fluctuation, and the NER has no influence on the RCP based on the full-sample causality test. This finding is consistent with some of the existing literature that there is no causal link between these two variables (Dai et al., Citation2015). However, the conclusion is contentious because other researchers have reached opposite conclusions, specifically that the RCP and the NER can affect each other (Cheung & Lai, Citation1993; Saha & Zhang, Citation2013).
Table 1. Full-sample Granger-cause Tests.
Nevertheless, the above conclusion is based on a default assumption. It does not take structural changes into consideration and believes that a causal link does or does not exist in the full sample (Balcilar and Ozdemir Citation2013). When the structural break is emerging, the parameters are no longer constant. They would change with time passing, which shows the causal linkage between these two variables is unstable. Many events happened in this period such as the reform of the RMB exchange rate regime and the global financial crisis. All incidents mentioned above may bring structural changes in the NER and result in the NER deviating from the PPP. Hence, this paper tests parameter stability and pursues the purpose of confirming or denying the existence of structural breaks. As previously mentioned, the Sup-F, Mean-F and Exp-F tests are applied to examine whether the parameters are stable or not in the VAR model. Lc test has also been employed in testing for all parameters in the overall VAR system. shows the corresponding results of above tests. For the Sup-F test, the null hypothesis is that parameters have no one-time sharp shift. The hypothesis is rejected at 1% significance level on the basis of p-values in the first row, which means one-time sharp shift exists in the RCP, NER and VAR systems. The null hypothesis for Mean-F and Exp-F test is that the parameters follow a Martingale process. The hypothesis is also rejected in light of p-values in the second and third row, which indicates equations from RCP, NER and VAR system might evolve gradually. The parameters submitting to a random walk process constitutes the null hypothesis for Lc test and the assumption is also rejected. This means that the parameter in the overall VAR system is non-constant. Consequently, these provide enough evidence to reject the null hypothesis and prove there exist structural breaks.
Table 2. Parameter stability tests.
Considering the results from the above analysis, the PPP conclusion between the RCP and the NER is no longer credible. With existing structural changes, the rolling-window bootstrap method is performed to revisit the causality between RCP and NER. This approach takes a time-varying character into account that makes empirical results more accurate. The LR test is utilised to reexamine the PPP condition between these two variables in sub-intervals. The hypotheses for these tests are rejected meaning that the RCP does not Granger cause the NER and vice versa. After iterating the test several times, the 15-month1 window size is selected as optimal. The p-values of the LR test can be obtained from EquationEquation (3)(3)
(3) using this window size. When cutting 15 observations from the beginning, the remaining samples cover the period from 2006:M10 to 2016:M12.
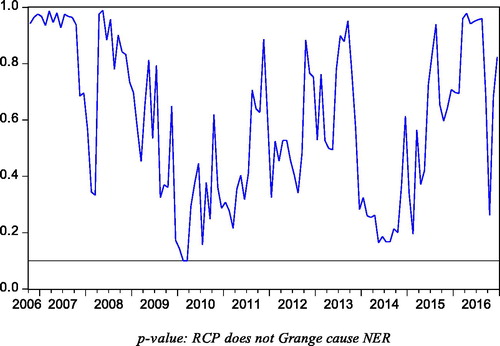
presents that the p-values of the rolling test statistic for testing the null that RCP does not Granger cause NER. When the line is above 0.1, we receive the null hypothesis. However, if the line is under 0.1, we could reject the null hypothesis. Based on the PPP, when Chinese consumer prices rise, the purchasing power of its currency will fall, which further leads to devaluation. That means unit U.S. dollar can exchange more RMB. In contrast, when foreign consumer prices rise, the domestic purchasing power would be strengthened and fewer RMB can exchange unit U.S. dollar. However, in our empirical results, relative prices levels have no influence on the NER mentioned in . This phenomenon can be explained by the following arguments. First, government intervention in the official foreign exchange rate market often leads to violations of the PPP. For example, the Chinese government’s export-oriented exchange rate policy means that the RMB was devalued on numerous occasions in the period covered by our sample in ways which are incompatible with the PPP exchange rate relationship. Secondly, the openness of the Chinese economy is relatively low. If an economy has a relatively small degree of openness, the deviation from PPP for its exchange rate tends to be greater; and vice versa. Thirdly, Cheung and Lai (Citation1993) notice that the link can be weakened by trade cost, trade restrictions and imperfect competition. Since joining the World Trade Organization (WTO), the trade cost between China and the U.S. has been reduced from 35.57% to 27.32%, but this still violates the foundation of the PPP (Kim, Citation2014). The U.S. carries out export control and abandons high-tech products to China, meanwhile China also implements trade quotas, which results in a commodity not being exchanged freely. According to the National Bureau of Statistics (NBSC), the international trade between China and the U.S. has achieved 3.95 trillion dollars in 2015, but a large share is occupied by big multinational companies, which inhibit the development of small and medium-sized enterprises (SMEs) (Zhang & Li, Citation2016). Finally, Yin (Citation2008) attributes PPP deviations to economic imbalance and strong unilateral RMB appreciation expectation. Cheng et al. (Citation2014) regard productivity, interest rate and money supply as possible omitted variables that impact the PPP. Therefore, deviations can be attributed to the established condition of the international economic environment and psychological expectation.
Figure 1. Bootstrap p-value of rolling test statistic testing the null that RCP does not Granger cause NER.
Note: NER represents that RMB relative to unit U.S. dollar
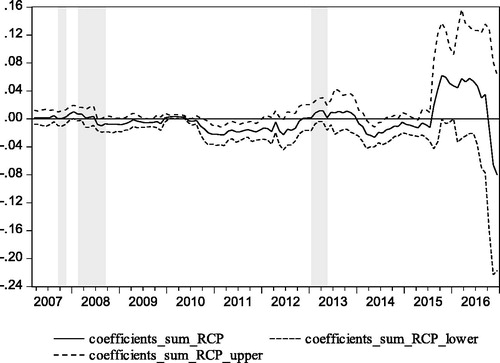
presents that the p-values of the rolling test statistic for testing the null that NER does not Granger cause RCP. When the line is above 0.1, we receive the null hypothesis. However, if the line under 0.1, we could reject the null hypothesis. points out that we can reject the null hypothesis in some sub-samples, which means NER had impact on RCP in the following periods 2007:M09-2007:M11, 2008:M02-2008:M09 and 2013:M01-2013:M05. shows the bootstrap estimates of the sum of the rolling coefficient measuring impact of the NER on the RCP. When the middle line is above zero that represents negative impact; otherwise, it means negative influence. Combing and , NER had a positive impact on RCP in 2007:M09-2007:M11, 2008:M02-2008:M06 and 2013:M01-2013:M05. In 2008:M07-2008:M09, NER had a negative impact on RCP. In the first period 2007:M09-2007:M11, the RMB was in the process of appreciating that attracted a mass of international short-term capital flowing into China, which resulted in excess liquidity and rising domestic demand that further narrowed the RCP (Zhao, Citation2011). In the second sub-interval 2008:M02-2008:M06, the appreciation of the RMB was expected to strengthen, which led to inflation through the exchange rate pass-through effect (Li & Luo, Citation2013). In the time period 2013:M01-2013:M05, with the influence of the global financial crisis wearing off and external financial environments stabilising, the RMB exchange rate strengthened raising domestic prices (Gong, Gao, & Liu, Citation2016). But in the sub-period 2008:M07-2008:M09, the NER had a negative impact on RCP. Fannie Mae and Freddie Mac, the top two largest U.S. real estate companies, were taken over by the U.S. government and Lehman Brothers filed for bankruptcy protection that sparked market panic and brought retail prices down in the U.S. (Dua & Tuteja, Citation2016). However, the NER had no significant impact on the RCP in the following periods. During 2006:M10-2007:M08, U.S. economic growth slowed down and global energy prices fell, reducing the pressure of inflation (Kilian and Vega, Citation2008). The proportion of fiscal deficit to GDP decreased from 3.6%, the highest point, to 1.9%, which further stabilised the retail prices down in the U.S. (Dockery, Ezeabasili, & Herbert, Citation2012). The Federal Open Market Committee (FOMC) announced it would keep the target interest rate at 5.25%, which meant a tight monetary policy. In 2007:M12-2008:M02, the CPI of China was 7.1%, 8.7% and 8.3%, separately. The PBOC found the high CPI was tight, with the Chinese Spring Festival and natural disasters (e.g., snowstorm). The festival produces huge demand for food, clothes and transport. Snow disaster destroyed transport and agriculture. In the period 2008:M10-2012:M12, with the subprime crisis becoming a global financial crisis, the FOMC took unprecedented loss-making monetary policy. It carried out three times quantitative easing policies separately in 2010:M04, 2010:M06 and 2012:M12. The FOMC also implemented a low interest rate policy, which reduced the interest from 5.25% to 0%. The above measures produced excess liquidity and previously rising retail prices down in the U.S. (Tu, Citation2011). In the last period 2013:M06-2016:M12, the RCP was mainly influenced by ‘policy sequel’. In order to get through the global financial crisis, the central government implemented a four trillion economic stimulus plan, and this triggered persistent inflation. U.S. losing monetary policies weakened the dollar and created huge debts, which damaged the U.S. economy (Tu, Citation2011).
Figure 2. Bootstrap p-value of rolling test statistic testing the null that NER does not Granger cause RCP.
Note: NER represents that RMB relative to unit U.S. dollar
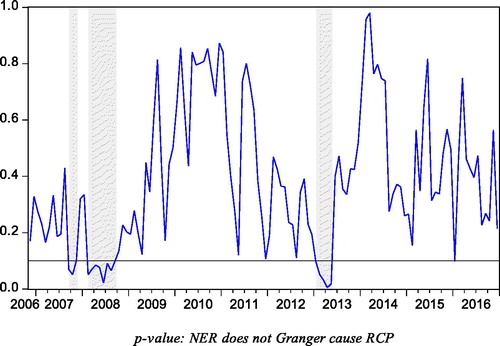
Figure 3. Bootstrap estimates of the sum of the rolling window coefficients for the impact of NER on RCP.
Note: NER represents that RMB relative to unit U.S. dollar
In this paper, the rolling-window method provides a new perspective into the PPP condition in China. The nexus is unstable over time and even shows deviations from the positive link. It is suitable as in the past few decades, when China experienced domestic economic restructuring and global economic fluctuation. The PBOC implemented the exchange rate regime reform, which ended the peg of the RMB to the U.S. dollar and created a managed float on a basket of currencies. Since the financial crisis in 2007, there has been a significant influence on the Chinese economic environment at home and abroad. Since 1996, China began its interest rate liberalisation and removed the interest ceiling of deposit rates. In 2015, the Central Economic Working Conference proposed supply-side structural reforms, which could be regarded as major strategic innovations. All these internal and external events resulted in the NER deviating from the PPP. Therefore, the bootstrap rolling window that we apply to investigate the PPP condition is reasonable and considers the specific backgrounds to obtain a more accurate conclusion for China. Therefore, some suggestions can be offered for China. First, the Chinese government should continue to promote the internationalisation of the RMB such as deepening the reform of the financial markets and promoting a capital account opening process, which lays the foundation for the PPP. Secondly, the Central Bank of China should note the structural changes from home and abroad that may result in deviating from the PPP. When faced with economic shocks, it should take corresponding measures such as flexible inflation targeting policies to stabilise the exchange rate (Jiang et al., , Citation2016). Last, China has a priority to defend depreciation more or less vigorously than appreciation, thereby generating asymmetric behaviour in the exchange market. The government should reduce the intervention in the official exchange rate, change export-oriented exchange policy and strengthen market adjustment, which could reduce the deviations from the PPP.
6. Conclusions
This paper reexamines the PPP condition between the RCP and the NER with the rolling window method. Considering the structural changes in the full-sample period, the PPP condition does not hold in the long run. Therefore, the bootstrap sub-sample rolling-window causality test is employed to examine the validity of purchasing power parity (PPP) in China using monthly data over the period between 2007:M07 and 2016:M12.
The empirical results indicate that the RCP has no impact on the NER, which do not provide much support for the PPP. However, the deviations from the PPP met the realties that China experienced economic transition and structural changes over the past decade. That means the PPP cannot be used to determine the equilibrium exchange rate. Our results have important policy implications for the Chinese government and central bank to reduce the negatives from the deviations.
Disclosure statement
No potential conflict of interest was reported by the author(s).
Additional information
Funding
Notes
1 We wonder whether the results are sensitive to the choice of window size. Thus, we select different window size (e.g. 24 and 36 months) to test and find the results are affected, but very little.
References
- Andrews, D. W. K., & Ploberger, W. (1994). Optimal test when a nuisance parameter is present only under the alternative. Econometrica, 62(6), 1383–1414. doi: 10.2307/2951753
- Arize, A. C. (2011). Purchasing power parity in LDCs: An empirical investigation. Global Finance Journal, 22(1), 56–71. doi: 10.1016/j.gfj.2011.05.005
- Balcilar, M., Ozdemir, Z. A., & Arslanturk, Y. (2010). Economic growth and energy consumption causal nexus viewed through a bootstrap rolling window. Energy Economics, 32(6), 1398–1410. doi: 10.1016/j.eneco.2010.05.015
- Balcilar, M., & Ozdemir, Z. A. (2013). The export-output growth nexus in Japan: A bootstrap rolling window approach. Empirical Economics, 44, 639–660. doi: 10.1007/s00181-012-0562-8
- Bahmani-Oskooee, M., Chang, T. Y., Cheng, S. C., & Wu, T. P. (2015). Revisiting purchasing power parity in major oil-exporting countries. Macroeconomics and Finance in Emerging Market Economies, 8, (1-2), 108–116. doi: 10.1080/17520843.2014.948473
- Bahmani-Oskooee, M., Chang, T. Y., & Lee, K. H. (2016). Purchasing power parity in emerging markets: A panel stationary test with both sharp and smooth breaks. Economic Systems, 40(3), 453–460. doi: 10.1016/j.ecosys.2015.12.002
- Chang, T. Y., Chang, Su, C. W., & Lee, C. H. (2012). Purchasing power parity nonlinear threshold unit root test for East-Asian countries. Applied Economic Letters, 19(10), 975–979. doi: 10.1080/13504851.2011.608641
- Chang, T. Y. (2012). Nonlinear adjustment to purchasing power parity in China. Applied Economics Letters, 19(9), 843–848. doi: 10.1080/13504851.2011.607111
- Chen, T. H., Chang, T. Y., Zhang, Y. C., & Lee, C. H. (2011). Purchasing power parity in Mainland China and Taiwan: An empirical note based on threshold unit root test. Applied Economics Letters, 18, (18), 1807–1812. doi: 10.1080/13504851.2011.564122
- Cheng, S., Wu, T., Lee, K., & Chang, T. (2014). Flexible fourier unit root test of unemployment for PIIGS countries. Economic Modelling, 36, 142–148. doi: 10.1016/j.econmod.2013.09.021
- Cheung, Y. W., & Lai, K. S. (1993). Long-run purchasing power parity during the recent float. International Economics, 34(1-2), 181–192. doi: 10.1016/0022-1996(93)90073-7
- Cui, Y. M. (2015). China’s exchange rate regime reform: Implications from the experiences from Japan, Korea and Taiwan. China Economic Journal, 8(1), 1–17. doi: 10.1080/17538963.2015.1001013
- Dua, P., & Tuteja, D. (2016). Linkages between Indian and US financial markets: Impact of global financial crisis and Eurozone debt crisis. Macroeconomics and Finance in Emerging Market Economies, 9(3), 217–240. doi: 10.1080/17520843.2016.1166144
- Dai, J. P., Yang, K., & Liu, D. P. (2015). Research on the deviation of RMB exchange rate from the purchasing power parity theory. Finance Research Journal, 7, 35–41.
- Dickey, D. A., & Fuller, W. A. (1981). Likelihood ratio statistics for autoregressive time series with a unit root. Energy Economics, 49, 1057–1072. doi: 10.2307/1912517
- Dockery, E., Ezeabasili, V. N., & Herbert, W. E. (2012). On the relationship between fiscal deficits and inflation: Econometric evidence for Nigeria. Economics and Finance Review, 2, 17–30.
- Engel, C., & Rogers, J. H. (2004). European product market integration after the Euro. Economic Policy, 19(39), 348–384. doi: 10.1111/j.1468-0327.2004.00126.x
- Gong, J., Gao, T. M., & Liu, K. (2016). An analysis on relations of price fluctuation, output gap and monetary policy-based on exchange rate pass-through effects. Finance & Trade Economics, 5, 76–90.
- Granger, C. W. J. (1996). Can we improve the perceived quality of economic forecast?. Journal of Applied Econometrics, 11(5), 455–473. doi: 10.1002/(SICI)1099-1255(199609)11:5<455::AID-JAE408>3.3.CO;2-5
- Hansen, M. (1999). Tests for parameter instability in regression with I(1) process. Journal of Comparative Economics Statistics, 10, 669–685.
- Ho, S. W., Zhang, J., & Zhou, H. (2014). Hot money and quantitative easing: The spillover effects of U.S. monetary policy on the Chinese housing, equity and loan markets. Social Science Electronic, 3, 1–48.
- Huang, C. H., & Yang, C. H. (2015). European exchange rate regimes and purchasing power parity: An empirical study on eleven Eurozone countries. International Review of Economics and Finance, 35, 100–109. doi: 10.1016/j.iref.2014.09.008
- Jiang, C., Jian, N., Liu, T. Y., & Su, C. W. (2016). Purchasing power parity and real exchange rate in central eastern European countries. International Review of Economics and Finance, 44, 349–358. doi: 10.1016/j.iref.2016.02.006
- Kapetanios, G., Snell, A., & Shin, Y. (2003). Testing for unit root in the nonlinear STAR framework. Journal of Econometrics, 112(2), 359–379. doi: 10.1016/S0304-4076(02)00202-6
- Kim, M. H. (2014). The U.S.-China trade deficit. The International Trade Journal, 28(1), 65–83. doi: 10.1080/08853908.2013.814555
- Kilian, L., & Vega, C. (2008). Do energy prices respond to U.S. macroeconomic news? a test of the hypothesis of predetermined energy prices. Board of Governors of the Federal Reserve System International Finance Discussion Papers, 957, 1–30.
- Kwiatowski, D., Phillips, P. C. B., Schmidt, P., & Shin, Y. (1992). Testing the null hypothesis of stationary against the alternative of a unit root. Journal of Economics, 54, 159–178. doi: 10.1016/0304-4076(92)90104-Y
- Lee, D. Y. (1999). Purchasing power parity and dynamic error correction evidence from Asia Pacific economies. International Review of Economics and Finance, 8(2), 199–212. doi: 10.1016/S1059-0560(99)00015-5
- Lee, C., & Chou, P. (2013). The behavior of real exchange rate: Nonlinearity and breaks. International Review of Economics and Finance, 27, 125–133. doi: 10.1016/j.iref.2012.09.007
- Li, F. Y., & Luo, A. (2013). Analysis of the price effect of RMB exchange rate pass through. Studies of International Finance, 2, 67–73.
- Lothian, J. R. (2016). Purchasing power parity and the behavior of prices and nominal exchange rates across exchange-rate regimes. International Money and Finance, 69, 5–21. doi: 10.1016/j.jimonfin.2016.06.015
- Ma, W., Li, H. Q., & Park, S. Y. (2017). Empirical conditional quantile test for purchasing power parity: Evidence from East Asian countries. International Review of Economics and Finance, 49, 211–222. doi: 10.1016/j.iref.2017.01.029
- Mantalos, P., & Shukur, G. (1998). Size and power of error correction model cointegration test: A bootstrap approach. Oxford Bulletin of Economics and Statistics, 60(2), 249–255. doi: 10.1111/1468-0084.00097
- Mantalos, P. (2000). A graphical investigation of the size and power of the Granger causality tests in integrated-cointegrated VAR systems. Studies in Nonlinear Dynamics and Econometrics, 4(1), 17–33. doi: 10.1162/108118200569162
- Nyblom, J. (1989). Testing for the constancy of parameters over time. Journal of the American Statistical Association, 84(405), 223–230. doi: 10.1080/01621459.1989.10478759
- Newey, W., & West, K. (1987). A simple, positive semidefinite, heteroscedasticity and autocorrelation consistent covariance matrix. Econometrica, 55(3), 703–708. doi: 10.2307/1913610
- Overholt, W. H. (2010). China in the global financial crisis: Rising influence, rising challenges. The Washington Quarterly, 33(1), 21–34. doi: 10.1080/01636600903418652
- Paya, I., & Peel, D. A. (2005). The process followed by PPP data: On the properties of linearity tests. Applied Economics, 37(21), 2515–2522. doi: 10.1080/00036840500390189
- Paya, I., & Peel, D. A. (2007). On the relationship between nominal exchange rates and domestic and foreign prices. Applied Financial Economics, 17, (2), 105–117. doi: 10.1080/09603100500438809
- Pesaran, M. H., & Timmermann, A. (2005). Small sample properties of forecast from autoregressive models under structural breaks. Journal of Econometrics, 129(1-2), 183–217. doi: 10.1016/j.jeconom.2004.09.007
- Phillips, P. B. C., & Perron, P. (1988). Testing for unit roots in time series regression. Biometrika, 75(2), 335–346. doi: 10.2307/2336182
- Qin, J., Lu, X. S., Zhou, Y., & Qu, L. (2015). The effectiveness of China’s RNB exchange rate reforms: An insight from multifractal detrended fluctuation analysis. Physica A: Statistical Mechanics and Its Applications, 421, 443–454. doi: 10.1016/j.physa.2014.11.053
- Saha, S., & Zhang, Z. Z. (2013). Do exchange rates affect consumer prices? A comparative analysis for Australia, China and India. Mathematics and Computers in Simulation, 93, 128–138. doi: 10.1016/j.matcom.2012.11.002
- Shukur, G., & Mantalos, P. (1997). Size and power of the RESET test as applied to systems of equations: A bootstrap approach, Working paper 1997:3. Department of Statistics, University of Lund, Sweden.
- Shukur, G., & Mantalos, P. (2000). A simple investigation of the Granger-causality test in integrated-cointegrated VAR systems. Journal of Applied Statistics, 27(8), 1021–1031. doi: 10.1080/02664760050173346
- Sims, C. A., Stock, J. H., & Watson, M. W. (1990). Inference in linear times series with some unit roots. Econometrica, 58(1), 113–144. doi: 10.2307/2938337
- Su, C. W., Zhang, H. G., Chang, H. L., & Nian, R. (2016). Is exchange rate stability beneficial for stabilizing consumer prices in China. Journal of International Trade & Economic Development, 25, 857–879. doi: 10.1080/09638199.2016.1142605
- Su, C. W., Chang, H. L., Chang, T. Y., & Lee, C. H. (2012). Purchasing power parity for BRICs: Linear and nonlinear unit root tests with stationary covariates. Applied Economic Letters, 19(16), 1587–1591. doi: 10.1080/13504851.2011.639732
- Taylor, M. P. (1988). An empirical examination of long run purchasing power parity using cointegration techniques. Applied Economics, 20(10), 1369–1381. doi: 10.1080/00036848800000107
- Toda, H. Y., & Phillips, P. C. B. (1993). Vector autoregression and causality. Econometrica, 61(6), 1367–1393. doi: 10.2307/2951647
- Toda, H. Y., & Phillips, P. C. B. (1994). Vector autoregression and causality: A theoretical overview and simulation study. Econometric Reviews, 13(2), 259–285. doi: 10.1080/07474939408800286
- Tu, F. (2011). The causes and effects of quantitative easing policies in United States. Contemporary Economy & Management, 33, 1–4.
- Vieira, F. V., Holland, M., Silva, C. G., & Bottecchia, L. C. (2013). Growth and exchange rate volatility: A panel data analysis. Applied Economics, 45(26), 3733–3741. doi: 10.1080/00036846.2012.730135
- Vasconcelos, C. R. F., & Júnior, L. A. L. (2016). Validity of purchasing power parity for selected Latin American countries: Linear and non-linear unit root tests. EconomiA, 17(1), 114–125. doi: 10.1016/j.econ.2015.11.001
- Xu, Z. M., Lai, J. Y., & Zhang, C. Y. (2015). Revisiting causal link between interest rate differential and exchange rate of China and the United States: Frequency domain approach. Journal of Wuhan University, 69, 74–83.
- Yi, J. T. (2013). Exchange rates and prices: Evidence from China. The Journal of International Trade & Economic Development, 22, 639–657. doi: 10.1080/09638199.2011.589032
- Yin, Y. K. (2008). Purchasing power parity and “double-effect and there-stage curve” hypothesis. Studies of International Finance, 11, 63–67.
- Zhang, X. S., & Li, Q. Y. (2016). Strategic alliance of small and medium sized enterprises and multinational corporations. Enterprise Economy, 2, 49–52.
- Zhao, Z. B. (2011). Overseas “hot money”, RMB exchange rate and price level. Economic Perspectives, 4, 67–73.
- Zhao, S. M., Xie, X. W., Fang, Y., & Tian, Z. (2013). The study on the dynamic relationship between RMB exchange rate and interest rate in process of financial marketization reform. Nankai Economic Studies, 5, 33–49.
Appendix
The Augmented Dickey-Fuller (Dickey and Fuller Citation1981, ADF), the Phillips and Perron (Citation1988, PP) and the Kwiatowski et al. (Citation1992, KPSS) tests are employed to examine stationarity of real exchange rate (RER) in this paper. From the corresponding results in we find that the RER is non-stationary under the ADF, PP and KPSS tests. That means the PPP does not hold in the sample. However, Cheng et al. (2014) indicate that the conventional unit root tests fail to incorporate the structural breaks in the model and have low power in detecting the mean reversion. Therefore, the non-linear unit root test of KSS (Kapetanios, Snell, & Shin, Citation2003) is employed to investigate the stationarity of RER. The fifth column in shows that the null hypothesis of non-stationarity for RER cannot be rejected at a 5% significance level. That means the PPP does not hold in the sample.
Table 1. Unit root results.