?Mathematical formulae have been encoded as MathML and are displayed in this HTML version using MathJax in order to improve their display. Uncheck the box to turn MathJax off. This feature requires Javascript. Click on a formula to zoom.
Abstract
This paper analyses the developments in labor income taxation in Croatia, Slovenia and Slovakia during the period 2011–2017. While the systems of social insurance contributions in these countries were relatively stable, their personal income taxes have undergone more important changes. Using tax-benefit microsimulation models, we compute average and marginal tax rates for the sample units and assess the impact of tax-benefit systems on income distribution.
1. Introduction
In the context of sluggish economic growth, high unemployment and rising income inequality, countries in the EU and around the world are implementing tax reforms. As the series of reports Tax Policy Reforms (OECD, Citation2016, Citation2017, Citation2018a) demonstrates, some of these reforms provide a fiscal stimulus to ‘spur the GDP growth’, some are ‘enhancing fairness’ by redistributing the tax burden from lower and middle income classes to higher income classes, and others are ‘encouraging work’ through provision of tax relief for low-wage workers. According to these reports, each year, a number of countries introduce larger or smaller changes to their tax systems, searching for the optimal combination of parameters and adapting to ever-changing internal and external circumstances.
Many of these tax changes occur in the field of labor taxes – namely, personal income taxes (PITs) and social insurance contributions (SICs) – which represent the most important sources of tax revenues in OECD countries (OECD, Citation2017), as well as in the EU (European Commission, Citation2018b). In its highly influential publication, OECD provides recipes for policy makers on how to implement successful ‘growth-oriented tax reform’ (OECD, Citation2010). The lowering of the tax burden on labor income can increase labor utilization. The participation rate can be stimulated by lowering the average tax wedge, which can be achieved by decreasing tax rates, increasing personal allowances, or introducing ‘make work policies’, such as earned income tax credits. Lowering marginal tax rates may be preferable for increasing hours worked. Reducing the progressivity of the PIT schedule can benefit both the quantity and quality of labor supply. All these changes, however, have an impact on the distribution of income, which must also be taken into account.
Having different starting positions and tax reform goals, different countries perform opposing changes; e.g., some countries are cutting, while others are raising, their top PIT rates; some are broadening their PIT and SIC bases, while others are narrowing them. One trend in the OECD countries is to decrease the PIT burden for lower and middle classes (OECD, Citation2017). Another trend is the relinquishment of single-rate PIT systems in EU countries. Namely, in the period from 1994 to 2008, many EU countries – all of which belonged to the ex-communist bloc – adopted the single-rate PIT regime. Some of these countries have maintained this system (Bulgaria, Estonia, Hungary, Lithuania and Romania), but several of them have abandoned it by introducing one or two additional marginal rates (Czech Republic, Latvia, Slovakia). However, there are ex-communist EU countries that have introduced and maintained progressive rate schedules throughout the entire period (Croatia, Slovenia, Poland).
In this paper, we analyze the developments in labor income taxation in three of the above-mentioned countries – Croatia, Slovenia and Slovakia – in the period from 2011 to 2017.1 These three countries share similar historical and contemporary elements. They were part of multinational states (Yugoslavia and Czechoslovakia) with socialist systems. After the collapse of socialism, all three countries thus experienced not only a transition towards the capitalistic system but also the process of establishing and/or strengthening several institutions required by independent states. While Slovakia became independent in a peaceful way, Slovenia and Croatia each faced a war for independence, which was especially severe in Croatia, with long-lasting effects on social and economic structures. All three countries are members of the EU (Slovenia and Slovakia are also members of the Euro zone), in which they belong to a group of relatively small member states that have a GDP per capita below the EU-28 average.2 Although they have many similarities, these countries have pursued different economic and fiscal strategies and achieved different outcomes during the transition and post-transition periods; these strategies and outcomes are further discussed in this paper. All three countries were affected by a recent economic crisis, and Croatia especially is faced with longer-term problems of low employment, high employment, and high relative poverty.
We calculate the tax wedge on employment income using hypothetical and actual sample data for the three years (2011, 2014 and 2017). The average tax wedge is compared at different levels of employment income across countries and time periods to reveal how labor taxation systems and their changes impacted the tax burden. Redistributive effects of fiscal systems are obtained to assess the impact of tax reforms on income distribution.
The paper presents an ‘illustrated story’ of the developments in the labor taxation of the three countries in the period during and after the economic crisis. Careful investigation of the changes in the tax burden on labor gives us insights into the motivations of policy makers to implement the various reforms. Our results can help to envisage the impacts of these reforms on the performance of the labor market.
In all the calculations, we use arithmetic microsimulation models of direct taxes and cash social benefits. For Croatia, miCROmodA is used (Urban, Bezeredi & Pezer, Citation2018), while for Slovenia and Slovakia, we employ EUROMOD (Sutherland & Figari, Citation2013). These models use EU-SILC data on original incomes of persons living in households and calculate their taxes payable and benefits receivable. These calculations are performed using the so-called ‘night-after’ perspective, which means that behavioral responses due to changes in the tax-benefit system are not simulated.
The paper is organized as follows. Section 2 describes the data and methods used in the research. In section 3, we briefly review the literature that explains the relationship between the tax wedge on employment income and the main indicators of labor market performance. The tax wedge is a particular focus of Croatian and Slovenian researchers, as demonstrated by the dozen studies on this topic, some of which are presented in the review. Section 4 compares the three analyzed countries in terms of selected economic indicators, such as real GDP per capita, employment, unemployment and poverty rates (subsection 4.1), and the overall tax structure (subsection 4.2). This comparison is followed by a detailed presentation of the developments in the SIC and PIT systems (subsection 4.3). Section 5 compares marginal and average tax wedges in the three countries using the data for a hypothetical single earner at different wage levels. This comparison serves as an introduction to the analysis of the tax wedge obtained for sample data on actual employees in Section 6. Section 7 analyses the impact of the tax-benefit system on income distribution. Section 8 contains a discussion of results and a conclusion.
2. Methods and data
2.1. Data
For Slovenia and Slovakia, calculations of household income, taxes and benefits are made using EUROMOD H0.34, wherein the sample data are based on the EU-SILC UDB 2015. For Croatia, we use miCROmodA v1.15; the dataset was obtained by merging the EUROMOD input data (based on EU-SILC UDB 2015) and EU-SILC NDB 2015.3 More information on modelling tax-benefit systems in the three countries and the data samples can be found in EUROMOD Country Reports (Gabik & Paur, Citation2017; Kump, Čok & Majcen, Citation2017; Urban, Bezeredi & Pezer, Citation2017) and the ‘miCROmodA report’ (Urban et al., Citation2018).
2.2. Tax wedge calculation
Gross employment income (GEI) comprises the gross earnings obtained by an employee and consists of taxable and non-taxable components. The taxable components serve as a basis for calculation of employer social insurance contributions (SICER), employee social insurance contributions (SICEE) and personal income taxes (PIT). The total labor tax comprises the sum of PIT, SICEE and SICER. Total labor cost is the sum of GEI and SICER. Net employment income equals GEI minus SICEE minus PIT (i.e., total labor cost minus total labor tax). The average tax wedge (ATW) is the percentage share of total labor tax in total labor cost. The marginal tax wedge (MTW) is obtained as the percentage ratio between the change in the total labor tax and the change in total labor cost when GEI is marginally increased. The post-SIC GEI is obtained as the GEI minus SICEE.
PITs and SICs are typically paid to the general government. However, there are many cases in which these compulsory payments, primarily SICs, are paid to privately managed funds, welfare agencies, public enterprises or social insurance schemes outside the general government. The OECD’s report Taxing Wages includes in the tax wedge only the compulsory and unrequited payments made to the general government (OECD, Citation2018b). However, OECD also produces alternative measures of the tax wedge, which capture ‘non-tax compulsory payments’ that are ‘made by employers or employees in connection with the employees’ labor activity’ (OECD, Citation2018c).4
In this paper, we follow this alternative approach that considers all compulsory payments as the components of total labor tax. In Slovenia, all PIT and SIC components belong to the general government. Croatia and Slovakia have two-pillar pension systems: the contributions for the 1st pillar belong to the general government, and contributions for the 2nd pillar are paid to privately managed pension funds. Some employees participate in the two-pillar system, while others contribute only to the 1st pillar. However, the total rates are equal for these two groups, and there is no difference in the tax wedge measures among these groups.
Another departure from the Taxing Wages methodology in this paper considers the treatment of cash family benefits. OECD calculates the amounts of tax relief and cash transfers universally paid with respect to dependent children in certain age groups and deducts these amounts in the calculation of the tax wedge. In this study, we disregard these benefits, focusing purely on PITs and SICs. In our concrete case, Croatia and Slovenia have means-tested child benefits, and Slovakia has a non-means-tested child benefit. Slovakia has a refundable tax credit for taxpayers with dependent children; in this case, we take into account both portions of tax credit: the first one, which reduces or eliminates a taxpayer’s liability, and the second one, which exceeds the liability and is paid to the taxpayer (‘negative tax’ or tax refund). In the OECD’s Taxing Wages, the income unit for calculation of the tax wedge is a household (family). In this investigation, the income unit is an individual employee.
In hypothetical calculations of tax burden, it is usually assumed that the entire employment income of an employee is taxable. However, in reality, there are parts of employment income that are exempted from taxation, i.e., they do not enter the base for calculation of SICs and PITs.5 Using the data on actual income units, we are able to distinguish taxable and non-taxable portions of employment income. Our microsimulation models recognize these different components and apply the relevant rules in the calculation of SIC and PIT bases. In their input data sets, EUROMOD and miCROmodA contain the variables for different components of GEI. lists these components (variables) for the three analyzed countries.
Table 1. Components of gross employment income, as contained in EUROMOD and miCROmodA, 2014.
The ‘selected employees’ are persons who have been earning employment income during all 12 months of the year, working at least the usual 30 hours per week, and with average GEI per month exceeding the gross minimum wage. The original samples and the models are slightly adapted. All non-employment taxable incomes of selected employees are set to zero in order to focus on the tax burden on labor income. For Slovakia, we also set to zero the amounts of ‘termination pay’ and ‘severance payments’ because these components of GEI represent one-off payments.
shows the basic information about samples used in the study. Using Croatia for illustration, out of 17,135 individuals in the sample, there were 5013 persons who had positive GEI, but 3951 of them – representing 1.06 million employees – have entered the ‘selected employees’ group. The average GEI is higher for the selected employees than for all employees because employees who work more hours and months tend to be better paid; also, the former group excludes employees with GEI below the minimum wage.
Table 2. Basic information about the samples, 2014.
Selected employees are first sorted into permille groups according to GEI, whereby each permille represents 1/1000 of the employees. Afterwards, the quantile groups are formed; for example, the quantile group q1–200 (q999–1000) contains 20% (0.2%) of employees with the lowest (highest) gross employment income.
2.3. Decomposition of inequality effect
Unlike in the analysis of the tax wedge, where the unit of observation was an individual worker, in the analysis of inequality and redistribution, the unit of observation is a household. The pre-fiscal income of a household is defined as the sum of gross original incomes and private transfers of all household members. Post-fiscal (or disposable) income equals pre-fiscal income minus taxes plus social benefits. All incomes, taxes and benefits are equalized using the modified OECD scale. We denote equalized pre-fiscal income, post-fiscal income, tax p and benefit q, of equalized household i, as
and
Equalized post-fiscal income (
) is also referred to as equalized disposable income.
We use the Kakwani (Citation1984) decomposition of the inequality effect of the fiscal system into vertical and horizontal effects. The inequality effect is the difference between the Gini coefficients of pre-fiscal and post-fiscal incomes, The vertical and horizontal effects equal
and
respectively, where
is the concentration coefficient of post-fiscal income. The decomposition of the inequality effect is as follows:
(1)
(1)
measures the potential inequality reduction of the fiscal system, i.e., the decrease of inequality if there were no horizontal inequity.
measures the extent of horizontal equity due to reranking of income units and unequal treatment of equal units. Furthermore, the vertical effect is then decomposed following the method proposed by Lambert (Citation1985, Citation2001):
(2)
(2)
where
(3)
(3)
are vertical effects of the pth tax and qth benefit, respectively;
and
are their respective shares in pre-fiscal income;
and
are the concentration coefficients obtained for income variables
and
respectively. The contributions of the pth tax and qth benefit to
are obtained using EquationEquation (2)
(2)
(2) , respectively, as:
(4)
(4)
3. Importance of the tax wedge
In regard to measurement of the labor tax burden, the most popular indicator is the ‘tax wedge’, which is usually defined as the difference between labor costs to the employer and the net wage of the employee. The tax wedge is often assessed for hypothetical income units. The notable example is the OECD’s publication Taxing Wages, which contains international comparisons of the tax wedge for several standardized types of individuals and families (OECD, Citation2018b).
The tax wedge for hypothetical income units is used in virtually all studies exploring how tax burden on employment income affects employment, unemployment and productivity of labor. A recurring conclusion of these studies is that a high tax wedge has a detrimental impact on the labor market: it decreases employment and labor productivity and leads to higher unemployment (e.g., Daveri & Tabellini, Citation2000; Nickell, Citation2004; Nickell, Nunziata & Ochel, Citation2005). For example, using the panel data for EU-27 countries during the 1999–2008 period, Dolenc and Laporšek (Citation2010) reveal the statistically significant negative relationship between the tax wedge and employment growth.6 In a recent study, Lehmann, Lucifora, Moriconi and Van der Linden (Citation2016) confirm the findings of previous studies that a decrease in the tax wedge is associated with a decrease in unemployment and an increase in the employment rate. However, these authors also reveal a positive (negative) relationship between tax wedge progressivity and the employment (unemployment) rate. It has also been shown that higher progressivity of the tax schedule decreases production per worker and that the net impact of the tax burden on total production is not statistically significant.
The effects of the tax wedge on employment income is a very popular topic among researchers from the three analyzed countries, particularly Croatia and Slovenia.7 Čok, Grulja, Turk and Verbič (Citation2013) provide detailed calculations of the tax wedge in Croatia, Slovenia, Hungary, Austria and Italy in 2010. In addition to calculating the tax wedge for the average worker, they also obtain the results for annual wages ranging from 10 to 100,000 euros. When the average worker is considered, Croatia, Slovenia and Hungary have a lower tax burden than Austria and Italy. This finding is reversed when tax wedges are obtained for wages expressed in absolute terms.8 Urban (Citation2016) summarizes the Taxing Wages results regarding the tax wedge for EU OECD countries, adding the calculations for Croatia.9 It is shown that the Croatian tax wedge in 2014 is lower than in Slovenia and Slovakia for different hypothetical types, but the differences are relatively modest. In the analyzed sample, these three countries belong to the bottom half of the ranking scale.
Several studies have performed cluster analyses for OECD and EU countries according to the tax wedge and labor market variables (Dolenc, Laporšek & Šeparović, Citation2011; Dolenc & Vodopivec, Citation2005; Grdović Gnip & Tomić, Citation2010; Šeparović, Citation2009). These studies classify countries into two major groups: (A) those with a higher tax wedge, higher unemployment and lower employment, and (B) those with a lower tax wedge, lower unemployment and higher employment. Croatia was often classified into group A and Slovakia into group B, whereas Slovenia was somewhere between these two groups. The results of these studies are not clear-cut. For example, the three countries had relatively similar levels of the tax wedge, but Croatia was categorized into group A simply because it has high unemployment and low employment rates. In an attempt to improve the model, Grdović Gnip and Tomić (Citation2010) introduced the index of employment protection legislation as an additional variable, but the results remained contradictory.10
Deskar-Škrbić, Drezgić and Šimović (Citation2018) analyze the effects of labor taxation in terms of the tax wedge on employment in Croatia in the period from 2000 to 2016. They employ the small-scale vector autoregressive model to show that the shock in the tax wedge has a negative effect on cyclically adjusted employment. This effect is statistically significant in five quarters after the shock. Nadoveza, Sekur and Beg (Citation2016) use the computable general equilibrium model for Croatia to perform an exercise in lowering employer taxes. The results show that: (a) the price of labor is increased due to increased demand for labor, (b) the price of capital is decreased, (c) the prices of final goods decrease, (d) household income increases due to an increase in wages, which more than compensates for the decrease in capital income, (e) production of all sectors increases (most in the services sector), and (f) although the labor tax is lower, government consumption of all goods increases due to higher consumption and household income.
As already mentioned above, virtually all of the studies exploring the relationship of labor taxation burden and macroeconomic variables (employment, unemployment, labor productivity) use the tax wedge obtained for hypothetical units. However, as Immervoll (Citation2004) explains, the tax burden calculations based on hypothetical households, ‘while illustrative, fail to take into account the heterogeneity of the population.’ He advocates for using a microsimulation model of taxes and benefits, which can calculate the tax wedge for real income units by using the information from the representative sample of a country’s population. Immervoll (Citation2004) also provides a detailed discussion of methodological procedures and challenges in calculating both the average and marginal tax wedges.
4. Country overview
4.1. Selected economic indicators
In 2005, Croatia and Slovakia had equal real GDP per capita (10,000 euros), which represented approximately 40% of the EU-28 average (). In 2017, Croatian real GDP per capita was only 13% higher, whereas Slovakia achieved an increase of 52%, which puts it at 54% of the EU average. Slovenia began the period at 67% of the EU-28 average and ended it with 70%.
Figure 1. Selected economic indicators.
Source: EUROSTAT (Citation2018).
Notes: (1) Real GDP per capita – real gross domestic product expressed in per capita terms; (2) Employment rate – the share of persons in employment aged 20 to 64 in the total population of the same age group; (3) Unemployment rate – the share of the economically active population aged 20 to 64 who has been unemployed; (4) Poverty rate – the share of persons living in households with equivalised disposable income below 60% of the median.
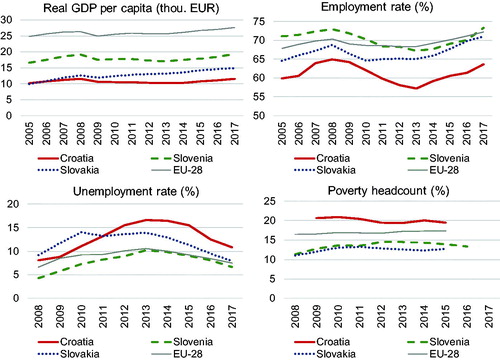
The GDP rise in Slovakia was also followed by an increase in the employment rate – from 64.5% in 2005 to 71.1% in 2017, which is close to the EU-28 average (72.2%). Slovenia was several points above the EU-28 average in the 2005–2008 period. This advantage disappeared during the economic crisis, and in 2016, Slovenia was at the EU-28 average. Croatia had a similar pattern in its employment rate during the analyzed period, but at much lower levels, approximately 8 percentage points below the EU-28 average.
All countries registered their peak unemployment rates in 2013; subsequently, the rate tends to fall to its pre-crisis level. As in the case of the employment rate in 2017, Slovenia and Slovakia converge to the EU-28 average, while Croatia performs significantly worse. The latter is also true with regard to the poverty headcount rate. In contrast, Slovenia and Slovakia are well below the EU-28 average of 17% in 2017.
4.2. Tax structure
In terms of the total tax burden as a percentage of GDP, Croatia and Slovenia stand close to the EU-28 average (). Additionally, Slovenia has a relatively similar structure of tax revenue as the EU-28 average, with somewhat higher reliance on indirect taxes and SICs and lower dependence on direct taxes. Croatia collects less than Slovenia from both direct taxes and SICs but outperforms in terms of indirect taxes. Regarding the share of VAT in GDP, Croatia was the highest-ranked EU country in 2016. Slovakia has relatively similar shares of direct taxes and SICs as Croatia and Slovenia but collects significantly less from direct taxes; its share of VAT in GDP was only 6.7% in 2016, compared to 13% in Croatia. The total tax burden in Slovakia is significantly lower than in the other two countries throughout the whole period, especially in 2010, when it was only 28% of GDP.
Table 3. Tax structure in Croatia, Slovenia, Slovakia and the EU-28, % of GDP.
4.3. Labour income taxation
In this section, we briefly review the main features of labor income taxation in Croatia, Slovenia and Slovakia during the period from 2011 to 2017. We consider SIC and PIT systems.11 The main parameters of these systems are shown in the Appendix (). Because the average employment income differs in the three countries, for comparability purposes, we also express the monetary parameters in terms of the average post-SIC GEI (APSGEI).
Table 4. Mean average tax wedge.
All three countries implement employer and employee SIC (henceforth, SICER and SICEE, respectively) instruments. The total SICER rate in Slovakia (35.2%) is twice as high as in Croatia (17.2%) and Slovenia (16.1%). In contrast, Slovakia has a smaller total SICEE rate (13.4%) than Croatia (20%) and Slovenia (22.1%). The rates have not been changed during the period 2011–2017.12
The base for calculation of SICs is gross employment income, but there are significant differences regarding the ‘ceilings’, i.e., the maximum levels of SIC bases. Slovenia applies no ceilings at all. Croatia sets the ceiling on the base of SICEE instruments, which in year y equals 6 average gross wages in the year y–1. Slovakia applies ceilings based on the majority of SIC instruments, which in year y equal C average gross wages in year y–2 ().13
During the analyzed period, Slovakia introduced major changes regarding the ceilings. Namely, in 2011, the factor C ranged from 1.5 to 3 for various SICs. In 2013, C was raised to 5 and then to 7 in 2017. Furthermore, the ceiling for health insurance contributions was abolished in 2017. In 2015, the allowance for health insurance contribution was introduced, and it was intended for low-income persons.14
In all three countries, SICEE is exempted from personal income taxation. In other words, the pre-PIT income equals gross wage minus SICEE. Another common characteristic is the general allowance, which is applicable to all taxpayers. However, its calculation differs by country. In Croatia, general allowance does not depend on the pre-PIT income. In Slovenia, taxpayers are divided into three income brackets, and the amount of allowance falls with pre-PIT income. In Slovakia, the general allowance is designed in the fashion of a ‘working tax credit’: if pre-PIT income is below the threshold, the basic amount is obtained; after the threshold, the withdrawal rate (25%) is applied; at a certain pre-PIT income, the allowance falls to the minimum level of zero.15
A similar formula is applied in the calculation of the Slovakian allowance for dependent spouse. Contrarily, Croatia and Slovenia have unique values of their allowances for dependent spouses.16 These two countries have tax allowances for children, whose amounts rise for each subsequent child. In relative terms, Croatia has more generous child tax allowances. For example, in 2017, the total allowance for three children was 123% of APSGEI, compared to 53% in Slovenia. By contrast, Slovakia has a refundable child tax credit, whose amount is equal for each additional child. In Slovenia and Slovakia, the general allowance and the allowance for dependent children and spouses have been increased only marginally during the analysed period. By contrast, Croatian amounts have been doubled.
In the beginning of the analysed period, Slovakia had the simplest PIT system, with a flat rate of 19%. Croatia and Slovenia had three-rate schedules, with the rate combinations of 12%–25%–40% and 16%–27%–41%, respectively. In 2013, Slovakia introduced a second rate of 25%, which captures incomes above four times the average wage.
In the same year, Slovenia also introduced an additional marginal tax rate (50%) for high-income taxpayers. The threshold for the third bracket (taxed at 41%) was increased by one-quarter in the period 2011–2013, which provided a relief for taxpayers with incomes approximately 1.5 times the average wage. In 2017, the third bracket was split into two brackets, which are taxed at 34% and 39%, respectively. Thus, Slovenia ends the period with the five-rate schedule.
Croatia has changed the schedule on three occasions. In 2012, the threshold for the third bracket – taxed at 40% – was reduced by one-fifth. The 2015 reform represented a reversal of the preceding change, whereby the threshold for the third bracket was raised by one-half. In 2017, Croatia took a step further in relaxing the tax burden for taxpayers with the above-average income: the two rate schedule is introduced – with 24% and 36% rates – wherein the threshold for the top rate is further increased.
Slovenia and Slovakia do not have local personal income taxes, but Croatia has the local government ‘surtax’, which is obtained as the amount of PIT multiplied by the surtax rate. The surtax rate is determined by the city (municipality), and the rates range from 0% to 18%. The effective average surtax rate is between 10% and 12%.
5. Hypothetical tax wedge
In this section, we analyze the tax wedge in the three countries using the results obtained for a hypothetical wage earner, who is a single person without dependents.
The graphs in show MTW schedules separately for each country at the beginning (2011) and end (2017) of the analyzed period. Croatian PIT reforms have significantly extended the ‘zero’ bracket, i.e., the amount of income that is not taxed by PIT thanks to the general allowance. However, the abolition of the 12% rate means that taxpayers with the monthly gross wage in the range from EUR 640 to 900 are faced with higher MTW, namely 50%. The MTW is considerably decreased—by 12 percentage points—for gross wages between EUR 2100 and 3500. The downward step at approximately EUR 6200 is due to the ceiling on SICEE.
Figure 2. Marginal tax wedge for a hypothetical wage earner.
Notes: The graphs show MTWs for a hypothetical wage earner (single person without dependants) in 2011 and 2017. A Surtax rate of 12% is assumed for Croatia. MTW is the percentage ratio between the change in the amount of total taxes (PIT + SICEE + SICER) and the change in total labour cost when GEI is increased by a small amount. Computations are made using EUROMOD and miCROmodA. The exchange rate for Croatian data is HRK/EUR = 7.5 in all years. MTW is presented only for gross wages exceeding the minimum gross wage. Diamond marks in the graph for Slovenia denote the MTW exceeding 100%.
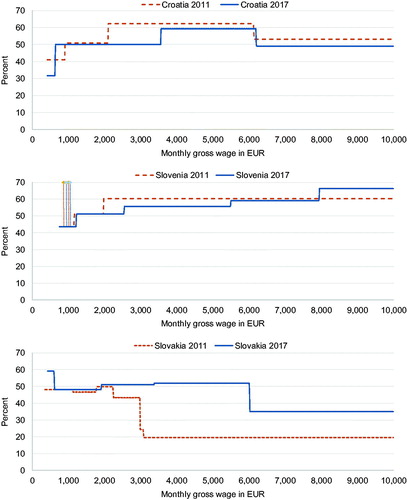
The graph for Slovenia contains a peculiarity, which requires an explanation. Recall that the general allowance differs by the incomes of taxpayers, which are put into three income brackets. When income increases by a small amount, a taxpayer can move from a lower bracket to a higher one, which causes a reduction of the allowance and a jump in the PIT obligation that is higher than the increase in income; this leads to a MTW above 100%. There are two such points in the Slovenian schedule, and the corresponding MTWs are denoted using the diamond marks.
Because the number of rates has increased from three to five, there are two more steps in the Slovenian schedule in 2017. Taxpayers with gross income between EUR 2000 and 7900 are faced with lower MTW. However, the MTW rose by more than six percentage points for those above EUR 7900.
The changes in the ceilings of Slovakian SICs have dramatically increased MTW at the interval from EUR 3000 to 6000. Another interesting feature of the 2017 Slovakian schedule is a hump for gross wages between EUR 420 and 620. This interval is when the allowance for the health insurance contribution is at work; it is designed to fall with gross income at a double rate, which causes an additional marginal tax burden at the mentioned interval.
The graphs in show ATW for hypothetical earners in the three countries in 2011, 2014 and 2017. Similarly, as in Čok et al. (Citation2013), the ATW is obtained for an ‘average worker’ and for several absolute values of the monthly gross wage. However, in this case, the average worker is the one having the average GEI per month, as obtained for ‘selected employees’ ( in Appendix).17
Figure 3. Average tax wedge for a hypothetical wage earner.
Notes: The graph shows ATW for a hypothetical wage earner—a single person without dependants. AGEI represents the average GEI per month. A surtax rate of 12% is assumed for Croatia. At each level of monthly gross wage, ATW is obtained as the percentage share of total taxes (SICER + SICEE + PIT) in total labour cost (gross wage + SICER). Computations are made using EUROMOD and miCROmodA. The exchange rate for Croatian data is HRK/EUR = 7.5 in all years.
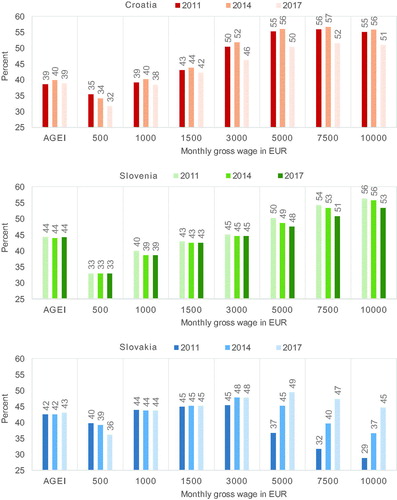
In 2014, ATW in Croatia increases in comparison to 2011 for all levels of gross wages except for EUR 500. This increase is a consequence of the 2012 reform, which increased the general personal allowance but squeezed the second income bracket. However, the 2015 and 2017 reforms decreased ATW for all income groups, particularly for gross wages between EUR 3000 and 7500 (by more than five percentage points).
Slovenia also decreases ATW for all income groups, but for gross wages up to EUR 3000, the decline is less than one percentage point. More significant decreases are made for the highest monthly gross wages – those of EUR 7500 and 10,000 – about 2.5 half percentage points. In 2017, the levels of ATW in Croatia and Slovenia are quite similar for different gross wages expressed in EUR.
Slovakia has a different pattern of ATW than the aforementioned countries. Developments during the period are also distinguished. Focusing on 2011, the ATW is flat and very high for gross wages up to EUR 3000. Beyond that point, the wedge falls steeply thanks to low SIC ceilings. However, in 2014 and 2017, the ATW significantly increases for high-income groups due to the changes in the ceilings. The tax burden falls only for the lowest wages, which is due to the introduction of the allowance for the health insurance contribution.
The difference in ATW between Croatia (Slovenia) and Slovakia for the highest gross incomes fell from 25 to fewer than 10 percentage points during the period of study.
6. Empirical tax wedge
presents the median MTW, which is obtained separately for each quantile group. The highest median MTW – of all subgroups shown in the figure – is for the Slovenian top 0.2% of employees (income group q999–1000) in 2014 and 2017. This figure amounts to 66%, which means that two-thirds of the marginal increase in the employers’ outlays go to the general government. In contrast, the lowest MTW for the top 0.2% of employees is observed in Slovakia 2011, at ‘only’ 36%.
Figure 4. Median marginal tax wedge by quantile groups.
Notes: MTW is computed for “selected employees” according to the methodology described in section 2.1. Tax systems are specified in section 4.
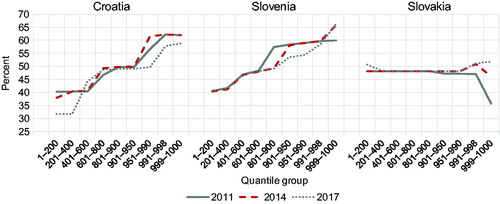
Croatia and Slovenia introduced PIT reforms that decreased marginal tax rates. However, when the final year of the period (2017) is compared to the starting year (2011), neither of the two countries has achieved a lower median MTW for all quantile groups. Namely, Croatia has a higher median MTW for groups q401–600 and q601–800, which is due to replacement of the 12% PIT rate with the 24% rate in 2017. Slovenia has a higher median MTW for the group q999–1000 thanks to the introduction of the 50% top marginal rate in 2013. By increasing the levels of SIC ceilings, Slovakia has significantly increased MTW for the top 1% of employees, from 36% in 2011 to 52% in 2017.
As a consequence of all these changes, the Slovakian mean ATW has increased by 1.3 percentage points during the period, and in 2017, it is higher than the Slovenian mean ATW (). Croatia has the lowest mean ATW during the whole period, particularly in 2017.
shows the median ATWs obtained for quantile groups in the three countries.18 When 2017 is compared to 2011, Croatia and Slovakia represent complete opposites: the former (the latter) country decreased (increased) ATWs for all quantile groups. The largest decreases are observed for the top 1% of employees in Croatia – five percentage points. At the same time, the median ATW for the group q999–1000 in Slovakia increases by six percentage points.
Figure 5. Median average tax wedge by quantile groups.
Notes: ATW is computed for “selected employees” according to the methodology described in section 2.1. Tax systems are specified in section 4.
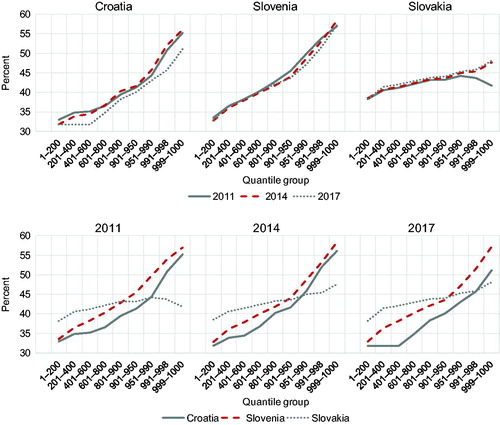
PIT reforms have ensured that Croatia remains a country with the lowest ATW for the bottom 90% of employees. Regarding the top 0.2% of employees (q999-q1000), the difference between Croatia and Slovakia fell from 12.6 percentage points in 2011 to only 1.7 percentage points in 2017.
Despite all the changes in the PIT system, the Croatian tax wedge remained progressive, which is evidenced by the increasing slope of the median ATW curve (). However, the progressivity – measured by the difference between the median ATW for the highest and the lowest quantile groups – has decreased by four percentage points. The opposite has occurred in Slovakia, which has increased the progressivity of ATW; the difference between the highest and the lowest quantile groups rose from 4 (2011) to 10 (2017) percentage points.
7. Income redistribution
In this section, we analyse the impact of tax-benefit systems on income distribution in the three countries at the household level. The methodology for calculating redistributive effects is explained in Section 2.3. Pre-fiscal income is the sum of original incomes, public pensions and private transfers. Original incomes are inclusive of all SICs, which implies the assumption that employees bear the whole burden of direct taxes, i.e., SICER, SICEE and PIT. The inclusion of public pensions into pre-fiscal income means that we treat them not as social benefits but as equivalent to market incomes. Incomes, taxes and benefits are equalized using the ‘modified OECD scale’, which appoints the value of 1.0 to the first adult in a household, 0.5 to all other adults, and 0.3 to children.19
shows the results that are obtained for the 2011, 2014 and 2017 tax-benefit systems. First, note the significant differences among the three countries in pre-fiscal income inequality: it is highest in Croatia (), followed by Slovenia (
) and Slovakia (
).
Table 5. Redistributive effects of fiscal systems.
In 2011, the vertical effect of the fiscal system () is highest in Slovenia (0.1142), followed by Croatia (0.0997) and Slovakia (0.0965). The horizontal effect (
) is somewhat higher in Slovenia (0.0147) and Slovakia (0.0132) than in Croatia (0.0100). As in the case of the vertical effect, the highest inequality effect (
) is in Slovenia (0.0095), followed by Croatia (0.0897) and Slovakia (0.0833).
The decomposition of the vertical effect shows that taxes on labor income (SICER, SICEE and PIT) are major contributors to income inequality reduction. As a package, in 2011, their vertical effect represents 16.3%, 18.6% and 20.6% of the vertical effect of the fiscal systems in Croatia, Slovenia and Slovakia, respectively. The contribution of SICs remains constant during the analyzed period in Croatia and Slovenia but rises in Slovakia due to the increase in SIC ceilings.
In Slovakia, the contribution of PIT remains constant during the period of analysis, despite the introduction of the 25% top rate. The reason for this neutrality may lie in the fact that the increased progressivity of SICEE has decreased the inequality of pre-PIT income and consequently the progressivity of PIT. The contribution of Croatian PIT has risen in 2014 compared to 2011 due to the 2012 reform, but the 2015 and 2017 reforms have significantly reduced its vertical strength, primarily because the share of PIT has fallen from 5% to only 4% of pre-fiscal income. In Slovenia, the contribution of PIT has been decreasing: the impact of tax-burden relaxation for above-average incomes was stronger than the impact of the higher burden for top incomes.
In comparison to 2014, the vertical effect of fiscal systems in 2017 is lower in Croatia (by 0.008) and Slovenia (by 0.004), whereas the decline in Slovakia is negligible. Consequently, the difference in post-fiscal income inequality between Croatia and the other two countries becomes even larger; equals 0.311 in Croatia 2017, which is 44% and 23% higher than in Slovakia and Slovenia, respectively.20
8. Discussion and conclusion
In this paper, we analyzed developments in labor taxation in Croatia, Slovenia and Slovakia during the 2011–2017 period. All three countries were quite active in reforming their tax systems, but the underlying motivation, the scope of changes, and the impacts on the labor tax burden were different. Using microsimulation models and EU-SILC data, we provided detailed insights into the changes in marginal and average tax wedges and income inequality that were induced by the PIT and SIC reforms.
The least-reformed country was Slovenia, which increased the number of marginal PIT rates from three (16–27–41 percent) in 2012 to five (16–27–34–39–50 percent) in 2017. The top rate of 50% applies to taxpayers with income more than four times the average wage. The new tax schedule brings modest relief to the tax burden (by two percentage points of ATW) for employees between the 80th and 99th percentiles of wage distribution. The average tax wedge remained stable during the period, but the progressivity of PIT was slightly reduced.
Slovakia abandoned its flat-rate PIT in 2013 to introduce a two-rate system (19–25 percent), wherein the top rate captures employees with income more than four times the average wage. However, a much larger impact on the labor tax burden was created by the changes in the SIC system, wherein the base ceilings (applicable to almost all types of SICs, both employee and employer) have been significantly increased, from four to seven gross wages. These changes increased the ATW of the top 0.2% of employees by seven percentage points during the period. However, because the targeted group is quite small, the effect on tax progressivity was very modest. The ATW has increased for all income groups by 1.3 percentage points on average, which is the consequence of rising wages combined with fixed amounts of personal allowances and other forms of relief.
The most comprehensive changes occurred in Croatia, which in 2017 replaced its three-rate PIT (12–25–40 percent) with the two-rate system (24–36 percent). This change was coupled with substantial increases in personal allowances and the threshold for the top marginal rate. The top percentile group of employees has seen a decrease in ATW of approximately five percentage points, with an overall average decrease in ATW of two percentage points. Although the average burden was reduced for all income groups, some of them experienced a rise in the MTW, namely, those between the 40th and 60th percentiles; this increase was due to abolition of the 12% marginal PIT rate. The rise in disposable income inequality (due to the fall of vertical effect of PIT) was not dramatic, approximately 0.6 Gini points.
Evidently, the motivations underlying the reforms in the three countries were different. Behind the decreases in marginal tax rates for the upper-middle classes (Slovenia) and top income classes (Croatia) was a desire of policy makers to improve the work incentives of employees in these groups. Such measures decrease total government revenue, and Slovenia could compensate by taxing more top-income employees, which could also improve PIT progressivity. By contrast, one of Croatia’s obvious goals was to provide fiscal stimulus, and the government renounced a considerable share of PIT revenue.21 Slovakia was primarily dealing with ‘fairness’ issues but also succeeded in raising more tax revenue.
Slovakia and Slovenia have much lower disposable income inequality than Croatia. The ‘pro-rich’ changes of Croatian PIT have further increased this gap, which might create future incentives for policy makers to revert the PIT system. However, the analysis indicates that such changes would have only limited effects on income distribution. While Croatia has similar redistributive effects of the fiscal system as the other two countries, it has much higher inequality of pre-fiscal income, which, in our analysis, consists of original incomes and pensions. To lower the inequality of pre-fiscal income, Croatia should continue pursuing policies oriented to increasing the employment rate – by lowering unemployment, by encouraging able-to-work inactive persons to enter the labor force, and by preventing early retirement.
By analysing these three countries together, we gained an understanding of the processes involved and how particular policy measures led to different outcomes in countries with relatively similar backgrounds. This information would not be possible to obtain in a single-country analysis or in an analysis of a panel of many countries. The latter type of analysis would require the researchers to focus only on major viewpoints, while the feature of country similarity would be lost. We believe that for the purpose of our analysis it is better to compare similar countries rather than those that are distant in geographical, socio-economic and demographic terms. This belief relates to the question ‘What can we learn from our neighbors in terms of policy design?’ From the Croatian perspective, for example, the candidates for such a comparison could also be Austria, Italy or Serbia. However, in Croatian domestic policy discussions it is very common to find Slovenia and Slovakia (rather than the other countries mentioned) being used as the benchmarks and role models. In this respect, this research has provided many details that go well beyond the typical discussions about the economic and policy differences among the three countries. Future research can utilize more heterogeneous country samples.
Acknowledgements
The authors would like to thank two anonymous reviewers for useful suggestions. Some of the results presented in this paper are based on EUROMOD version H0.34. EUROMOD is maintained, developed and managed by the Institute for Social and Economic Research (ISER) at the University of Essex, in collaboration with national teams from the EU member states. The authors are indebted to the many people who have contributed to the development of EUROMOD. The process of extending and updating EUROMOD is financially supported by the European Union Programme for Employment and Social Innovation ‘Easi’ (2014–2020). EUROMOD utilizes microdata from the EU Statistics on Incomes and Living Conditions (EU-SILC) made available by Eurostat (59/2013-EU-SILC-LFS). The views expressed in this paper, as well as any possible errors and omissions, should be attributed solely to the authors.
Disclosure statement
No potential conflict of interest was reported by the author.
Additional information
Funding
Notes
1 Income from regular employment is covered, whereas income from self-employment and occasional work based on one-time contracts is not included.
2 In 2017, GDP at current market prices (in billion EUR, PPP) was 76 in Croatia, 52 in Slovenia and 125 in Slovakia. GDP per capita in PPP was 61 in Croatia, 85 in Slovenia and 77 Slovakia (EU 28 = 100) (EUROSTAT, Citation2019).
3 EU-SILC NDB 2015 is the national database, collected by the Croatian Bureau of Statistics through the Income and Living Conditions Survey (Croatian original name: Anketa o dohotku stanovništva). It serves as a basis for building EU-SILC UDB 2015.
4 Defined as „requited and unrequited compulsory payments to privately-managed funds, welfare agencies or social insurance schemes outside general governments and to public enterprises“. The term non-tax compulsory payments should not be confused with non-taxable employment income, which represents the components of employment income that are exempted from taxation by SICs and PITs. See below for more on the latter term.
5 These are usually work-related allowances paid to employees, such as travel-to-work and cost-of-meal compensations. They also include vacation and holiday supplements, gifts to newborn children, etc.
6 Nevertheless, the effect is relatively mild: an increase in the tax wedge by one percentage point is associated with a decrease in employment growth by 0.04 (0.08) percentage points for EU-27 (12 new member states). Qualitatively and quantitatively similar results were obtained by Zimčík (Citation2017) for 26 OECD countries in the 2000–2016 period.
7 The same can be said for researchers from other countries in the former Yugoslavia. For example, see Mojsoska-Blaževski (Citation2012), Ranđelović and Žarković Rakić, (Citation2013) and Žarković Rakić (Citation2015).
8 For the average worker, Slovenia had a higher tax wedge than Croatia; the reverse is true for all absolute levels of gross annual wages (10, 20, 30, 50 and 100 thousand euros).
9 Croatia is not an OECD member.
10 Several countries with a high index of employment protection legislation and a high tax wedge were classified into the group containing low unemployment and high employment countries, and vice versa. Grdović Gnip and Tomić, (Citation2010) have also calculated a tax wedge that combines the burden of PIT, employee SIC and value added (VAT), but they did not perform further analysis.
11 In this review, we concentrate on taxation of employment income; for more details on other aspects of taxation, see EUROMOD Country Reports (see references in section 2.1).
12 The exception is the Croatian “general health contribution”, whose rate from May 2012 to March 2014 equalled 13%; before and after this period, the rate was 15%. Following EUROMOD practice, we consider only the rules valid in June 30 of each respective year.
13 There is no ceiling for the “accident insurance contribution”.
14 For a wage earner, the allowance is obtained as the difference between the gross minimum wage and the double difference between gross employment income and the gross minimum wage.
15 The threshold and the basic amount are determined using the “minimum subsistence level”, which equalled EUR 185.38 in 2011, and EUR 198.09 since 2014.
16 In Slovenia, this allowance also applies to dependent parents. In Croatia, the coverage extends to virtually all dependent relatives (except children).
17 Here again we diverge from the Taxing Wages methodology, which, among other things, takes into account only those employees in certain sectors of economy (OECD, Citation2018b). Their average gross earnings for Slovenia and Slovakia in 2017 are EUR 18,904 and 11,426, respectively.
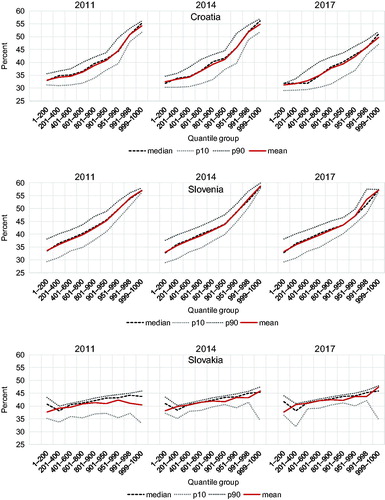
18 Additional results are given in the Appendix. shows the mean ATR by quantile groups. shows mean ATR for each quantile groups, as well as the 10th, 50th and 90th percentile values.
19 Children are persons aged 0 to 13 years. Adults are persons aged 14 or more years.
20 The same trend is observed for „potential“post-fiscal income inequality (i.e., one that would be achieved in the absence of horizontal inequity), which is measured by
21 Despite the substantial lowering of the tax wedge in the 2015–2017 period, domestic stakeholders in Croatia – including government, employers, unions, economic analysts, etc. – still seem to believe that the tax wedge is “too high”. In 2018, the Croatian Ministry of Finance prepared proposals for changes to the PIT and SIC laws in the direction of even lower labour tax burdens. The proposal includes the raising of the threshold for the top PIT rate from HRK 210,000 to 360,000. The combined SICER rate should be decreased from 17.2% to 16.5%.
References
- Čok, M., Grulja, M. A., Turk, T., & Verbič, M. (2013). Taxation of wages in the Alps-Adriatic region. Financial Theory and Practice, 37(3), 259–277. doi: 10.3326/fintp.37.3.2
- Daveri, F., & Tabellini, G. (2000). Unemployment, growth and taxation in industrial countries. Economic Policy, 15(30), 48–104. doi: 10.1111/1468-0327.00057
- Deskar-Škrbić, M., Drezgić, S., & Šimović, H. (2018). Tax policy and labour market in Croatia: Effects of tax wedge on employment. Economic Research-Ekonomska Istraživanja, 31(1), 1218–1227. doi: 10.1080/1331677X.2018.1456359
- Dolenc, P., & Laporšek, S. (2010). Tax wedge on labour and its effect on employment growth in the European Union. Prague Economic Papers, 2010(4), 344–358. doi: 10.18267/j.pep.381
- Dolenc, P., Laporšek, S., & Šeparović, A. (2011). Does labour taxation affect unemployment? Croatian worker in international perspective. Economic Research-Ekonomska Istraživanja, 24(3), 86–101. doi: 10.1080/1331677X.2011.11517469
- Dolenc, P., & Vodopivec, M. (2005). The tax wedge in Slovenia: International comparison and policy recommendations. Financial Theory and Practice, 29(3), 229–243.
- European Commission. (2018a). Data on taxation. Retrieved October 10, 2018, from https://ec.europa.eu/taxation_customs/business/economic-analysis-taxation/data-taxation_en
- European Commission. (2018b). Taxation trends in the European Union. Luxembourg: Publications Office of the European Union. Retrieved January 20, 2019 from https://ec.europa.eu/taxation_customs/sites/taxation/files/taxation_trends_report_2018.pdf
- EUROSTAT. (2018). Various statistics. Database. Retrieved October 10, 2018, from https://ec.europa.eu/eurostat/data/database
- EUROSTAT. (2019). National accounts and GDP. Statistics Explained. Retrieved January 20, 2019, from https://ec.europa.eu/eurostat/statistics-explained/index.php?title=National_accounts_and_GDP
- Gabik, R., & Paur, D. (2017). EUROMOD Country Report: Slovakia 2014–2017. EUROMOD Country Reports. Institute for Social and Economic Research.
- Grdović Gnip, A., & Tomić, I. (2010). How hard does the tax bite hurt? Croatian vs. European worker. Financial Theory and Practice, 34(2), 109–142.
- Immervoll, H. (2004). Average and marginal effective tax rates facing workers in the EU (Working Papers, 19). OECD Social, Employment and Migration.
- Kakwani, N. C. (1984). On the measurement of tax progressivity and redistributive effects of taxes with applications to horizontal and vertical equity. In R. L. Basmann & G. F. Rhodes (Eds.), Economic inequality: Measurement and policy (Advances in econometrics), (Vol. 3, pp. 149–168). Greenwich, CT: JAI Press.
- Kump, N., Čok, M., & Majcen, B. (2017). EUROMOD country report: Slovenia 2014–2017. EUROMOD country reports. Institute for Social and Economic Research.
- Lambert, P. J. (1985). On the redistributive effect of taxes and benefits. Scottish Journal of Political Economy, 32(1), 39–54. doi: 10.1111/j.1467-9485.1985.tb00786.x
- Lambert, P. J. (2001). The distribution and redistribution of income. Manchester: Manchester University Press.
- Lehmann, E., Lucifora, C., Moriconi, S., & Van der Linden, B. (2016). Beyond the labour income tax wedge: The unemployment-reducing effect of tax progressivity. International Tax and Public Finance, 23(3), 454–489. doi: 10.1007/s10797-015-9377-9
- Mojsoska-Blaževski, N. (2012). Taxation of labour: The effect of labour taxes and costs on employment in Macedonia. Post-Communist Economies, 24(2), 241–256. Routledge.
- Nadoveza, O., Sekur, T., & Beg, M. (2016). General equilibrium effects of lower labor tax burden in Croatia. Zagreb International Review of Economics and Business, 19(s1), 1–14. doi: 10.1515/zireb-2016-0009
- Nickell, S., Nunziata, L., & Ochel, W. (2005). Unemployment in the OECD since the 1960 s. What do we know?. The Economic Journal, 115(500), 1–27. doi: 10.1111/j.1468-0297.2004.00958.x
- Nickell, S. (2004). Employment and Taxes. Retrieved from https://ideas.repec.org/p/cep/cepdps/dp0634.html
- OECD (2010). Tax Policy Reform and Economic Growth. Paris: OECD Publishing. doi: 10.1787/9789264091085-en
- OECD (2016). Tax Policy Reforms in the OECD 2016. Paris: OECD Publishing. doi: 10.1787/9789264260399-en
- OECD (2017). Tax Policy Reforms 2017. Paris: OECD Publishing. doi:Doi.org/10.1787/9789264279919-en
- OECD (2018a). Tax Policy Reforms 2018. Paris: OECD Publishing. doi: 10.1787/9789264304468-en
- OECD (2018b). Taxing Wages 2018. Paris: OECD Publishing. doi: 10.1787/tax_wages-2018-en
- OECD (2018c). Taxing Wages 2016–2017. Associated paper: Non-tax compulsory payments. Paris: OECD Publishing.
- Ranđelović, S., & Žarković Rakić, J. (2013). Improving work incentives in Serbia: Evaluation of a tax policy reform using SRMOD. International Journal of Microsimulation, 6(1), 157–176.
- Šeparović, A. (2009). The influence of the tax wedge on unemployment in OECD countries in comparison with Croatia. Financial Theory and Practice, 33(4), 449–463.
- Sutherland, H., & Figari, F. (2013). EUROMOD: The European Union tax-benefit microsimulation model. International Journal of Microsimulation, 6(1), 4–26.
- Urban, I. (2016). Tax wedge on labour income in Croatia and the European Union. Financial Theory and Practice, 40(2), 157–168. doi: 10.3326/fintp.40.2.1
- Urban, I., Bezeredi, S., & Pezer, M. (2017). EUROMOD country report: Croatia 2014–2017. EUROMOD country reports. Institute for Social and Economic Research.
- Urban, I., Bezeredi, S., & Pezer, M. (2018). miCROmodA report 2014–2018. Zagreb: Institute of Public Finance. doi: 10.3326/pr.2017.92
- Žarković Rakić, J. (2015). Employment effects of tax cuts in a transition country: Evidence from Serbia. Post-Communist Economies, 27(3), 395–410.
- Zimčík, P. (2017). Tax wedge in OECD countries - A new evidence. In V. Nálepová and J. Šťastná (Eds.), Paper presented at the Proceedings of the International Scientific Conference Economic Policy in Global Environment (pp. 311–320). Havířov: Vysoká škola sociálně správní.
Appendix
Table A1. Basic information on taxation of employment income in Croatia, 2011–2017.
Table A2. Basic information on taxation of employment income in Slovenia, 2011–2017.
Table A3. Basic information on taxation of employment income in Slovakia, 2011–2017.
Table A4. Rates and ceilings of social insurance contributions.
Table A5. Average annual gross employment income and mean average tax wedge by quantile groups.
Figure A1. Mean and median average tax wedge by quantile groups.
Notes: ATW is computed for “selected employees” according to the methodology described in section 2.1. Tax systems are specified in section 4.