?Mathematical formulae have been encoded as MathML and are displayed in this HTML version using MathJax in order to improve their display. Uncheck the box to turn MathJax off. This feature requires Javascript. Click on a formula to zoom.
Abstract
This article discusses the methodology of developing tools for assessing regulatory factors and managerial impacts on the regional economy and individual sectors and businesses. The potential of projection models is investigated, including balance models, convergence of regional and sectoral projection and compiling reliable and representative data sets capable of describing the current economic situation. An attempt was made to develop a series of models for several regional economies; to that end, the modelling of managerial and regulatory impact assessment was used in combination with the well-known value chain approach. In the interests of effective public administration, one of the requirements is to create sectoral model formats compatible with the regional projection models. Results of pilot modelling managerial and regulatory impacts on Kaliningrad region’s economies are presented through examples of agribusiness, transport, industry, tourism and recreation. Implementation of regulatory impact modelling in the framework of the suggested approach is proved for other regions. The main advantage of the developed models for the regional management is their ability to reduce uncertainty in decision-making due to obtaining estimates of the impact of the decisions on the changing situation and the conditions for the development of sectors and industries.
1. Introduction
In a dynamically changing external environment, with power redistribution in the sphere of federal relations and the need to replace budget financing with private investments, governance at the regional level must be transformed to comply with new requirements for the quality of decisions taken. Thus, there appears to be a need to search for new effective tools capable of assessing the impact of managerial and regulatory measures on the state and development of regional economies and the region as a whole (e.g., Baldwin, Cave & Lodge, Citation2010; Klimenko & Minchenko, Citation2016; Kuzmin & Tsygankov, Citation2013; OECD, Citation2016). Traditional approaches to management and regional economic modelling neither foster prompt analysis of various regulatory impacts, nor do they justify their choice under specific conditions (Voloshenko & Ponomarev, Citation2017). This also applies fully to the regulatory impact assessment (RIA), whose methodology is now increasingly characterised by the description of procedures rather than technically accurate calculations of the consequences of specific measures (OECD, Citation2008).
Today, because of increasingly unreliable information, it becomes hard to analyse the consequences of regulatory impacts by intuitive methods or using simple estimates alone. However, given the complexity of inter-relationships in regional economies, there is no standing practice of using various types of models to support and justify decision-making, or they are used unsystematically (e.g., Meter & Goldenberg, Citation2015; Voloshenko & Ponomarev, Citation2017; Weisbrod, 2008). On that account, experts have to accept for granted objectively incorrect evaluations and judgements, which appear to be only situationally favourable. Hence, at least three types of hazards arise as a result of insufficiently systematic assessment of the effectiveness and the consequences of regulatory decisions. First, the relationship network around the problem is often beyond the expert’s intuition and is not accurately reflected in statistical estimates. Second, certain measures and management mechanisms in a particular sector can affect related sectors and spheres and those effects need to be accounted for and assessed in detail. Third, there are issues regarding more rational use of limited funds at both regional and municipal levels to stimulate the economic development of the territory. Given the situation described above, when the accuracy of the analysis is hampered by the lack of reliable data and the use of intuitive methods, it becomes apparent that there is a need to develop a specific set of tools and models for the assessment of managerial and regulatory impacts.
Given the current expectations and the need to find efficient tools for improving the quality of public administration at the regional level, the purpose of this study was to develop generic sectoral models (using the example of the Kaliningrad region). The models are to be used in the analysis of individual managerial and regulatory impacts on the indicators of sectoral state and development, alongside the possibility to match them to changes in the regional economy as a whole. In the course of the research, well-known approaches to simulation were used in combination with qualitative and quantitative methods, supplemented by the construction of economic and mathematical optimisation models.
The novelty of the study is conditioned by the development of an analytical tool for the preparation and substantiation of decisions in the field of public administration at the regional level. Important is its applicability in situations with a high degree of uncertainty, accompanied by abrupt changes in business conditions, when regional models do not yield acceptable convergence of forecasts.
The main limitation of the research in relation to different regions appears to be an insufficient information base (statistics, observation results, expert estimates, etc.) for the models. Each single case requires meticulous preparation of specified information tailored for assessment purposes and the types of regulatory impacts in question. To a large extent, this limitation determines the level of complexity of the models under design; however, at the same time, it provides opportunities for in-depth analysis and for increasing the number of estimated output indicators (for example, additional jobs, prices and tariffs, wages, taxes, resource returns, etc.). Since the research was carried out in the framework of the part of the pilot project specifically devoted to the development and testing of special tools, as a case, we chose the consequences of the measures taken to increase the level of localisation, with the added value as the main integral indicator.
Following the logic of the research, this article consistently examines the problems of applying regional models and presents the results of development and approbation of pilot sectoral models in the Kaliningrad region; it also offers some suggestions for their implementation in regional economic management.
2. Theoretical background: the issues of using regional models for managerial and regulatory impact assessment
To date, national and international practice has seen a large number of forecast regional models of various types: trend, balance, econometric, those of general dynamic equilibrium, of situational forecasting, as well as those using simulation technology, etc. The review of the models can be found in the authors' earlier works (Gareev & Voloshenko, Citation2015; Voloshenko & Kuznetsova, Citation2014).
In recent years, inter-branch models for the analysis and forecasting of regional economic development have gained popularity across the world. Special software packages and ready-made models are developed, for example, for the US economy - RIMS-II1 (Regional Input-Output Modelling System), IMPLAN2 (IMPACT Analysis for PLANning), REMI3 (Regional Economic Models: PI +, TranSight, Tax -PI, E3 +); for the UK economy - UK-MRIO (multi-region input-output model for UK), MDM-E34 (Multisectoral Dynamic Model of the UK economy, energy-environment-economy), for the economy of the Netherlands – IRIOS5 (Inter Regional Input-Output Software); for the Chinese economy – CHIOMS6 (Chinese Input-Output Modelling System), etc. In Russia, there is RIM7 (Russian Interindustry Model: CONTO, L-FORM, NORM), SIRENA, and SIRENA-2 (Synthesis of regional and national economic solutions). There is also software and methodological complexes for individual regions: Primorsky Krai, Republic of Sakha, the Republic of Bashkortostan, the Republic of Buryatia, the Ivanovo region, the Kaliningrad region, Moscow, and St. Petersburg, etc. (e.g., Granberg, Citation1988; Gorshenina, Citation2009; Tsybatov, Citation2016).
The well-known types of regional models make it possible to analyse macroeconomic trends very effectively; in the framework of current institutional ‘rules of the game’ and given smooth changes in the structure of the regional economy, those models are capable of predicting a significant number of socio-economic indicators, including assessment of alternative measures of economic policy at the regional level. However, in a situation of high uncertainty accompanied by abrupt changes in business conditions, the existing regional models do not warrant any acceptable convergence of forecasts (e.g., Nilsson, Jordan, Turnpenny, et al., Citation2008). Moreover, variously detailed calculations do not make it possible to assess managerial and regulatory impacts. As a consequence, decision-making is reduced to expert judgements or historical analogies, which leads to biased views and erroneous assessments resulting in ineffective measures, and, in a worst case scenario, to irrational budget allocations and expenditures.
Apart from the above-mentioned hindrances in regional model use, the authors share the view that there are additional restrictions, such as the issues of model applicability and the type of relationship between the model and the modelled. This issue is in the focus of current academic studies of epistemis status of economic models (e.g., Fedin, Citation2017; Koshovets & Varkhotov, Citation2015; Rodrik, Citation2015).
These difficulties are particularly relevant to the Kaliningrad region, whose exclave position determines the specific functioning of the regional economy and whose prospects and conditions for development depend on several factors: Russia’s economic situation, the world market situation in general, and the scale and directionality of external transactions (e.g., Fedorov, Korneevets, Tarasov, & Chasovskiy, Citation2016; Gareev & Voloshenko, Citation2015). At the same time, this provides an opportunity to highlight—on the example of the exclave's economy—the importance to create special tools for assessing managerial and regulatory impacts. The economy of the Kaliningrad region has enjoyed coverage in numerous publications devoted to the research carried out over the past 25 years. The scope of issues is widely presented in the Baltic Region journal8 published jointly by the St. Petersburg State University and the I. Kant Baltic Federal University.
Vivid examples of the Kaliningrad region’s economy in 2014–2017 show that their evaluation cannot be performed without additional economic and mathematical calculations within the framework of specially created regional software products or add-ins to known regional models. Among those examples should be mentioned a change in the geography of supply owing to US and EU-imposed sanctions against Russia and the allocation of subsidies to support the labour market and to compensate for rail transportation. Of particular importance is the assessment of the consequences caused by the 2017 amendments to the socio-economic development of the Kaliningrad Region (Federal Law No. 393-FZ of 5 December 2017 ‘On Amending Certain Legislative Acts of the Russian Federation on the Issues of Social and Economic Development of the Kaliningrad Region’). There is also a decrease in the minimum investment threshold for certain categories of SEZ residents (IT—up to 1 million roubles; healthcare—up to 10 million roubles); a reduction of insurance premiums from 30% to 7.6% for new residents; a simplified procedure for issuing electronic visas for foreigners; and a reduction of the length of state expertise, etc.
It should be noted that these issues require prompt response and elaboration—which is not the case, given considerably long, and often expensive, programme development. In this regard, it seems reasonable to work out simulation models that are rationally aggregated at the level of economic sectors.
Most regional models intended for forecasting socio-economic development rest on the macroeconomic model. In varying degrees, and depending on the detail of the reproduction process, this model estimates the boundaries of the gross output growth and that of gross value added in the region. Research conducted in Russia and beyond shows that the methodology for creating such models most often hinges on the theory of value chains (Porter, Citation2005). At present, researchers lean towards global value chains (e.g., Amador & Cabral, Citation2016; Banga, Citation2014; Cattaneo, Gereffi, & Staritz, Citation2010; Ju & Yu, 2015; Kaplinsky & Morris, 2003; Kaplinsky, Terheggen, & Tijaja, Citation2011; Kwon & Ryou, 2015; Mayer, Phillips, & Posthuma, Citation2017; WTO, Citation2013); the current methodology gravitates to the analysis of input–output tables (e.g., Lenzen, Moran, & Kanemoto, Citation2013; Los, Timmer, & de Vries, Citation2015; Suder, Liesch, Inomata, Mihailova, & Meng, Citation2015).
Despite the change in priorities in the study of the issue, practice and experience in building models based on the analysis of value chains open up the possibilities to research various aspects of inter-firm cooperation and, in general, to identify factors and conditions for the growth or redistribution of value added. Therefore, it is possible to construct sectoral models based on the described approaches by identifying them as fit to solve problems of assessing regulatory impacts on the state of production facilities, complexes and sectors and their subsequent aggregation at the level of the regional economy through prognostic regional models.
3. Models of managerial and regulatory impact assessment: data and methodology
In 2014–2016, a group of IKBFU researchers (Kaliningrad, Russia) studied the principles of constructing such models for the Kaliningrad region, and further developed them for the agribusiness, transport, industry, tourism and recreation sectors. Project results can be found at: http://region.kantiana.ru. This portal is specifically created within the framework of the university information and analytical support system for IKBFU regional socio-economic research.
Therefore, the aim of this work was to form a methodological basis for the research project; to develop, and, in formats suitable for interfacing with regional models, to test a system of particular models on individual product chains and in certain sectors (manufacturers). For implementation purposes, sectoral models are regarded, provided they are interconnected with the software analysis of situational forecasting and the socio-economic development strategy of the Kaliningrad Region (Certificate of state registration of the computer program No. 2016617454 of 6 July 2016; the right holder: IKBFU). The above complex was developed on the basis of prof. V. A. Tsybatov’s (SSEU, Samara)9 ‘Region’ model of social and economic activity for the Russian subject (Tsybatov, Citation2016).
The framework of the project allowed the researchers to accomplish a set of tasks aimed to develop relevant methodological support and tools for modelling the managerial and regulatory impacts on the state and development of the economic sectors. They are as follows:
To work out a methodological approach to the description of product value chains and their aggregation within the framework of industries, complexes, and sectors;
To formalise the representation of product value chains;
To analyse the availability of baseline data for building product value chains in relation to the industries, complexes, and sectors under study;
To develop toolkits for collecting and aggregating data to be used to construct value chains and supplement them, in case complete and reliable information from their individual links or participants is unavailable; and
To work out a technique of interfacing it with regional models.
Within the framework of this study, product value chains were analysed for selected economic sectors in the Kaliningrad Region. The detail level of the product chains was determined through the analysis of inter-branch relations (Kaplinsky & Morris, 2003), starting from the sources of raw materials and materials for suppliers, and ending with finished products delivered to the end user and after-sales service. This approach makes it possible to establish the main activities (links) of the chains involved in creating product value for the end user.
Based on the identification results, the following value chains were selected:
Agro-industrial complex (AIC): processed vegetables, canned vegetables, meat and meat food products, milk and dairy products;
Industry (based on furniture production): furniture for bathrooms, kitchens, upholstered furniture, furniture for bedrooms and children’s rooms;
Transport: legal services were investigated in the framework of the Kaliningrad region’s participation in the deliveries from/to the Russian Federation (transit or final destination) by various types of transport services; and
Tourism and recreation: individual services were analysed as part of tourist product, depending on certain types of economic activities (accommodation, catering, tourist and excursion services).
The survey of economic subjects, regardless of their industry affiliation, included the following sets of questions:
General questions about activities of enterprises;
Financial and economic indicators;
Indicators of production costs;
State regulation and measures of state support;
Indicators characterising the market, technologies, investments; and
Indicators describing added value.
The information base for modelling rests on statistical data and is supplemented by the results of in-depth interviews and surveys of sectoral enterprises. Qualitative research methods were used to construct and evaluate value chains, since they are not taken into account by statistical bodies.
The research revealed that it was difficult to form a representative sample of enterprises due to their frequent refusal to participate in the survey. Therefore, a special methodology was developed to enable the use of expert estimates without reducing the representativeness of the input data.
The principal methodological provisions are as follows.
First, evaluating typical enterprises and constructing value chains for individual products within sectors;
Second, holding cross-interviews for managers and specialists of the enterprises representing various links in the production-distribution chain, with the use of production and accounting data;
Third, developing special output forms for their subsequent aggregation at production and sectoral levels. The forms contained information characterising value added in the context of supply-side stages and production costs of a particular type of product;
Fourth, aggregating data for individual products in several stages, with the structure and production scale of the sectors taken into account; and
Fifth, comparing the aggregated results of the sample survey with statistical data and industry reviews.
The main problems that undermined reliability of obtained information were related to the circumstances as follows:
Issues related to added value formation are directly linked to financial and economic performance of economic entities. This fact caused the respondents’ negative attitude, as they were unwilling to disseminate such information; hence, we often received distorted and contradictory assessments. In this paper we do not discuss categorical refusals to answer certain questions.
The subjects’ specific legal structure also limited the availability of some information. For example, in AIC (plant growing), a significant number of respondents were peasant farms enjoying simplified reporting forms in case they paid a single agricultural tax.
The existence of a shadow sector made it hard to objectively gauge the real added value in the links of value chains on the basis of reported financial and economic indicators.
Specificity of business models in the Kaliningrad region has led to break-ups of value chains for some products. For example, although several chain links may exist in the region, they do not interact, since the products are exported only to foreign markets (RF), while processors mainly work on imported raw materials and components.
The survey revealed that for individual product chains more than 60–80% of added value is created outside the region. In such cases we decided against including those chains in the survey, to reduce the likelihood of errors in estimates and calculations.
For example, a total of 47 interviews were conducted in the agro-industrial complex (crop, livestock and processing), among them 32 businesses (68.1%) were peasant farms and 15 (31.9%) were large processing enterprises in AIC. However, the total number of businesses under study is formed from typical enterprises participating in several food chains. In total, the share of these enterprises in the production and turnover of certain types of products is at least 50% and in some cases (for example, in the vegetable production) it reaches almost 100%. Therefore, given the scale and structure of the regional agribusiness complex in the Kaliningrad region, this sample, combined with statistical data, allowed us to describe the selected value chains. Thus formed, the information base resting on the assessment of convergence and verification of the received data provided statistically significant results.
Within the framework of sectoral models, the modelling of added value was carried out. It involved optimisation of the participant interaction in value chains, to meet the criterion of the maximum added value at the point of selling finished products—that is, at the output of the chain. Thus, the optimality criterion is the total amount of factor incomes created in the chain. The initial impetus for optimisation comes from defining the parameters of the demand function for the end product of the value chain, which makes sense both in terms of motivating the participants of the chain, and forming a value for the ultimate consumer.
The assumption was that, once a quasi-optimal system of interaction between participants in value chains was identified, it would give at least some guidance to the governing bodies as to how to prioritise regulatory impact mechanisms to stimulate and support the actants, so that the region could benefit in terms of the value added criterion. Undeniably, coming up with workable solutions will require a thorough analysis of the effectiveness of potential solutions using other criteria too (employment, wage level, provision of critical needs, etc.). In the Kaliningrad region, this is fully relevant for assessing the impact of subsidy and/or tariff policies that not only increase value added but significantly affect employment by stimulating and protecting existing industries and creating new ones.
Using the example of the AIC (Soldatova & Voloshenko, Citation2016), the model with interval parameters in the objective function and constraints looks as follows:
Objective function:
Constraints:
where
are compact intervals. That is:
– type of production resources
– type of production
– enterprise category index
– price of acquiring resources (products) from suppliers;
– volume of the j-type product in the k-type category of enterprises;
– norm of costs of i-type resources per unit of j-type products in the k-type category enterprises;
– the content of the i-type resource in the unit of j-type products in the k-type category of enterprises;
are the upper and lower boundaries of the corresponding intervals.
Modelling of added value is carried out with the view of the impact made by various internal and external factors on the condition and development of the sector. Such impacts change management conditions both for the sectors as a whole and for individual participants of the chain. In the course of constructing the model each impact factor was matched with at least one user-set input script parameter. Changing the input parameters allows you to specify scenarios that involve changing some of the impacts in the sector and, as a result, to assess their impact manifested by either growth or reduction of an integrated index, such as added value.
Methodologically, the construction of sectoral models enjoys the following possibilities. First, to solve a direct problem: to identify the degree of influence of individual, or a combination of several managerial or regulatory factors on the change in value added in the sector (specified by the user as scenario parameters). Second, to solve an inverse problem: which managerial and regulatory impacts are required to achieve the desired (target) state of the sector. These impacts are identified through the target value of the value added in the sector, or the conditions that affect its change. Third, search for the added value (both direct and inverse tasks), involves calculating all related and derivative indicators that characterise the state and development of the sector and the value chain. Those indicators are financial, economic, production, technical, and technological.
4. Results and discussion
Sectoral models were tested in the Kaliningrad region in the course of solving local issues for the region’s economic sectors.
4.1. AIC
The modelling of the added value of the agroindustrial complex in Kaliningrad region was carried out with the use of the value chains of main product types. The model is designed to optimise the interaction of chain participants according to the maximum added value criterion. Various factors of control impacts (such as the level of localisation, yield, production capacity, output of finished products, etc.) are taken into account. For example, using the model for the AIC we considered the conditions for the development of the dairy and vegetable production markets in the context of import prohibition on certain agricultural products, raw materials and foodstuffs.
Initial conditions for the approbation of the model were as follows.
Purpose: to regulate the level of localisation of regional production (by the example of agricultural producers). Base year: 2014.
Object of regulation: the share of imported components (raw materials, etc.). Variants of calculations for the share of imported components: (1) at the base year level; (2) reduced by 50% to the base year; (3) 0% of the base year level.
In all cases, the change in the exchange rate is taken into account in comparison with the terms of the base year. According to the Central Bank of Russia, the average nominal exchange rate of the euro to the rouble was 50.46 roubles in 2014, 67.43 roubles in 2015 and 74.06 roubles in 2016.10
With the market of milk and dairy products as an example, the selected results of the approbation of the model are given in Appendix 1 and in and .
According to the results shown in Appendix 1, a decrease in the share of imports in agricultural production leads to an obviously smaller reduction in the value added in the chain compared to the base year (in variant 1 = 10.29%; variant 2 = –8.54%); meanwhile, a drop in value added resulting from exchange rate fluctuations (option 1) ensures its subsequent increase by 6.59% (option 3) given the increase in the localisation of production.
In all variants, compared with the guaranteed value, there is an increase in added value () due to the fact that the rate of change in actual prices in the market turned out to be higher than the cost of purchasing resources from external suppliers.
However, when the exchange rate changes, measures to ensure localisation growth cannot compensate for the reduction in value added. Under scenario 3, the ‘scenario’ (actual) cost reaches the level of 1209.64 million roubles, while, without exchange rate fluctuations and the share of imports, it would be 1301.98 million roubles. With complete abandonment of imported components (), the added value of agricultural producers will still be lower than in the base year—566.40 against 614.09 million roubles.
Calculations generally indicate a reduction in costs for agricultural producers and an increase in added value in the chain, provided that the production localisation increases. Exchange rate fluctuations have a negative impact on added value growth (below 8–12%).
With full transition to domestic components, the optimal level of added value in the chain is not achieved (below 18%), either before or after the exchange rate fluctuations.
Therefore, additional mechanisms are required: first, reduction of imports at the processing level; second, cooperation and network interactions at the chain level; and third, special managerial or regulatory measures.
4.2. Transport
Modelling of the transport sector in the region is based on the SATTKO software (the System for Ascertaining the Transport Tariff and Added Value for the Organisation of Transportation by Various Types of Transport in the Kaliningrad Oblast). Calculations were made to estimate transportation and total delivery cost of certain cargoes, by the mode of transport and by destinations (export and import; import to, and export from the Russian Federation; transit). The model makes it possible to gauge the conditions of inter-transport switching by certain types of cargo, and to estimate added value at the stages of its formation in the sector: legal support, insurance, storage, loading and packaging, transport leasing and transportation.
With the added value in detail, the model has the following form:
where V is the total cost of all stages of transportation; Vo is the cost of the transport company for the provision of the service; Va is added value at a certain stage of the transport process. Index values: J = legal services; I = insurance; K = storage (forced and contractual); L + p = loading and packaging; R + t = rent of transport and transportation; N = the number of the factor affecting the element of the cost of the transport process; Na = the maximum number of factors affecting the value added phase; No = the maximum number of factors affecting the costs of this stage; and εn = the indicators reflecting the factors influencing the added value of a separate stage of the transport process.
Examples of calculations in SATTKO are given in Appendix 2.11
Based on the simulation results for a hypothetical example of cargo transportation using the available modes of transport, the complex cost of cargo delivery is calculated, the cost structure for transportation is determined and the value added is formed. According to the results shown in Appendix 2, advantages of the automobile type of transport are obvious: it ensures the lowest cost of complex cargo delivery (38,706 roubles) alongside the largest added value (25,758 roubles).
These results allow us to justify the choice of cargo transportation and to optimise the prioritisation of transport development during the modernisation of the Kaliningrad region’s economic structure. The calculation of added value comprises detailed information on the types of operations, which makes it possible to identify the potential for added value growth in the sector ().
4.3. Manufacture
Furniture manufacturing in the Kaliningrad region was taken as an example for modelling the industry. On the basis of the added value chain of hypothetical furniture products in the region, an operating model was constructed for a specific case of commercial production and sales through wholesale-retail channels.
In the ‘industry’ section of the research, the inverse problem was solved, with furniture manufacturing serving as an example. The formation of value added in value chains was evaluated for pessimistic, optimistic and compromise scenarios (exchange rate fluctuations, purchasing power of the population, cost of labour, consumer preferences, cost of funds, tax burden, etc.). Thus, it became possible to identify managerial and regulatory factors promoting long-term sustainability and production in the sector.
A crucial role is played by the measures influencing technical and technological levels of production (for example, technical requirements and standardisation, provided that the products meet customer and consumer requirements and those of the industry in general) and transport tariffs and the measures taken to support integration in unfavourable market conditions. Regarding other industries and regions, the degree of influence of individual measures requires independent study and evaluation.
Below is an example of modelling, provided the exchange factor and the level of localisation maximise the added value. Hypothetical furniture products are investigated. The model is based on the actual data as of 2014–2015 provided by the furniture manufacturers of the Kaliningrad region. In compliance with the requirements for non-disclosure of commercial information, only a fragment of the model is given. The model is used for the purpose of increasing the level of localisation (see Appendix 3).12
The data in Appendix 3 demonstrate that the reduction in the supply of imported materials and furniture components, in particular from the EU countries (Russia’s share increases from 6% to 20% and China’s from 12% to 30%), adversely affects the financial and economic indicators and leads to reduction of the added value by 5.4% (1453.70 against 1538.18 thousand roubles). Similar results were obtained using the model for optimising the interaction of participants in the chain by the criterion of the maximum value added.
This indicates a lack of measures to orientate the supply of raw materials and components only to domestic markets in an unfavourable situation, which requires the application of special control measures, as well as their detailed evaluation with subsequent use of the model.
4.4. Tourism and recreation
For creating value added in the tourism and recreation sector of the Kaliningrad Region, a two-dimensional model is presented here, for estimating the value added when major investment projects are planned for implementation, with resource constraints taken into account.
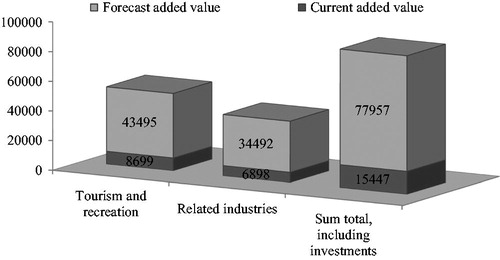
gives a general characteristic, and shows the assessment results based on the example of an investment project in the Kaliningrad region for the construction of a yacht marina on the Trostyanka River (Zelenogradsk district of the Kaliningrad region).13
Table 1. Estimation of the need for resources for investment project implementation.
According to , the implementation of the project will increase the value added in the sector by 8.7 billion roubles, which in addition to its current level accounts for ∼ 30.0%. In the long-term, a gain of another 43.5 billion roubles is planned if domestic tourism is adapted to the chosen scenario. In total, related industries (trade, construction, education, household, financial services, etc.) will receive about 6.9 billion roubles with subsequent growth of 34.5 billion roubles.
The above model made it possible to estimate the following investment tourist and recreational projects planned for implementation in the Kaliningrad region: modernisation of the Khrabrovo airport, construction of a variety show venue, construction of the World Cup 2018 facilities, construction of The Amberland in Kulikovo, etc.
The limitations and constraints taken into account were as follows: human resources; infrastructure; capacity of recreation; and entertainment and service facilities. The required amount of resources for implementing investment projects and possible multiplicative effects were estimated.
At present, work is underway to automatically configure the extensions of the IKBFU software-analytical complex for situational forecasting and the development of socio-economic strategy of the Kaliningrad region; the considered sectoral models are to serve as a basis for creating additional modules. It will create an opportunity to consider regulatory factors as scenario parameters for medium- and long-term modelling of social and economic activities of the Kaliningrad region.
5. Conclusion
In order to improve the quality of public administration at the regional level, it is proposed to develop and use model complexes to reduce the number of insufficiently rational and well-grounded solutions. They are proposed to include known forecast regional models and related sectoral ones. Accordingly, the first describe the macroeconomic conditions and the second deal with the effects of different types of regulatory impacts. It is planned to aggregate the assessment results in the sectors with regard to the changes in the regional economy as a whole. That said, unlike regional prognostic models, sectoral ones appear to be flexible enough to lend themselves to simple and quick adjustment and correction in response to the challenges. If the regional models are correctly developed methodology-wise, then the formation and use of this kind of sectoral model presents a scientific problem, whose solution was the aim of this study.
The advantages of the developed models and their possible practical applications are as follows:
First, the models make it possible to identify some of the likely problems that are not diagnosed by expert or statistical methods.
Second, they limit the use of knowingly unreliable information and logically incorrect judgements.
Third, they make it possible to offer unobvious solutions to the problems posed.
Fourth, they can significantly reduce the time for the analysis of the situation by constantly maintaining the information model of the region with a high level of structuring, completeness and reliability of data.
The proposed type of sectoral models provides for the construction of scenarios at different levels, with respect to individual participants, links and value chains in general, as well as those aggregated at the sectoral level of the regional economy. With harsh and often poorly predicted changes in management conditions at the regional level, they make it possible to assess the influence of a wide range of regulatory impacts for specific cases (for example, the Kaliningrad SEZ), as well as for general situations (administrative and economic ones).
To implement the suggested model, it is sufficient for the regional planner to have only basic knowledge of the system of economic indicators, staying within the framework of traditional statistical reports. We presume that understanding the structure and content of regional statistical information is a major requisite of any regional-level decision-maker.
Pilot calculations exemplified by the Kaliningrad region’s economic sectors show the availability and potential development of this type of model. The particularities of the initial database formation and the specificity of constructing sectoral models make them workable for other Russian regions. The application of sectoral models extends the modelling capacities of social and economic activities and makes them useful for forecasting and strategic planning both within the framework of a region and locally. Moreover, sectoral models enhance the scope for open, participatory and transparent regulatory measures as part of modern policy-making.
Acknowledgements
The authors express their gratitude to the IKBFU group of experts, young researchers and post-graduate students for their participation in constructing sectoral models. The latter were developed within the project for creating university analytical software for regional R&D support system in the socio-economic sphere.
Disclosure statement
No potential conflict of interest was reported by the authors.
Notes
1 RIMS user guide: https://www.bea.gov/regional/pdf/rims/RIMSII_User_Guide.pdf (accessed 7 December 2017).
2 IMPLAN website: http://implan.com/V4/Index.php (accessed 7 December 2017).
3 REMI website: http://www.remi.com/# (accessed 7 December 2017).
4 MDM-E3 website: https://www.camecon.com/how/mdm-e3-model/ (accessed 7 December 2017).
5 IRIOS website: https://www.rug.nl/research/reg/research/irios/?lang=en (accessed 7 December 2017).
6 CHIOMS website: http://inforumweb.umd.edu/services/models/chioms.html (accessed 7 December 2017).
7 RIM website: http://www.macroforecast.ru/ (accessed 7 December 2017).
8 The ‘Baltic Region’ journal website: https://journals.kantiana.ru/eng/baltic_region/ (accessed 7 December 2017).
9 The ‘Region’ model of social and economic activity of the subject of the Russian Federation is developed within a class of models regarding economic development as a result of its economic agents—the main subjects of socio-economic processes—activity. The main prototypes of the developed model are Computable general equilibrium models—CGE.
10 Statistics of The Bank of Russia: https://www.cbr.ru/statistics/ (accessed 7 December 2017).
11 The materials were prepared with the participation of A. Novikova, analyst of the Center for Modelling the Social and Economic Development of the Region and postgraduate student of the IKBFU Institute of Economics and Management.
12 The calculations were carried out with the participation of S. Soldatova, PhD, associate professor of the IKBFU Institute of Economics and Management.
13 The calculations were carried out by a group of experts led by E. Kropinova, PhD, Associate Professor of the IKBFU Department of Social and Cultural Service and Tourism of the Higher School of Tourism.
References
- Amador, J., & Cabral, S. (2016). Global value chains: A survey of drivers and measures. Journal of Economic Surveys, 30(2), 278–301. doi: 10.1111/joes.12097
- Baldwin, R., Cave, M., & Lodge, M. (2010). The Oxford handbook of regulation. Oxford: Oxford University Press.
- Banga, R. (2014). Linking into global value chains is not sufficient: Do you export domestic value added contents?. Journal of Economic Integration, 29(2), 267–297. doi: 10.11130/jei.2014.29.2.267
- Cattaneo, O., Gereffi, G., & Staritz, C. (2010). Global value chains in a postcrisis world: A development perspective. Washington, DC: World Bank.
- Fedin, S. V. (2017). Ekonomicheskaya model' kak tip sistemy, kak issledovatel'skaya konstrukciya i kak obraz [Type-models, instrument-models and image-models in economics]. Fundamental'nye Issledovaniya, 4, 406–410.
- Fedorov, G. M., Korneevets, V. S., Tarasov, I. N., & Chasovskiy, V. I. (2016). Russia among the countries of the Baltic region. International Journal of Economics and Financial Issues, 6(4), 1502–1506.
- Gareev, T. R., & Voloshenko, K. Y. (2015). Osobennosti postroeniya balansovoi modeli eksklavnogo regiona [Features of Balance Model Development of Exclave Region]. Ekonomika Regiona, 2(42), 113–134.
- Gorshenina, E. V. (2009). Regional'nye ekonomicheskie issledovaniya: Teoriya i praktika [Regional economic research: Theory and practice]. Tver: Tver State University.
- Granberg, A. G. (1988). Modelirovanie sotsialisticheskoi ekonomiki [Modeling of the Socialist Economy]. Moscow: Ekonomika. doi: 10.1086/ahr/83.1.237
- Ju, J., & Yu, X. (2015). Productivity, profitability, production and export structures along the value chain in China. Journal of Comparative Economics, 43(1), 33–54. doi: 10.1016/j.jce.2014.11.008
- Kaplinsky, R., & Morris, M. (2003). Handbook for value chain research. Brighton: Institute of development studies, University of Sussex.
- Kaplinsky, R., Terheggen, A., & Tijaja, J. (2011). China as a final market: The Gabon timber and Thai Cassava value chains. World Development, 39(7), 1177–1190. doi: 10.1016/j.worlddev.2010.12.007
- Klimenko, A. V., & Minchenko, O. S. (2016). State regulation of the economy: Theory and best practices. Public Administration Issues, 3, 7–30.
- Koshovets, O., & Varkhotov, T. (2015). Epistemologicheskiy status modeley i myslennykh eksperimentov v ekonomicheskoy teorii [Epistemological status of models and thought experiments in economics]. Voprosy Ekonomiki, 2, 123–141. doi: 10.32609/0042-8736-2015-2-123-140
- Kuzmin, A., & Tsygankov, D. (2013). The emerging field of evaluation and the growth of the evaluation profession: The Russian experience. Canadian Journal of Program Evaluation, 28(3), 87–102.
- Kwon, T., & Ryou, J.-W. (2015). Global value chains of East Asia: Trade in value added and vertical specialization. Asian Economic Journal, 29(2), 121–143. doi: 10.1111/asej.12051
- Lenzen, M., Moran, D., & Kanemoto, K. (2013). Building Eora: A global multi- region input-output database at high country and sector resolution. Economic Systems Research, 12(1), 37–41. doi: 10.1080/09535314.2013.769938
- Los, B., Timmer, M. P., & de Vries, G. J. (2015). How global are global value chains? A new approach to measure international fragmentation. Journal of Regional Science, 55(1), 66–92. doi: 10.1111/jors.12121
- Mayer, F. W., Phillips, N., & Posthuma, A. C. (2017). The political economy of governance in a ‘global value chain world’. New Political Economy, 22(2), 129–133. doi: 10.1080/13563467.2016.1273343
- Meter, K., & Goldenberg, M. P. (2015). Critical analysis of economic impact methodologies. In Exploring Economic and Health Impacts of Local Food Procurement. Chicago, IL: Illinois Public Health Institute.
- Nilsson, M., Jordan, A., Turnpenny, J., et al. (2008). The use and non-use of policy appraisal tools in public policy making: An analysis of three European countries and the European Union. Policy Sciences, 4(41), 335–355. doi: 10.1007/s11077-008-9071-1
- OECD. (2008). Building an institutional framework for regulatory impact analysis (RIA). France: OECD.
- OECD. (2016). Being an independent regulator, the governance of regulators. France: OECD.
- Porter, M. (2005). Konkurentnoe preimushchestvo: Kak dostich' vysokogo rezul'tata i obespechit' ego ustoichivost' [Competitive advantage: How to obtain a high result and to provide its stability]. Moscow: Alpina Business Books.
- Rodrik, D. (2015). Economic Rules: The Rights and Wrongs of The Dismal Science. New York: W.W. Norton.
- Soldatova, S. E., & Voloshenko, K. Y. (2016). Identifikatsiya i modelirovanie uchastiya predpriyatii regional'nogo APK v tsepochkakh sozdaniya stoimosti [Identifying and modeling the participation of regional agro-industrial sector producers in value chains]. Upravlencheskoe Konsul'tirovanie, 10, 83–92.
- Suder, G., Liesch, P. W., Inomata, S., Mihailova, I., & Meng, B. (2015). The evolving geography of production hubs and regional value chains across East Asia: Trade in value-added. Journal of World Business, 50(3), 404–416. doi: 10.1016/j.jwb.2014.05.003
- Tsybatov, V. A. (2016). Makroekonomicheskoe modelirovanie, prognozirovanie i planiovanie regionaln'ogo razvitiya [Macroeconomic modelling, forecasting and planning of regional development]. Samara: Samara state university of economics.
- Voloshenko, K. Y., & Kuznetsova, A. L. (2014). Opyt razrabotki i primeneniya balansovoi modeli upravleniya regional'nym razvitiem v spetsificheskikh territorial'nykh usloviyakh [The balance model of regional development management in certain territorial conditions: Development and application]. Baltic Region, 3(21), 7–26. doi: 10.5922/2079-8555-2014-3-1
- Voloshenko, K. Y., & Ponomarev, A. K. (2017). Introducing sectoral models into regional management: An assessment of regulatory impacts on the economy. Baltic Region, 9(4), 72–113. doi: 10.5922/2079-8555-2017-4-5
- Weisbrod, G. (2008). Models to predict the economic development impact of transportation projects: Historical experience and new applications. The Annals of Regional Science, 42(3), 519–543. doi: 10.1007/s00168-007-0184-9
- WTO. (2013). Global value chains in a changing world. Geneva: WTO Publications.
Appendix 1. Application of sectoral simulation models in the assessment of regulatory measures in the agro-industrial complex of the Kaliningrad region (using milk and dairy products as an example)
Appendix 2. Examples of calculations in SATTKO
Table A1. Initial data for modelling in SATTKO.
Table A2. Simulation results in SATTCO.
Appendix 3. Example of modelling, provided the exchange factor and the level of localisation maximise the added value of furniture production
Table A3. Initial data for modelling the level of localisation of furniture production (for hypothetical furniture products).
Table A4. Results of modelling the level of localisation of furniture production (for conventional furniture products), without optimisation.
Figure 1. Dynamics of added value in the chain (with milk and dairy products as an example) given a decrease in the share of imported components in comparable prices; million roubles. Source: Authors’ calculations.
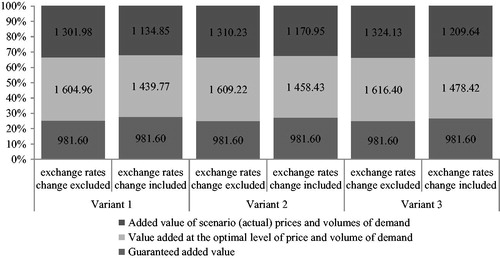
Figure 2. Dynamics of the added value of the participants in the chain (with milk and dairy products as an example) given a decrease in the share of imported components in comparable prices, million roubles: (a) added value in the chain in the optimal prices range and with optimal volume of demand; (b) added value at scenario (actual) prices and demand volumes. Source: Authors’ calculations.
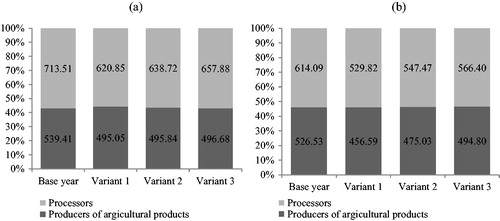
Figure 3. Structure of the integrated cost of cargo delivery to SATTKO by mode of transport, %. Source: Authors’ calculations.
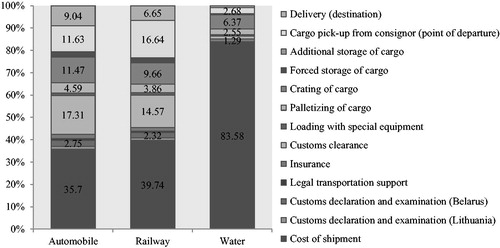
Figure 4. Value added in the tourism and recreation sector and related industries, according to investment project simulation results, mn roubles. Source: Authors’ calculations.