
 ?Mathematical formulae have been encoded as MathML and are displayed in this HTML version using MathJax in order to improve their display. Uncheck the box to turn MathJax off. This feature requires Javascript. Click on a formula to zoom.
Abstract
This paper introduces wavelet analysis as a tool for investigating the anchoring of inflation expectations in the United States. We show that the anchoring of inflation expectations varies for different groups of economic agents and changes across time and frequency. For consumers, we confirm significant lead-lag relationships between short- and long-term inflation expectations at medium frequencies of one to four years of scale, thus suggesting that short-term inflation expectations had fed into long-term inflation expectations over the crisis period. However, no such relationship is found for professional forecasters. These results indicate that long-term inflation expectations were de-anchored during the crisis period for consumers but not for professional forecasters. Although consumers’ long-term inflation expectations have been re-anchored since 2014 at medium frequencies, we find signs of de-anchoring at higher time scales of approximately eight years.
1. Introduction
Long-term inflation expectations are closely monitored by financial markets and are used as an indicator of the credibility of a central bank (Yellen, Citation2015). Anchoring inflation expectations at a level compatible with the central bank’s inflation target is of particular importance for economic stability. However, the debate over the (de-)anchoring of inflation expectations in the United States (U.S.) is mired in controversy by the outbreak of the financial crisis in 2008. Results ranging from perfect anchoring to de-anchoring present in empirical studies (e.g., Autrup & Grothe, Citation2014; Strohsal & Winkelmann, Citation2015). This article provides new empirical evidence regarding the anchoring of inflation expectations in the U.S. from a time-frequency viewpoint.
Transitory economic developments with no implications for the long run may affect short-term but not well-anchored long-term inflation expectations. There is evidence that short-term inflation expectations significantly respond to economic surprises stirred by the macroeconomic news (Autrup & Grothe, Citation2014). Thus, in the empirical literature, the pass-through criterion of Jochmann, Koop and Potter (Citation2010) and Gefang, Koop and Potter (Citation2012) defines inflation expectations as anchored if longer-term expectations do not respond to changes in shorter-term expectations. Another criterion, i.e., the news regression approach, exploits the idea that anchored inflation expectations should be insensitive to economic news (Beechey & Wright, Citation2009; Levin, Natalucci & Piger, Citation2004). For the U.S., recent contributions focus on whether macroeconomic news affects long-term inflation expectations. For example, Galati, Poelhekke and Zhou (Citation2011) and Autrup and Grothe (Citation2014) suggest a de-anchoring of inflation expectations after the outbreak of the financial crisis. By contrast, Strohsal and Winkelmann (Citation2015) argue no crisis-related effect. They conclude that inflation expectations were well-anchored before and after the financial crisis. According to the results of multiple endogenous break tests provided by Nautz and Strohsal (Citation2015), inflation expectations have not been re-anchored ever since in the U.S. Nevertheless, news-regressions investigate the anchoring of inflation expectations in a very short run, thus making the results tend to exaggerate the degree of de-anchoring if the estimated response to news actually dies out quickly (Nautz, Netšunajev & Strohsal, Citation2016). This paper studies whether short-term inflation expectations feed into long-term inflation expectations from a time-frequency view and contributes to the previous literature as follows.
First, we consider possible changes in the anchoring of inflation expectations in time and frequency domains. Although there is clear evidence supporting a time-varying anchoring of inflation expectations, most previous empirical studies assume an intrinsically constant degree of anchoring, e.g., Beechey, Johannsen and Levin (Citation2011). A time-varying anchoring of inflation expectations is estimated in certain studies through regime-dependent constant parameter models (Nautz, Pagenhardt & Strohsal, Citation2017) and time-varying parameter models (Demertzis, Marcellino & Viegi, Citation2012; Strohsal, Melnick & Nautz, Citation2016). Nevertheless, the possibility that the linkage between short- and long-term inflation expectations changes across frequency bands or, loosely speaking, ‘time intervals’ is rarely discussed. The effect of the crisis-related uncertainty on inflation expectations is undetermined. The quantitative easing (QE) programmes in 2008 and 2010 provided additional liquidities and might have led to increases in short-term inflation expectations. By contrast, the low and even negative inflation rates in approximately 2008 might have induced a deflationary spiral and thus triggered downward inflation expectations in short and long time horizons. However, the pattern and duration of such effects on inflation expectations with different time horizons are undetermined. Consequently, the transitions from short-term to long-term inflation expectations may emerge over certain time intervals but not in others. Previous studies focus on the dynamic changes of relationships between short- and long-term inflation expectations but do not consider differences through time intervals. Thus, the frequency is of importance to access the strength of the degree of anchoring over different time intervals and how such strength has evolved over time, capturing the possible dynamic changes in the relationship.
Second, we study inflation expectations of different groups of economic agents. Theoretically, inflation expectations of firms are important, as firms are price setters. Limited by data availability, consumers’ inflation expectations have been used to proxy firms’ expectations (e.g., Coibion & Gorodnichenko, Citation2015). Related to consumption, saving, and wage bargaining behaviors, consumers’ inflation expectations are important themselves. Professional forecasts of experts are viewed as a proxy for the rational expectation, which is used in many theoretical analyses (Xu, Chang, Lobonţ & Su, Citation2016). Meanwhile, experts and consumers have heterogeneous expectation updating frequencies (Xu, Liu, Jia & Su, Citation2017), thus making the linkage between short- and long-term inflation expectations diverge from one another. To the best of our knowledge, no officially published article considers both groups of agents in the U.S. in assessing the anchoring of inflation expectations. We provide a more complete picture of the anchoring of inflation expectations by comparing the results of consumers and professional forecasters.
Our results confirm that consumers’ long-term inflation expectations were de-anchored for the financial crisis period at the frequency of one to four years of scale but re-anchored after 2014 at the same frequencies. We show the possibility that consumers’ long-term inflation expectations have been de-anchored after 2006 at time scales higher than eight years. For professional forecasters, we find no evidence supporting that short-term inflation expectations have fed into long-term inflation expectations, thus implying a well-anchored long-term inflation expectation. The anchoring of long-term inflation expectations is used as an indicator of the credibility of a central bank and its ability to effectively maintain price stability (Acedański & Włodarczyk, Citation2016; Moessner, Citation2015; Nautz et al., Citation2017). Thereby, our findings indicate that the degree to which monetary policy is able to condition inflation expectations changes across time and frequencies and varies for different groups of economic agents. This may to a certain degree explain contradictory findings based on different time intervals and agents as reported in previous empirical studies.
The rest of the paper is organised as follows. Section 2 is a literature review. Section 3 introduces the methodology in measuring the relationship between short- and long-term inflation expectations. Section 4 presents the data. Section 5 investigates the anchoring of long-term inflation expectations, and Section 6 summarises the paper.
2. Literature review
In monetary policy practice and academic studies, if deviations from an inflation target are sufficiently small and short-lived, inflation expectations are seen as well anchored (Mehrotra & Yetman, Citation2014; Strohsal & Winkelmann, Citation2015). The empirical literature regarding the anchoring of inflation expectations is divided into two groups. The first strand of literature focuses on the news regression approach which is based on the idea that anchored inflation expectations should be insensitive to economic news (Beechey & Wright, Citation2009; Gürkaynak, Levin, Marder & Swanson, Citation2007). The second strand of literature uses the pass-through criterion of Jochmann et al. (Citation2010) and Gefang et al. (Citation2012), which defines inflation expectations as anchored if longer-term expectations do not respond to changes in shorter-term expectations.
If inflation expectations remain unaffected by the macroeconomic news, economic agents trust the central bank’s ability to maintain price stability. Recent empirical contributions suggest that, compared with countries with explicit inflation targets, inflation expectations are less anchored in the case of the U.S. For instance, Gürkaynak et al. (Citation2007) investigate the extent of long-run inflation expectations anchoring in Canada and Chile, both explicit inflation targeters, and that in the U.S., which has no such explicit inflation target. By examining the sensitivity of far-ahead forward inflation compensations to macroeconomic data releases and monetary policy announcements, they find that the degree of anchoring in the U.S. is weaker than that in Canada and Chile. Gurlaynak, Levin and Swanson (Citation2010) compare the anchoring of inflation expectations in the United Kingdom (U.K.), Sweden, and the U.S. through similar methods. They find that, since 1997, when the Bank of England (BOE) became independent, inflation expectations have been better anchored than before with the responsiveness of inflation expectations to news strongly decreased. As with prior research, they conclude that the anchoring of inflation expectations in the U.S. is weaker than that in the U.K. (after 1997) and Sweden, thus showing that a well-known and credible inflation target helps to anchor the private sector’s long-run inflation outcomes. Using pre-crisis data, Beechey et al. (Citation2011) propose that long-term inflation expectations display systematic sensitivity to economic surprises in the U.S. but not in the euro area. Thus, the inflation targeting policy and the elaborated communication strategy of the European Central Bank (ECB) may have contributed to the anchoring of inflation expectations in the euro area. Moessner (Citation2015) finds that the ECB’s balance sheet policy announcements in the wake of the financial crisis have weak effects on long-term inflation expectations.
Changes in the anchoring of inflation expectations over time are demonstrated in the literature. Galati et al. (Citation2011) use structural break tests to investigate the sensitivity of long-term expectations to news regarding inflation and additional domestic macroeconomic variables. Whereas there are crisis-related breaks in the news regressions for the U.S., the U.K., and the euro area, inflation expectations in the euro area remain well-anchored in the aftermath of the Lehman breakdown. However, inflation expectations in the U.S. become less firmly anchored during the crisis. The results of time-varying event study regressions in Scharnagl and Stapf (Citation2015) suggest that the reaction of inflation expectations to news for monetary policy announcements and macro variables ceases to be significant in 2011 and shows no increase since then. Ehrmann (Citation2015) estimates the relationship between the revision in the inflation expectation and the surprise component contained in news releases. According to the results, short-term inflation expectations (expectation for the next calendar year) are responsive to news, thus meaning that inflation expectations are not well anchored regardless of the inflation targeting policy. Meanwhile, the researcher finds that under (persistently) low inflation, the responsiveness seems to be muted, which suggests a better anchoring of inflation expectations under these circumstances. Nautz and Strohsal (Citation2015) introduce news regressions with multiple endogenous breaks to investigate the de- and re-anchoring of inflation expectations in the U.S. They confirm the de-anchoring of inflation expectations driven by the outbreak of the crisis and indicate that inflation expectations have not been re-anchored ever since. Nautz et al. (Citation2016) adopt the structural VAR analysis and show that the long-term consumers’ inflation expectations are anchored because macro-news shocks are long-run neutral in the U.S. Their findings indicate that the recent decline in long-term inflation expectations can be attributed to downward adjustments of consumers’ expectations regarding the central bank’s inflation target rather than a result of the de-anchoring of inflation expectations. Following Nautz and Strohsal (Citation2015), Nautz et al. (Citation2017) apply multiple endogenous break point tests to examine the de-anchoring and re-anchoring of inflation expectations in the euro area. The empirical results show that the sensitivity of euro area inflation expectations to the macroeconomic news is weak before September 2011. However, inflation expectations have been de-anchored ever since. Fracasso and Probo (Citation2017) specify a structural break at December 2011 in the long-term inflation expectation in the euro area. They confirm that long-term inflation expectations have been de-anchored since December 2011 and never reversed by testing whether inflation expectations have become sensitive to the arrival of economic news.
The pass-through criterion of Jochmann et al. (Citation2010) tests the extent to which news-driven short-term inflation expectations feed into long-term expectations. Jochmann et al., (Citation2010) use daily data on inflation compensation derived from the term structure of real and nominal interest rates and estimate the pass-through coefficient between short- and long-term inflation expectations. They provide evidence that the coefficients are not constant but small, thus indicating that the long-term inflation expectations are contained rather than well-anchored. Cecchetti, Natoli and Sigalotti (Citation2015) measure tail co-movement of short- and long-term inflation expectations based on the theory of copulas and the non-parametric TailCor indexes. They find that, since mid-2014, negative tail events impacting short-term inflation expectations have been increasingly channelled to long-term views, thereby signalling a de-anchoring of long-term inflation expectations in the euro area. Strohsal and Winkelmann (Citation2015) propose an exponential smooth transition autoregressive (ESTAR) model to analyse the anchoring of inflation expectations in the U.S., European Monetary Union (EMU), the U.K., and Sweden. Results based on daily financial market expectations suggest that the degree of anchoring varies substantially across countries and expectations’ horizons. Their results show that shorter-term expectations are better anchored than longer-term expectations and expectations are best anchored in the EMU, followed by the U.S., Sweden, and the U.K. A comparison of a pre-crisis sample and a crisis period (September 2008–February 2011) in the U.S. shows that the anchoring of shorter-term inflation expectations (five years) decreases but increases for longer-term (ten years). Even so, inflation expectations remain well-anchored for the crisis period. Strohsal et al. (Citation2016) introduce an encompassing time-varying parameter model to analyse the relationships among short- and long-term inflation expectations and lagged inflation in the U.S. They document that long-term inflation expectations respond to short-term expectations and not to lagged inflation. Furthermore, long-term inflation expectations have been partially de-anchored during the financial crisis period but successfully re-anchored ever since. Łyziak and Paloviita (Citation2017) examine the time-varying anchoring of survey-based inflation expectations of consumers and professional forecasters in the euro area. The results indicate that longer-term inflation expectations are more sensitive to shorter-term inflation expectations and actual inflation over the post-crisis period.
Recently, central banks such as the central bank of Sweden declared the implementation of inflation forecast targeting (IFT) which includes the macroeconomic forecast of central banks as an input of the deliberations and monetary policy adjustments (Tura-Gawron, Citation2017). As an important information source, professional forecasters’ inflation expectation is likely to be considered in central banks’ decision making procedure and thus affects consumers’ inflation expectations. The IFT influences consumers’ and professional forecasters’ inflation expectations indirectly and directly, respectively (Szyszko, Citation2017). The decision-making procedure of central banks is non-transparent. Therefore, the anchoring of inflation expectations tend to be different for consumers and professional forecasters.
So far, approaches in the empirical literature accounting for time-varying anchoring are based on regime-dependent constant parameter models (Autrup & Grothe, Citation2014; Galati et al., Citation2011), multiple endogenous break point tests (Nautz & Strohsal, Citation2015) or time-varying parameter methods (Strohsal et al., Citation2016). The difference across time intervals, or specifically, frequencies is rarely considered. As discussed in the introduction, information shocks such as financial crisis in 2008 and QE programmes may exert different effects on short- and long-term inflation expectations from duration and strength. As a consequence, instantaneous and long-run changes in short- and long-term inflation expectations may evolve in different time intervals, thereby making the linkage between them vary across frequencies. Following the literature that analyses inflation dynamics and other key macroeconomic variables considering the effects of time and frequency, we adopt the wavelet analysis to assess the strength of co-movements between short- and long-term inflation expectations over different time intervals and how such relationship evolve over time.
Compared with those standard economic tools used in the literature, the wavelet analysis reveals certain complex patterns of time series and corresponding relationships. For instance, Kim and In (Citation2005) and Durai and Bhaduri (Citation2009) use the wavelet analysis to investigate the relationship between inflation and stock returns. Their results show that time-frequency decomposition using wavelet analysis provides a valuable mean of testing the time-changing relationship between inflation and stock returns. They document that such relationships are different across short, intermediate, and long term scales. The wavelet analysis is widely accepted in researching the relationship between economic variables because they show significantly different properties across frequencies. For instance, the relationship between money growth and inflation, stock returns and economic activity, inflation and unemployment, money and output, social network sentiments and stock returns, and the business cycle synchronisation across different countries (Caraiani, Citation2012; Gallegati, Citation2008; Gallegati, Gallegati, Ramsey & Semmler, Citation2011; Jiang, Chang & Li, Citation2015; Soares, Citation2011; Xu, Liu, Zhao & Su, Citation2017). Recently, Xu, Liu and Ortiz (Citation2018) examined the correlation between actual and expected inflation in the U.S. through the wavelet coherence analysis. They document time-varying powers of actual and expected inflation at different frequencies and suggest a more robust lead-lag linkage between them at frequencies longer than four years of scale than short to medium term ones. Therefore, these studies suggest that the wavelet analysis is a proper method to analyse topics regarding inflation expectations which contain varying power across frequencies.
3. Methodology
This paper adopts the continuous wavelet analysis to investigate the dynamic relationship between short- and long-term inflation expectations. The continuous wavelet analysis is useful in exploring the correlation and lead-lag relationship between two time series. It expands the time series into a time-frequency space and assesses whether the relationship evolves with time and how it varies across frequencies. Furthermore, the continuous wavelet analysis is useful for processing non-stationary time series (Aguiar-Conraria & Soares, Citation2014; Grinsted, Moore & Jevrejeva, Citation2004).
The Wavelet Transform uses local base functions to decompose and superpose information and studies the time-frequency content of a signal. Local base functions can be stretched and translated with a flexible resolution in scale (frequency) and time domains. We can characterise a wavelet by how localised it is in time (Δt) and frequency (Δf or the bandwidth). When the bandwidth narrows, we assess low scales (high frequencies) and the time resolution adjusts to the frequency intrinsically. When the bandwidth widens, we focus on high scales (low frequencies). Consequently, the original signal is transformed into a two-dimensional plane of time-frequency (or time-scale). The Continuous Wavelet Transform (CWT) of a time series can be defined as follows:
(1)
(1)
where
means the complex conjugate of the basis wavelet
, which is oscillatory and of finite length. Thus, the Wavelet Transform decomposes the time series
based on certain basis wavelets that can be obtained by translation and dilation of a mother wavelet
.
(2)
(2)
where
denotes the translation parameter, and
indicates the scale parameter. The translation parameter determines the time position, and the dilation parameter is related to the width of the wavelet. The relationship between scale (
) and frequency (
) is simply
, which indicates that the wavelet scale is inversely related to the frequency. For
the wavelet is compressed and generates low scales which captures changes at high frequencies. For
the wavelet is the same as the mother wavelet. For
the wavelet is stretched and shows high scales which captures features at low frequencies.
Three criteria are necessary for a mother wavelet. First, , indicating that the mean of a wavelet must be zero. Secondly,
, meaning that the wavelet’ square integrated to unity. Finally,
, i.e., the admissibility condition.
, denoting the Fourier transform of the wavelet. The following Morlet wavelet is commonly used in the literature:
(3)
(3)
The Morlet wavelet is a complex sine wave within a Gaussian envelope. In EquationEquation (3)(3)
(3) ,
denotes the normalisation factor which ensures a unit energy of the wavelet function, and
ensures the admissibility condition. The wavenumber of
determines the oscillations within the Gaussian envelope and affects the tradeoff between time and frequency (scale) localisation. For an increase in
the frequency localisation is better and the time localisation is poorer. To balance time and frequency resolution,
is usually set to 6 (Rua, Citation2012). Meanwhile, as used in the literature, for
we can ignore the small value of
(Wang, Zhu & Dou, Citation2012). Hence, we get the following Morlet wavelet:
(4)
(4)
Several measures can be obtained according to the wavelet transform. For example, the wavelet power spectrum measures the local variance of
at each time and scale.
Analogously, one can define the cross-wavelet transform of two time series and
:
(Hudgins, Friehe & Mayer, Citation1993). Therefore, the covariance of two time series is expanded into a time-frequency plane. Furthermore, the wavelet coherency coefficient which measures the strength of the relationship between
and
is as follows:
(5)
(5)
where
is a smooth factor and
converts to an energy density (Torrence & Webster, Citation1999). The wavelet coherency coefficient measures the local strength of the relationship between the two series over time and across frequencies. A low (high) value of
indicates a weak (strong) co-movement between time series. By changing translation parameter and dilation parameter, one can distinguish the regions with strong relationships. According to Bloomfield, McAteer, Lites, Judge, Mathioudakis and Keenan (Citation2004), one can test the null and alternative hypothesis to measure the significance of wavelet coherency coefficients:
(6)
(6)
(7)
(7)
where
and
are the background spectra of
and
under the
distribution. The rejection of the null hypothesis
indicates that these two time series are correlated under the significance of 5%.
While the wavelet coherency can be used to test whether two time series have significant relationships, the value of it is positive, thus cannot distinguish between positive and negative correlations. The wavelet phase difference between two time series is thus computed to capture the lead-lag relationship between two variables.
(8)
(8)
where
and
are the imaginary and real components of the cross-wavelet transform
, respectively. The wavelet phase difference allows for the assessment of the lead-lag relationships in time and frequency domains. Graphically, we use arrows to represent phase differences. For
, the two time series are fully synchronised and the arrow at specific time and scale points to the right. Similarly, if the arrow points to the left, the variables are in the anti-phase, implying a negative relationship. For the lead-lag relationship, an arrow pointing up (down) denotes that
leads
(vice versa). The relationship between two variables is usually a combination of the two.
4. Data
In the case of consumers, we consider inflation expectations covering the period of 1990/04 to 2017/03 (monthly data), which includes the financial crisis and the current low inflation regime. The Survey of Consumer Attitudes and Behavior conducted by the University of Michigan Survey Research Center provides a unique set of monthly data on one-year ahead (short-term) and 5–10 years ahead (long-term) annual inflation expectations (Nautz et al., Citation2016). Because of the increased economic uncertainty and unconventional monetary policy measures implemented since the Lehman Brothers collapse, we pay special attention to possible changes in anchoring inflation expectations over the last few years. Thus, in the case of professional forecasters, we use data from 2005/Q3-2017/Q1 (quarterly data) provided by the Survey of Professional Forecasters (SPF). The SPF provides one-year ahead, five-year ahead, and ten-year ahead annual inflation expectations of professional forecasters. The 5–10 years ahead inflation expectation can thus be obtained as follows:
(9)
(9)
presents short-term (one-year ahead) and long-term (5–10 years ahead) inflation expectations of consumers and professional forecasters. It can be observed that consumers’ short- and long-term inflation expectations are above the implied inflation target of 2.0%. The distance of professional forecasters’ long-term inflation expectations to the implicit inflation target is moderately smaller compared with consumers. For both groups, short-term inflation expectations appear to be more fluctuating than long-term inflation expectations, particularly during the financial crisis period of 2008/09-2011/02 (Strohsal & Winkelmann, Citation2015). In recent years the U.S. has experienced widely differing inflation episodes: relatively stable price developments in the pre-crisis years, highly volatile inflation rates since the financial crisis and currently a comparative low inflation regime. As with the movement of inflation rates, short-term inflation expectations of both groups exhibit sharp ‘ups and downs’ during the crisis period and are at comparatively low levels in recent years. Long-term inflation expectations remain relatively stable, particularly for professional forecasters. The impact of financial crisis on the relationship between short- and long-term inflation expectations can be observed. Marginally declining trends of long-term inflation expectations appear in recent years, implying the possibility of de-anchoring.
Figure 1. Short-term and Long-term Inflation Expectations in the U.S.
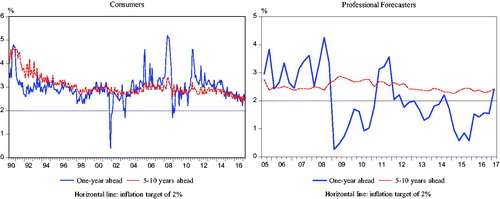
Among its responsibilities, maintaining price stability is one of the most important mandates for the Federal Reserve Bank (FRB). Central bank credibility can be gained, but it also can be lost (Nautz et al., Citation2017). Consequently, the degree of anchoring of inflation expectations is likely to change over time. Damaged by the financial crisis, consumers’ and professional forecasters’ short-term inflation expectations in approximately 2008 dropped to the lowest level after 1979. In response to the financial crisis, the central bank adopted unprecedented easing monetary policies that attempt to boost the economy (Xu et al., Citation2016). The FRB does not publish an official inflation target but is nevertheless able to communicate the level of long-term inflation objective to the markets (Strohsal et al., Citation2016). Since 2012, the FRB’s implicit inflation target has been clearly communicated via the publication with the reported value of the long-run inflation rate being 2%. Sharp changes in monetary policies and inflation expectations in recent decades raise the question of how the degree of anchoring of inflation expectations has evolved over time, particularly since the onset of the financial crisis.
5. Empirical results
5.1. Morlet wavelet power spectra of inflation expectations
presents Morlet wavelet power spectra of short- and long-term inflation expectations of consumers and professional forecasters. Time and scale are denoted on the horizontal and vertical axes, respectively. We categorise scales of lower than one year as high frequency, those between one year to four years as medium frequency, and those higher than four years as low frequency. The wavelet power spectrum measures the local variance of a variable. The black contour areas represent that the wavelet power spectra of certain variable are statistically significant at the 5% level. A high power value is represented by a highlighted red area, suggesting that the spectral energy is high, and vice versa. The high power areas indicate impulses from events, showing that the variable fluctuates significantly. The cones formed with bold black lines bending upward denote the Cones of Influence (COI), which represent the boundary conditions of the Morlet Wavelet Transform. The CWT assumes that the data are circulatory, thus making certain bias at the beginning and end of the sample period regarding finite-length time series. Thereby, outer regions of the COI indicate that fluctuations of variables are sensitive to the edge effect.
Figure 2. Wavelet power spectra of inflation expectations.
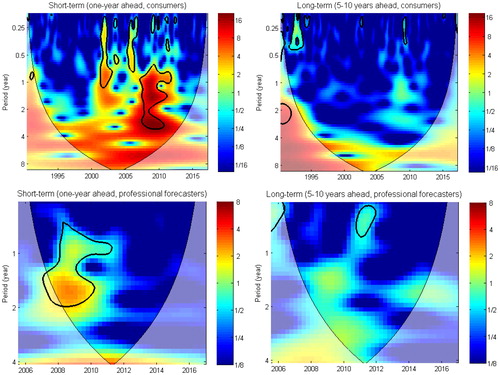
The wavelet power spectra provide a first assessment of the individual behaviour of data in a time and frequency varying framework. shows that movements of short-term inflation expectations fluctuate across time and frequency (scale) domains. The wavelet power spectrum of consumers’ short-term inflation expectations shows that this variable fluctuates significantly from 2001 to 2002 and from 2005 to 2006 in less than one year of scale, and from 2007 to 2011 at medium scales. Analogously, professional forecasters’ short-term inflation expectations exhibit significant fluctuations from 2007 to 2011 at low and medium scales. Significant variances of short-term inflation expectations appear mainly over the financial crisis period at medium scales. As noted in Łyziak and Paloviita (Citation2017), a credible central bank can affect short- and medium-term inflation expectations through its decisions and communications but maintain long-term inflation expectations anchored. Thereby, dynamic movements of short-term inflation expectations do not necessarily imply weak credibility of the central bank’s target and a de-anchoring of long-term inflation expectations. Nevertheless, the wavelet power spectrum indicates the possibility that fluctuating short-term inflation expectations may feed into long-term inflation expectations over the crisis period, particularly at medium time scales.
In the case of long-term inflation expectations, suggests that the local variance at each scale remains insignificant over most of the sample period, except for the period of 1992–1994 for consumers and in approximately 2011 for professional forecasters. Specifically, no significant fluctuation at medium and high scales is observed, indicating that, for consumers and professional forecasters, long-term inflation expectations are stable in the frequency band of higher than one year of scale. If the implicit inflation target maintains unchanged, indicates that the distance of consumers’ long-term inflation expectations to it remains stable over the financial crisis period. By contrast, such distance for professional forecasters changes from 2010 to 2012. Inflation expectations are well anchored if their distance to a more or less explicit inflation target is sufficiently small (Mehrotra & Yetman, Citation2014; Strohsal & Winkelmann, Citation2015). There is no explicit inflation target in the U.S. until 2012, when the FRB implicated an inflation target of 2% to the public. Thereby, whether the real inflation target maintains unchanged in the past decades is unknown. Consequently, insignificant changes in the long-term inflation expectation do not necessarily imply that it was well-anchored for past years. If the implied inflation target before 2012 was dynamic, long-term inflation expectations could be dis-anchored when their distance to the real inflation target is not sufficiently small. To capture the anchoring of inflation expectations, we apply another criterion that well-anchored long-term inflation expectations should not respond to changes in short-term inflation expectations (Strohsal et al., Citation2016). According to this criterion, we proceed to estimate the wavelet coherence coefficient and phase difference to research whether short-term inflation expectations have fed into long-term inflation expectations during past decades.
5.2. Coherence analysis
The wavelet coherency coefficient and phase difference measure the local strength of the co-movement and lead-lag relationship between two indices over time and across frequencies. and show the Morlet wavelet coherence spectra of inflation expectations of consumers and professional forecasters, respectively. The colour code for coherency coefficient ranges from blue corresponding to low coherency (close to zero) to red corresponding to high coherency (close to one). The thick black contour denotes the 5% significance level of the wavelet coherency coefficient. The critical values are estimated from a Monte Carlo simulation between 10,000 sets of two white noise time series with the same length studied in this paper. Within the designated areas the time series are significantly correlated at the 5% significance level. Analogously, there is a COI in the cross-spectral power, representing the boundary conditions. The arrows imply phase differences between series as defined in EquationEquation (8)(8)
(8) . Through and , we can identify both frequency bands (in the vertical axis) and time domains (in the horizontal axis) where the two indices move together. Moreover, we can explain the extent of the correlation between them across time and frequencies (scales).
Figure 3. Morlet wavelet transform cross-spectra and coherence spectra of consumers’ inflation expectations.
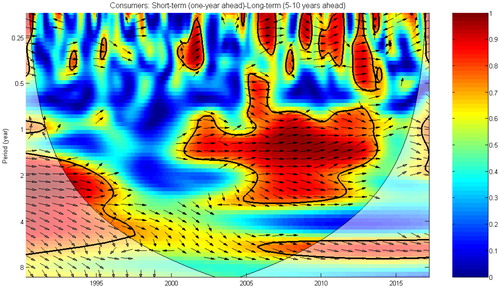
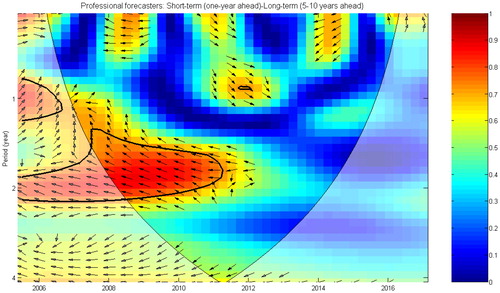
Figure 4. Morlet wavelet transform cross-spectra and coherence spectra of professional forecasters’ inflation expectations.
suggests that in the frequency band of lower than one year of scale, consumers’ short- and long-term inflation expectations present short-lived and discontinuous linkages during the period of 2000–2012 when the wavelet correlation coefficient between them is close to one. Most arrows point to the northeast, representing that the phase difference between consumers’ short- and long-term inflation expectations is between 0 and . The phase difference suggests that consumers’ long-term inflation expectations lead short-term inflation expectations positively. The co-movements across medium scales are more persistent and stronger than that in lower scales. As shown in , significant wavelet correlation coefficients appear during the periods of 1993–1995 and 2001–2013, suggesting positive relationships between short- and long-term inflation expectations, with the correlation coefficient larger than 0.8. Long-term inflation expectations in the U.S. appear to have remained stable since the late 1990s as shown in . The reason for that stability is open to debate, but the FRB’s actions to maintain inflation at relatively low and stable rates for three decades are an important part of the explanation. According to Xu et al. (Citation2018), the actual inflation exerts robust effects on consumers’ short-term inflation expectations at the frequency higher than two years of scale before 2011. The effect of actual inflation on short-term inflation expectations appears to have transited to long-term inflation expectations and thus resulted in the de-anchoring of long-term inflation expectations.
Before 2009, most arrows point to the southeast, representing that the phase difference between short- and long-term inflation expectations is between 0 and , thus showing that short-term inflation expectations lead long-term inflation expectations positively. However, from 2009 to 2013, there are certain arrows pointing to the northeast in the frequency band of approximately two years of scale, which means that long-term inflation expectations lead short-term inflation expectations. In estimating the transition speed of inflation expectations towards the inflation target, Strohsal and Winkelmann (Citation2015) demonstrate that the transition speed decreases at the three-year expectation horizon but increases at the ten-year horizon. In other words, compared with longer-term inflation expectations, shorter-term inflation expectations revise more slowly to the inflation target in recent years. This may to a certain extent explain the change in the lead-lag relationships between consumers’ short- and long-term inflation expectations. Similar to the crisis period, the de-anchoring of long-term inflation expectations is additionally observed in the period of 1993–1995, during which the U.S. was in turbulent times with the volatility of inflation expectations being high (Nautz et al., Citation2016). For high scales, relatively stable relationships emerge before 1997 and after 2006, with arrows pointing to the southeast. Thus, for long-run relationships, short-term inflation expectations lead long-term inflation expectations positively. The result that long-term inflation expectations are not firmly anchored over the crisis period agrees with certain literature (Galati et al., Citation2011, Autrup & Grothe, Citation2014). In the short run, however, the disturbing impact of short-term inflation expectations on long-term inflation expectations should not be ignored, particularly in turbulent times.
For professional forecasters, anti-phase relationships are observed before 2011 at medium scales, meaning that short- and long-term inflation expectations are negatively related. The directions of arrows suggest that short-term inflation expectations lead long-term inflation expectations. The results are in line with in which professional forecasters’ short- and long-term inflation expectations move in approximately opposite directions. However, no significant correlation coefficient between short- and long-term inflation expectations is found for professional forecasters over other periods. It is interesting to note that the regions of significant correlation coefficients are similar to those of significant local variances of short-term inflation expectations. and suggest that movements of professional forecasters’ long-term inflation expectations lead to fluctuations of short-term inflation expectations for the financial crisis period, rather than the reverse. The correlation coefficients before 2011 are significant, but the phase difference indicates that long-term inflation expectations lead short-term inflation expectations. In other words, no transition from short-term inflation expectations to long-term inflation expectations is observed. Thus, we can conclude that professional forecasters’ long-term inflation expectations were firmly anchored for the crisis period and maintain anchored ever since. The result agrees with Beechey et al. (Citation2011), in which the recent history of professional forecasters’ long-term inflation expectations in the U.S. paints a picture of reasonably well-anchored expectations.
Overall, from the perspective of time domain, the relationships between short- and long-term inflation expectations change over time for both consumers and professional forecasters. Whereas there is a time-varying anchoring of consumers’ long-term inflation expectations, professional forecasters’ long-term inflation expectations maintain well-anchored. Specifically, before 1997 and after 2001, consumers’ short-term inflation expectations exert positive effects on long-term inflation expectations. The results are in line with previous evidence provided by Gefang et al. (Citation2012) and Antunes (2015). Nevertheless, over other periods, no such linkage is observed, showing that consumers’ long-term inflation expectations are well-anchored during these periods. Although short- and long-term inflation expectations of both groups show downward trends after 2014, no significant relationship is demonstrated between these two time series. The result is consistent with Nautz et al. (Citation2016), implying that the decrease in long-term inflation expectations observed in can be attributed to downward adjustments of consumers’ expected or perceived inflation targets.
From the perspective of frequency domain, the de-anchoring of consumers’ long-term inflation expectations is observed across various scales. In other words, consumers’ short-term inflation expectations feed into long-term inflation expectations at different time scales. The de-anchoring of consumers’ long-term inflation expectations appears relatively strong in the case of medium scales, which is within the often defined policy horizon of central banks of a period up to three years (Strohsal & Winkelmann, Citation2015). A policy orientated interpretation of our finding may be that consumers expect an active role of policies against inflationary pressures at time scales of up to three years. Over a longer time scale, central banks’ policies are expected to be neutral (Chen & Netšunajev, Citation2016; Nautz et al., Citation2016), thus leading to the long-run revision of long-term inflation expectations towards the mean value. The long-term inflation expectations appear to have been re-anchored over the recent period at medium scales. There are significant correlations between consumers’ short- and long-term inflation expectations after 2014. We cannot identify the result as a de-anchoring of long-term inflation expectations in recent years because they are outside the COI. However, it is still important to note that there is a possibility that long-term inflation expectations may have been de-anchored ever since the financial crisis in the long-run.
We demonstrate that the relationships between short- and long-term inflation expectations vary across frequencies and over time and are heterogeneous for different agents. The results indicate that the implicit anchoring for long-term inflation expectations decreased over the financial crisis period for consumers but not for professional forecasters. One possible reason is that the private sector is uncertain about the central bank's inflation object, thus making their long-term inflation expectations prone to the revision of short-term inflation expectations in response to economic news (Nautz et al., Citation2016). The degree of anchoring professional forecasters’ long-term inflation expectations is better than that of consumers. The central bank’s ability to condition long-term inflation expectations differs among agents.
6. Conclusions
This article assesses the anchoring of long-term inflation expectations in the U.S. through the wavelet analysis, which is effective in capturing frequency and time-varying features within a unified framework. Economic time series shows different properties across frequencies and the relationship between two variables therefore changes across time scales. Stronger correlations are demonstrated at frequencies corresponding to periodicities of more than four years than at other frequencies between inflation and other variables such as money supply growth and inflation expectation (Assenmacher-Wesche, Gerlach, & Sekine, Citation2008; Assenmacher-Wesche & Gerlach, Citation2007, Assenmacher-Wesche & Gerlach, Citation2008; Xu et al., Citation2018). We note that from this perspective there are significant lead-lag relationships between consumers’ short- and long-term inflation expectations for the crisis period at medium frequency bands of one to four years of scale. We can conclude that the results based on wavelet analysis are consistent with earlier findings that the financial crisis has led to a significant reduction in the degree of anchoring of long-term inflation expectations for consumers but not for professional forecasters. Although that consumers’ long-term inflation expectations are re-anchored after 2014 at medium frequencies, there are signs of de-anchoring at higher time scales. An increasing sensitivity of long-term inflation expectations to short-term ones increases risks of de-anchoring, which means that inflationary or deflationary pressures may become self-fulfilling. No de-anchoring of long-term inflation expectations is found for professional forecasters across time and frequencies, thereby indicating that the central bank’s credibility varies for different groups of economic agents. Given that the anchoring of inflation expectations changes across frequencies (scales), horizons of policies aiming to manage inflation and its expectations should be considered with caution. Meanwhile, possible risks of de-anchoring of inflation expectations need to be monitored continuously.
Disclosure statement
No potential conflict of interest was reported by the authors.
References
- Acedański, J., & Włodarczyk, J. (2016). Dispersion of inflation expectations in the European Union during the global financial crisis. Equilibrium, 11(4), 737–749. doi:doi: 10.12775/EQUIL.2016.033
- Aguiar-Conraria, L., & Soares, M. J. (2014). The continuous wavelet transform: Moving beyond uni-and bivariate analysis. Journal of Economic Surveys, 28(2), 344–375. doi: 10.1111/joes.12012
- Antunes, A. A. (2015). Co-movement of revisions in short-and long-term inflation expectations. Banco de Portugal Economic Studies, 1(1), 1–19. Retrieved from: https://www.bportugal.pt/sites/default/files/anexos/papers/re201501_e.pdf
- Assenmacher-Wesche, K., & Gerlach, S. (2007). Understanding the link between money growth and inflation in the Euro Area. In Cobham D. (Ed.), The Travails of the Eurozone (pp. 10–41). London: Palgrave Macmillan. doi:https://doi.org/10.1057/9780230801479_2
- Assenmacher-Wesche, K., & Gerlach, S. (2008). Money growth, output gaps and inflation at low and high frequency: Spectral estimates for Switzerland. Journal of Economic Dynamics & Control, 32(2), 411–435. doi:doi: 10.1016/j.jedc.2007.02.002
- Assenmacher-Wesche, K., Gerlach, S., & Sekine, T. (2008). Monetary factors and inflation in Japan. Journal of the Japanese & International Economies, 22(3), 343–363. doi:doi: 10.1016/j.jjie.2007.09.001
- Autrup, S. L., & Grothe, M. (2014). Economic surprises and inflation expectations: Has anchoring of expectations survived the crisis? (ECB Working Paper No. 1671). Retrieved from SSRN: https://ssrn.com/abstract=2426087
- Beechey, M. J., & Wright, J. H. (2009). The high-frequency impact of news on long-term yields and forward rates: Is it real? Journal of Monetary Economics, 56(4), 535–544. doi: 10.1016/j.jmoneco.2009.03.011
- Beechey, M. J., Johannsen, B. K., & Levin, A. T. (2011). Are long-run inflation expectations anchored more firmly in the Euro area than in the United States? American Economic Journal: Macroeconomics, 3(2), 104–129. Retrieved from http://www.jstor.org/stable/41237144 doi: 10.1257/mac.3.2.104
- Bloomfield, D. S., McAteer, R. J., Lites, B. W., Judge, P. G., Mathioudakis, M., & Keenan, F. P. (2004). Wavelet phase coherence analysis: Application to a quiet-sun magnetic element. The Astrophysical Journal, 617(1), 623–632. doi:doi: 10.1086/425300
- Caraiani, P. (2012). Money and output: New evidence based on wavelet coherence. Economics Letters, 116(3), 547–550. doi:doi: 10.1016/j.econlet.2012.02.032
- Cecchetti, S., Natoli, F., & Sigalotti, L. (2015). Tail comovement in option-implied inflation expectations as an indicator of anchoring (Working paper, No. 1025), Banca d’Italia. Retrieved from SSRN: https://ssrn.com/abstract=2722436
- Chen, W., & Netšunajev, A. (2016). On the long-run neutrality of demand shocks. Economics Letters, 139, 57–60. doi: 10.1016/j.econlet.2015.11.039
- Coibion, O., & Gorodnichenko, Y. (2015). Is the Phillips curve alive and well after all? Inflation expectations and the missing disinflation. American Economic Journal: Macroeconomics, 7(1), 197–232. doi: 10.1257/mac.20130306
- Demertzis, M., Marcellino, M., & Viegi, N. (2012). A credibility proxy: Tracking US monetary developments. The BE Journal of Macroeconomics, 12(1), 1–36. doi: 10.1515/1935-1690.2442
- Durai, S. R. S., & Bhaduri, S. N. (2009). Stock prices, inflation and output: Evidence from wavelet analysis. Economic Modelling, 26(5), 1089–1092. doi:doi: 10.1016/j.econmod.2009.04.005
- Ehrmann, M. (2015). Targeting inflation from below: How do inflation expectations behave? International Journal of Central Banking, 11(4), 213–249.
- Fracasso, A., & Probo, R. (2017). When did inflation expectations in the Euro area de-anchor? Applied Economics Letters, 24(20), 1481–1485. doi:doi: 10.1080/13504851.2017.1287846
- Galati, G., Poelhekke, S., & Zhou, C. (2011). Did the crisis affect inflation expectations? International Journal of Central Banking, 7(1), 167–207. Retrieved from http://www.ijcb.org/journal/ijcb11q1a8.pdf
- Gallegati, M. (2008). Wavelet analysis of stock returns and aggregate economic activity. Computational Statistics and Data Analysis, 52(6), 3061–3074. doi:doi: 10.1016/j.csda.2007.07.019
- Gallegati, M., Gallegati, M., Ramsey, J. B., & Semmler, W. (2011). The US wage Phillips curve across frequencies and over time. Oxford Bulletin of Economics and Statistics, 73(4), 489–508. doi: 10.1111/j.1468-0084.2010.00624.x
- Gefang, D., Koop, G., & Potter, S. M. (2012). The dynamics of UK and US inflation expectations. Computational Statistics & Data Analysis, 56(11), 3120–3133. doi: 10.1016/j.csda.2011.07.008
- Grinsted, A., Moore, J. C., & Jevrejeva, S. (2004). Application of the cross wavelet transform and wavelet coherence to geophysical time series. Nonlinear Processes in Geophysics, 11(5/6), 561–566. Retrieved from https://hal.archives-ouvertes.fr/hal-00302394 doi: 10.5194/npg-11-561-2004
- Gurlaynak, R. S., Levin, A., & Swanson, E. (2010). Does inflation targeting anchor long-run inflation expectations. Evidence from the US, UK and Sweden. Journal of the European Economic Association, 8(6), 1208–1242. doi: 10.1111/j.1542-4774.2010.tb00553.x
- Gürkaynak, R. S., Levin, A. T., Marder, A. N., & Swanson, E. T. (2007). Inflation targeting and the anchoring of inflation expectations in the western hemisphere. Economic Review-Federal Reserve Bank of San Francisco, 25, 39–47.Retrieved from http://search.proquest.com.ezproxy.lib.uh.edu/docview/208775669?accountid=7107
- Hudgins, L., Friehe, C. A., & Mayer, M. E. (1993). Wavelet transforms and atmospheric turbulence. Physical Review Letters, 71(20), 3279. doi:doi: 10.1103/PhysRevLett.71.3279
- Jiang, C., Chang, T., & Li, X. L. (2015). Money growth and inflation in China: New evidence from a wavelet analysis. International Review of Economics and Finance, 35, 249–261. doi:doi: 10.1016/j.iref.2014.10.005
- Jochmann, M., Koop, G., & Potter, S. M. (2010). Modeling the dynamics of inflation compensation. Journal of Empirical Finance, 17(1), 157–167. doi: 10.1016/j.jempfin.2009.08.002
- Kim, S., & In, F. (2005). The relationship between stock returns and inflation: New evidence from wavelet analysis. Journal of Empirical Finance, 12(3), 435–444. doi:doi: 10.1016/j.jempfin.2004.04.008
- Levin, A. T., Natalucci, F. M., & Piger, J. (2004). Explicit inflation objectives and macroeconomic outcomes (ECB Working Paper, No. 383). Retrieved from SSRN: https://ssrn.com/abstract=569630
- Łyziak, T., & Paloviita, M. (2017). Anchoring of inflation expectations in the euro area: Recent evidence based on survey data. European Journal of Political Economy, 46, 52–73. doi: 10.1016/j.ejpoleco.2016.11.001
- Mehrotra, A. N., & Yetman, J. (2014). Decaying expectations: What inflation forecasts tell us about the anchoring of inflation expectations (BIS Working Paper, No. 464). Working Paper SSRN: https://ssrn.com/abstract=2501661
- Moessner, R. (2015). Effects of ECB balance sheet policy announcements on inflation expectations. Applied Economics Letters, 22(6), 483–487. doi:doi: 10.1080/13504851.2014.950791
- Nautz, D., & Strohsal, T. (2015). Are US inflation expectations re-anchored? Economics Letters, 127, 6–9. doi: 10.1016/j.econlet.2014.12.023
- Nautz, D., Netšunajev, A., & Strohsal, T. (2016). The anchoring of inflation expectations in the short and in the long run (SFB 649 Discussion Paper, No. 2016-015). Working Paper http://hdl.handle.net/10419/146184
- Nautz, D., Pagenhardt, L., & Strohsal, T. (2017). The (de-) anchoring of inflation expectations: New evidence from the euro area. The North American Journal of Economics and Finance, 40, 103–115. doi: 10.1016/j.najef.2017.02.002
- Rua, A. (2012). Money growth and inflation in the Euro Area: A time-frequency view. Oxford Bulletin of Economics and Statistics, 74(6), 875–885. doi: 10.1111/j.1468-0084.2011.00680.x
- Scharnagl, M., & Stapf, J. (2015). Inflation, deflation, and uncertainty: What drives Euro-Area option-implied inflation expectations, and are they still anchored in the sovereign debt crisis?. Economic Modelling, 48(C), 248–269. doi:doi: 10.1016/j.econmod.2014.11.025
- Soares, M. J. (2011). Business cycle synchronization and the Euro: A wavelet analysis. Journal of Macroeconomics, 33(3), 477–489. doi:https://doi.org/10.1016/j.jmacro.2011.02.005
- Strohsal, T., & Winkelmann, L. (2015). Assessing the anchoring of inflation expectations. Journal of International Money and Finance, 50, 33–48. doi: 10.1016/j.jimonfin.2014.09.001
- Strohsal, T., Melnick, R., & Nautz, D. (2016). The time-varying degree of inflation expectations anchoring. Journal of Macroeconomics, 48, 62–71. doi: 10.1016/j.jmacro.2016.02.002
- Szyszko, M. (2017). How the central bank makes decision on interest rates? A comparative analysis of forecast importance. Equilibrium, 12(2), 281–294. doi: 10.24136/eq.v12i1.15
- Torrence, C., & Webster, P. J. (1999). Interdecadal changes in the ENSO-monsoon system. Journal of Climate, 12(8), 2679–2690. > 2.0.CO;2 doi: 10.1175/1520-0442(1999)012 < 2679:ICITEM
- Tura-Gawron, K. (2017). The forecasts-based instrument rule and decision making. How closely interlinked? The case of Sweden. Equilibrium, 12(2), 295–315. doi: 10.24136/eq.v12i1.16
- Wang, J., Zhu, J., & Dou, F. (2012). Who plays the key role among Shanghai, Shenzhen and Hong Kong stock markets?. China & World Economy, 20, 102–120. doi: 10.1111/j.1749-124X.2012.12004.x
- Xu, Y., Chang, H. L., Lobonţ, O. R., & Su, C. W. (2016). Modeling heterogeneous inflation expectations: Empirical evidence from demographic data. Economic Modelling, 57, 153–163. doi: 10.1016/j.econmod.2016.04.017
- Xu, Y., Liu, Z. X., Jia, Z. C., & Su, C. W. (2017). Is time-variant information stickiness state-dependent? Portuguese Economic Journal, 16(3), 169–187. doi: 10.1007/s10258-017-0129-x
- Xu, Y., Liu, Z., Zhao, J., & Su, C. W. (2017). Weibo sentiments and stock return: A time-frequency view. PloS One, 12(7), e0180723. doi: 10.1371/journal.pone.0180723
- Xu, Y., Liu, Z., & Ortiz, J. (2018). Actual and expected inflation in the U.S.: a time-frequency view. Journal for Economic Forecasting, 21(1), 42–62. Retrieved from http://www.rjef.ro/rjef_ListViewContent.htm
- Yellen, J. (2015). Inflation dynamics and monetary policy. Speech at the Philip Gamble Memorial Lecture, University of Massachusetts, Amherst, (September 24). Retrieved from http://www.federalreserve.gov/newsevents/speech/yellen20150924a.htm
