
 ?Mathematical formulae have been encoded as MathML and are displayed in this HTML version using MathJax in order to improve their display. Uncheck the box to turn MathJax off. This feature requires Javascript. Click on a formula to zoom.
Abstract
This study examined the impact of research and development (R&D) investment behaviour on the corporate performance of the Taiwanese semiconductor industry, which faced the economic downturn caused by the global financial crisis of 2008, for the period 2005–2016. A dynamic panel data model was used to empirically analyse the impact of R&D intensity on business performance. A generalised method of moments estimator was adopted to avoid endogeneity problems caused by adding dynamics to the model. Further, the model was used to explore the impact of the lag effect of R&D investments on business performance. It was found that significant R&D investments in a given period may reduce business performance in the same period and continue to influence it in the next few periods, thus indicating the presence of a positive and lagged effect of R&D investments in the high-tech industry. Firm size was also found to be positively correlated with business performance, that is, the larger the firm size, the greater is the use of resources for R&D, which, in turn, leads to more sophisticated technologies and profitable outcomes, forming a positive cycle. This indicates that R&D expenditures affect firms’ sustainable management.
1. Introduction
In the contemporary economic age, research and development (R&D) investment is an important means of enhancing the value added to an industry’s business performance and establishing a key competitive advantage. According to the 2009 World Competitiveness Annual Report of the International Institute for Management Development, in 2007 Taiwan’s R&D expenditure was US$6977 million (ranked 16th in the world), out of which corporate R&D expenditure accounted for 1.81% of its G.D.P. (ranked 8th in the world). According to the World Semiconductor Trade Statistics of 2015, the global semiconductor industry output value reached US$336 billion in 2014, while Taiwan’s output value reached US$96.7 billion, with a growth rate of 1.5%, accounting for 18% of the global output (second only to the United States).
To establish a favourable position in intensively competitive high-technology markets, particularly in the era of knowledge-based economies, it is essential for semiconductor companies to improve their technical capacity, production efficiency and service quality. As a result, companies began placing considerable importance on R&D investments. However, the recent downturn of the global economy has led to several companies questioning the increases in R&D investments. Tubbs (Citation2007) argued that in the case of financial deterioration or economic recession, companies must increase their R&D. Although increased R&D investments may lead to a temporary state of low business performance, they can help enhance the comparative advantages of products and services through increased sales and market value.
A company’s operating conditions can affect its business performance and R&D investments through factors such as capital structure, size and external elastic factors, including the economic environment and competitors’ activities. Chiao (Citation2013) studied the influence of R&D activities on companies’ financial performance and highlighted that such activities influence not only the income rate from daily operations, but also the gross profit rate. Her findings highlighted the need for companies to focus on R&D intensity to improve future commercial value. According to Sokolov-Mladenović, Cvetanović, and Mladenović (Citation2016), R&D is used to implement labour-saving technological changes. In other words, the results of scientific research contribute towards an increase in the efficiency of existing workers. Li (Citation2012) examined the comprehensive index of business performance of Chinese manufacturing firms and found varying relationships between R&D investments and operating performance at different stages. To elaborate, past R&D investments have a positive impact on current operating performance, but current investments have a negative impact on it. Therefore, this study aims to investigate the aforementioned issues with a focus on semiconductor companies, provided they belong to high-tech industries and have numerous R&D activities and high R&D intensities. For simplicity, it focuses on the influence of R&D intensity and other internal operating factors on business performance, thus excluding external factors. The objective of this study is to explore the impact of R&D intensity on business performance, divided into two stages, one with a waiting period and the other without a waiting period. There is a waiting period for the R&D activities of firms, from the expenditure on inputs to the promotion of the transfer of new knowledge, skill learning and practical application. However, the corollary of this lag effect needs to be empirically verified. Finally, this study uses the financial data of the semiconductor industry of Taiwan for theoretical and empirical verification.
2. Literature review and research hypotheses
R&D activities play a key role in semiconductor companies. In Taiwan, higher R&D intensity has been found to be a predictor of improved firm performance in the semiconductor industry (Sher & Yang, Citation2005). However, it remains unclear whether R&D can meet companies’ positive expectations as the process involves numerous influencing factors. Using labour productivity as an indicator, Kumbhakar, Ortega-Argilés, Potters, Vivarelli, and Voigt (Citation2012) investigated the impact of R&D activities on company performance and found that higher R&D investment leads to greater production efficiency in companies of high-tech industries, but not in those of low-tech industries. Similarly, Bednarek (Citation2014) studied the productivity frontier and data envelopment analyses to demonstrate the relationship between companies’ R&D expenditure and productivity and found that companies with ex ante productivity far from the productivity frontier tend to have higher R&D investments.
There are numerous studies on the relationship between R&D investment and business performance in various countries; however, a majority of these studies present diversified results. Existing studies can be broadly summarised into works which test the correlation between R&D input and business performance and those which examine the lagged effect of R&D input on business performance.
2.1. Correlation between R&D input and business performance
Moncada-Paternò-Castello, Ciupagea, Smith, Tübke, and Tubbs (Citation2010) argued that, due to the strong dependence on R&D indicators in industrial structures, R&D intensity is a key factor in explaining companies’ technical efficiency. Anagnostopoulou and Levis (Citation2008) examined the relationships among companies’ R&D intensity, sustainable sales growth and total revenue. They found that R&D intensity has a positive correlation with subsequent risk-adjusted excess returns and it can increase the persistence of companies’ stock returns. In addition, companies with greater R&D intensity are likely to have a more stable return ratio and earn higher risk-adjusted excess returns.
R&D expenditure is said to be one of the most important predictive factors in enterprise innovation activities (Jaklič, Damijan, Rojec, & Kunčič, Citation2014). Goto and Sueyoshi (Citation2008) adopted financial performance as an indicator to examine the relationship between operating performance and R&D intensity. Their results indicated that R&D expenditures have a positive impact on the financial performance of the machinery industry and a negative impact on that of the electrical equipment industry.
2.1.1. Studies supporting the positive impact of R&D intensity
Tubbs (Citation2008) claimed that R&D intensity is a high-leverage point for business performance and companies should encourage the development of R&D units to realise higher business performance. In addition, companies must have a certain level of R&D intensity to facilitate profitable growth and develop new products and services. Jaisinghani (Citation2016) adopted a dynamic panel data (D.P.D.) model and generalised method of moments (G.M.M.) technique to analyse the dynamic relationships between R&D intensity and persistent profitability and business performance for 55 listed companies from the Indian pharmaceutical industry during 2005–2014. He found that R&D intensity and business performance are positively correlated and industrial characteristics can impact profitability. Iovino and Rizzo (Citation2008) examined the relationships among R&D intensity, commercialisation orientation, knowledge stock and organisational performance using Datastream data on the top-50 listed pharmaceutical companies and found a positive correlation between R&D intensity and company performance.
2.1.2. Studies indicating the absence of positive effects of R&D intensity
Lin, Lee, and Hung (Citation2006) study on the patents and financial information of 258 American firms revealed no apparent correlation between R&D and company performance. Vithessonthi and Racela (Citation2016) studied non-financial companies listed on the U.S. stock market for the period 1990–2013. They found that R&D investment contributes towards the building of new knowledge and capabilities in the long run, creating a greater knowledge base than that of their competitors, and thus exhibiting superior performance. However, it has a negative impact in the short run. This suggests that R&D intensity is negatively correlated with company performance, but positively correlated with corporate values. In addition, R&D investment has a negative influence on the return from the sales of companies with high R&D intensity, but no significant effect was found in companies with low R&D intensity. Chao and Kavadias (Citation2013) suggested that the appropriate balance between R&D intensity and the portfolio strategy of new product development facilitates companies’ profitability. Wang, Zhao, and Cao (Citation2011) conducted a regression analysis to empirically examine the relationship between R&D input and marketability and profitability of high-tech companies in China in 2009. They discovered that both R&D expenditure and personnel input have a significant and positive impact on a company’s marketability and they are the core components of profitability. However, when investigating the impact of R&D intensity on current profitability, they found a negative effect.
Thus, it can be concluded that R&D input does not always have a positive influence on companies’ operating performance. Moreover, there seems to be a correlation between the intensity of a company’s R&D input and the industrial sector to which it belongs. Furthermore, R&D investment is undoubtedly beneficial to a company’s technological efficacy, productivity, manufacturing process, new product development and competitiveness. We assume that, as the semiconductor industry is a knowledge, technology and capital-intensive industry, related companies must have sophisticated capacities to improve competitiveness and R&D investments to achieve higher profits. Accordingly, our first hypothesis is based on the relationship between R&D input and business performance without the lagged effect of R&D investments:
Hypothesis 1: R&D intensity has a positive correlation with current business performance.
2.2. Lagged effect of R&D input on business performance
R&D activities are one of the main engines of enterprise knowledge transfer. A firms’ focus on R&D intensity or the expected results of R&D is reflected in its financial performance, but this process may be affected by (1) internal factors like R&D funding, knowledge transfer factors, technical barriers, human capital and enterprise resource scale influence; (2) external factors such as the effects of an economic boom on R&D budget, expenditure, or firm profits; or (3) other uncertain factors which affect the results of R&D with deferred effects.
In general, a company’s R&D expenditure does not generate immediate output. In fact, there appears to be a waiting period before the effects become visible, also known as the lagged effect. A few studies on the lagged effect of R&D expenditures are listed below.
Knowledge transfer involves knowledge sources (sponsors of shared knowledge), recipients (who acquire knowledge), use of personalised strategies, two-way sharing of data streams, interaction of participants and presence of participants in both the individual departments and organisations (Tangaraja, Rasdi, Samah, & Ismail, Citation2016). The mode of knowledge transfer has five stages: acquisition, communication, application, acceptance and assimilation (Han, Yang, Bao, Yu, & Zhang, Citation2017). Knowledge transfer can increase the speed of existing technology and accelerate the learning of new tasks (Werner, Dickson, & Hyde, Citation2015). It is not just sharing of information, but also sharing of technology and techniques. The transfer of knowledge between organisations and between employees contributes to the promotion of human capital (Sokolov-Mladenović et al., Citation2016). Therefore, the firm’s R&D intensity and R&D activities can improve the level of staff knowledge and ability, the organisation of knowledge and the technical level of accumulation, or generate new knowledge, affecting business performance.
Sougiannis (Citation1994) adopted an earnings model to explore the influence of R&D expenditures on company earnings and concluded that (i) on average, an additional dollar of R&D spending can generate two dollars of additional profits in the subsequent seven years (ii) earnings can reflect the value of R&D activities and (iii) R&D expenditure is positively correlated with a company’s market value (share price). Lin (Citation2006) found that R&D spending affects the overall economy of Taiwan and there is a causal relationship between R&D and economic contribution, including employment, investment and consumer expenditure. In addition, she found that, regardless of governmental or non-governmental units, there is a lagged effect of R&D expenditure in the long run and a four-year lagged effect of R&D expenditure in government units in terms of overall improvement in employment and investment. Krishnan, Tadepalli, and Park (Citation2009) examined companies from various industries and revealed that, in addition to positively influencing business performance, R&D marketing interactions can also influence lagged organisational performance. Zhaohui and Xiaokang’s (Citation2011) study on listed medical and biochemical manufacturers in China indicated that R&D intensity is correlated with manufacturers’ lagged performance. There is a weak, but significant correlation between R&D intensity and business performance in the same year as well as a strong and significant correlation between R&D intensity and business performance in the following year. Wang et al. (Citation2011) examined high-tech industries in China and reached a similar conclusion: R&D input has a lagged effect on company’s R&D performance (business performance). Yeh, Chen, and Chen (Citation2007) demonstrated a distributed lag effect of R&D expenses in Taiwan’s biotechnology industry and found a positive correlation between R&D input and business performance and a negative correlation between R&D input and capital structure. Hundley, Jacobson, and Park (Citation1996) found a two-year lagged effect of R&D intensity on fluctuating profitability and liquidity in American manufacturing companies; however, this correlation is mostly applicable to research-intensive firms. Amir, Guan, and Livne (Citation2007) claimed that R&D expenses favour subsequent changes in earnings and the effect is particularly apparent among R&D-intensive industries.
The aforementioned indicates that, regardless of companies being public or private, the impact of R&D intensity on organisational performance is likely to differ. However, the question surrounding the length of this lagged effect is yet to be answered. Thus, we assume that there is a waiting period before R&D investment and the expected effect, irrespective of monetary or human resource investment or the support and promotion through government policies. This is particularly the case for the semiconductor firms, which are part of a high-tech industry. In addition, we hypothesise that R&D intensity has a lagged effect on business performance.
Hypothesis 2: There are lagged, positive effects of R&D intensity on business performance.
3. Research design and empirical analysis
3.1. Research design
3.1.1. Data sources
Data are taken from the Taiwan Economic Journal database. We collected and compiled financial reports of listed firms from the Taiwanese semiconductor industry for the period 2005–2016. To improve the accuracy of the analysis, firms which merged with others, were delisted or scheduled to be delisted from the stock market, not listed during the six-year study period, lacked complete data, or ceased to exist were excluded from the study. Accordingly, data on 96 firms were collected.
3.1.2. Methodology
We performed an empirical analysis using panel data. First, we conducted the L.L.C. (Levin, Lin, & James Chu, Citation2002), I.P.S. (Im, Pesaran, & Shin, Citation2003) and A.D.F.-Fisher (Maddala & Wu, Citation1999) panel unit root tests to verify the stationarity of the variables. In the following, we discuss the panel data model of D.P.D. and G.M.M. The D.P.D. model involves the introduction of the lagged values of the response variables to the panel data, which implies adding dynamics to the model. When conducting an ordinary least squares regression to estimate the D.P.D. model (Arellano & Bover, Citation1995; Blundell & Bond, Citation1998), the first-step differential G.M.M. method is vulnerable to the weak instrumental variables, thus providing biased estimates. To overcome the impact of weak instrumental variables, the system G.M.M. estimation method, which is a more efficient method, is proposed. It involves combining the horizontal regression equation with the differential regression equation for estimation. In this method, while the first-step difference is used as the instrumental variable of the horizontal variable. System G.M.M. is an extension of differential G.M.M., which includes lagged differential terms as well as hysteresis level terms. Accordingly, we decided to use two-step system G.M.M., to effectively avoid endogeneity problems and derive a better understanding of the dynamic changes in the model. Finally, to rule out setting errors and examine the autocorrelation of residuals and the validity of the instrumental variables, we perform statistical tests on the system G.M.M. estimates. Sargan's J-test (Sargan, Citation1958) was performed to check the validity of the tool variables and determine whether the statistical model has been over-identified. When p > 0.1 in the J test, it implies that the model does not suffer from a problem of over-identification and thus, it can be explained. We used the white period to measure the consistency of the coefficient covariance.
3.1.3. Model variables
Business performance can be affected by numerous factors such as fluctuations in the economic environment, firm size, debt, competitors and market share. This study includes return on assets (R.O.A.), R&D intensity (R.D.I.), firm size (SIZE), debt ratio (LEV) and total assets growth (T.A.G.) as the model’s variables.
3.1.3.1. Response variables
According to financial analysis standards, a company’s performance should be evaluated on the basis of its profitability and business performance. As regards business performance and profitability evaluation, we use the R.O.A. measurement indicator, which is earnings before interest, taxes, depreciation and amortisation. R.O.A. is often used to measure business performance, innovation performance and business profitability (Choi, Citation2008; Gentry & Shen, Citation2013; Vithessonthi & Racela, Citation2016).
3.1.3.2. Explanatory variables
Following are the definitions of the explanatory variables included in this study
R.D.I. refers to the amount of R&D investment. R.D.I. is a commonly used indicator to measure the level of importance companies attach to R&D. Owing to the variance in the scale of assets and resource accessibility, the affordable amount of R&D investment tends to differ by company. Thus, in this study, R.D.I. is defined as the ratio of R&D expenditures to the total sales in the same year and RDIt-k is the lagged effect of R.D.I.
LEV is an important indicator of a company’s capital structure. A significantly high debt ratio indicates the potential risks of a company’s capital structure. In addition, a company can improve its asset utilisation efficiency by adopting higher financial leverage to operate in high-tech industries, such as semiconductor and biotechnology industries. Chiou, Wang, Wei, and Chien (Citation2011) use debt ratio as a measure of business efficiency of Taiwanese semiconductor industry.
SIZE is generally measured on the basis of total assets and sales. This study adopted companies’ sales income in a given year. Using returns to scale as the conceptual foundation, Ciftci and Cready (Citation2011) found that earnings performance and variations in R&D investment were affected by firm size. We use the natural logarithm of this variable in our model.
T.A.G. reflects the growing trend of a company. It can be estimated as follows: (total assets of current time range − total assets of previous time range)/total assets of previous time range.
3.1.4. D.P.D. model
According to the principle of the D.P.D., a simple regression equation is as follows:
In a pure time-series dynamic model, is a stochastic regressor. Although an estimator established on the basis of
is not unbiased, when
it remains consistent, which marginally differs from the exogenous stochastic regressor
However, when the dependent variable is a function of individual effect
the lagged dependent variable
is also a function of
even without the serial correlation of residuals, which continues to exit. In standard panel data,
is generally not large and the asymptotic properties of the estimator is established as per
rather than
Given the above theoretical analysis, we define the equations for estimation of the models as follows:
(1)
(1)
(2)
(2)
We assume that the factors influencing business performance (R.O.A.) are R.D.I., SIZE, LEV and T.A.G.. In EquationEquation (1)(1)
(1) , subscripts i and t denote the company and the current year and in EquationEquation (2)
(2)
(2) , subscripts i and t − k represent the company and the lag year. RDIi,t-k is the R.D.I. of the (t − k)th year. Given the possibility of a two-way causal relationship and inter-influence between the explanatory and response variables, there are various factors which can influence business performance and neglecting some of them can lead to inaccurate estimation results. Thus, we applied the G.M.M. method proposed by Arellano and Bond (Citation1991), Arellano and Bover (Citation1995) and Blundell and Bond (Citation1998) and rewrote EquationEquations (1)
(1)
(1) and Equation(2)
(2)
(2) as
(3)
(3)
(4)
(4)
where is a constant,
is a time fixed-effects item, k is the lag period and
is a random error term. G.M.M. was individually applied to estimates using EquationEquations (3)
(3)
(3) and Equation(4)
(4)
(4) . The G.M.M. estimation method uses differentiation to convert data, which can avoid discrepancies caused by unobservable or missing variables and the correlation between explanatory variables. When the selection of instrumental variables is appropriate, using the G.M.M. method to track D.P.D. models can effectively control the endogeneity problems of explanatory variables.
3.2. Empirical analysis
and and demonstrate a marginal increase in the amount of R&D investment in the 96 listed semiconductor companies during the period 2005–2016. The maximum and minimum values and standard deviation also reveal a growing gap in R&D investment among the sample companies. A data survey of the 2008 financial tsunami found that, although R&D spending led short-term manufacturers’ to reduce their R&D investment funds in 2009, it continued to increase and the trend has not changed since. This is indicated by the standard deviations in , which prove that the difference in the amount of investment has a growing tendency. In , we averaged the overall R&D expenditures and divided them into two groups, high and low R&D expenditures, to compare their respective impact on business performance in the same space-time background.
Figure 1. R&D investment of semiconductor companies in Taiwan, 2005–2016.
Note: We take the natural logarithm of corporate R&D expenditures because the data is too large. Source: Taiwan’s new economic (TEJ) database.
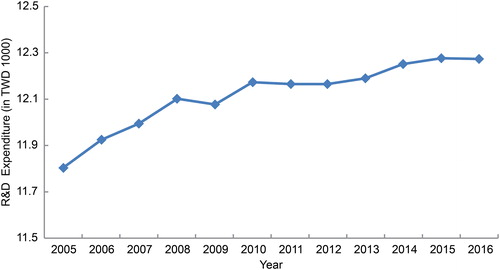
Figure 2. R.O.A. of R&D investment of semiconductor companies in Taiwan, 2005–2016. Source: Taiwan’s new economic (TEJ) database.
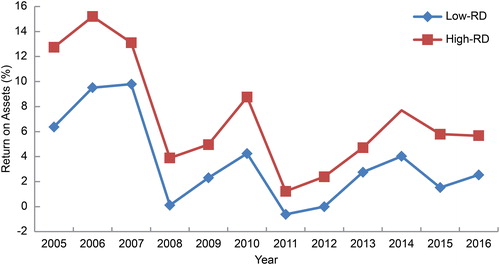
Table 1. R&D expenses of 96 companies, 2005–2016.
According to , which reports the Pearson correlation coefficients, firms’ financial performance is inversely proportional to R&D intensity and debt ratio and directly proportional to firm size and total asset growth rate.
Table 2. Pearson correlation.
presents the unit root test results of each variable for the L.L.C., A.D.F. and P.P. tests. We found that the p-values of all the variables are less than 0.1, indicating statistical stationarity.
Table 3. Unit-root test results.
As regards the deferred effect, RDIi,t-k, where k is the lag periods (in years), the value of k was estimated using the individual root-Fisher A.D.F. test. The longest period for a deferred effect is two years (k = 2), as a deferred effect up to the third year (k = 3) is not significant (p = 0.1322). See .
Table 4. Individual root-Fisher A.D.F. test.
We will verify for (1) R&D intensity without deferred effect and (2) R&D intensity with deferred effect (k = 1), (k = 2), the impact of intensity of corporate R&D funding on business performance based on the above assumptions and tests. The p-values of Sargan’s J test for models (1) and (2-2) are 0.1896 (>0.1), 0.1977 (>0.1) and 0.2396 (>0.1), respectively (), thus indicating that the models do not have over-identification issues.
Table 5. Impact of R.D.I. on R.O.A.
The results of model (1) indicate that R.O.A. in the previous year is positively correlated with that in the current year (coefficient = 0.0175, t = 2.8101 and p < 0.01) and R.D.I. and R.O.A. in the current year are negatively correlated (coefficient = −0.0283, t = −5.3618 and p < 0.01), LEV and R.O.A. are negatively correlated (coefficient = −0.2767, t = −35.0977 and p < 0.01). SIZE and R.O.A. are positively correlated (coefficient = 0.0482, t = 13.7481 and p < 0.01) and T.A.G. and R.O.A. are positively correlated (coefficient = 0.2392, t = 37.2964 and p < 0.01). Further, R&D spending is negatively correlated with financial performance of the year because firms consider R&D as a cost concept and the higher the cost expenditure, the greater is the decrease in profits.
According to the results of model (2-1), RDIi,t-k, k = 1, R.O.A. in the previous and current years are positively correlated (coefficient = 0.0182, t = 3.1280 and p < 0.01). The lagged R.D.I. is positively correlated with R.O.A. (coefficient = 0.0148, t = 3.8787 and p < 0.01). LEV is negatively correlated with R.O.A. (coefficient = −0.2787, t = −34.8797 and p < 0.01), SIZE and R.O.A. are positively correlated (coefficient = 0.0525, t = 13.2824 and p < 0.01) and T.A.G. and R.O.A. are positively correlated (coefficient = 0.2406, t = 39.1710 and p < 0.01). This model indicates that R&D spending has a positive impact on the financial performance of enterprises, within at least a one-year waiting period, which, in turn, proves the presence of a lag effect of R.D.I.
According to the results of model (2-2), RDIi,t-k, k = 2, R.O.A. in the previous and R.O.A. in the current year are positively correlated (coefficient = 0.0239, t = 3.5072 and p < 0.01). Lagged R.D.I. is positively correlated with R.O.A. (coefficient = 0.0727, t = 15.2845 and p < 0.01)LEV and R.O.A. are negatively correlated (coefficient = −0.2822, t = −34.7276 and p < 0.01), SIZE and R.O.A. are positively correlated (coefficient = 0.0539, t = 14.7429 and p < 0.01) and T.A.G. and R.O.A. are positively correlated (coefficient = 0.2388, t = 37.1670 and p < 0.01).
However, compared to models (2-1) and (2-2), the effect of firms’ R.D.I. and asset size on business performance respectively increase (0.0727–0.0148, p = 0.0579) and (0.0539–0.0525, p = 0.0014).
4. Conclusions
Drawing from studies which have examined the correlation between R&D input and firm performance, we conducted an empirical analysis using observed data on 96 listed semiconductor companies in Taiwan for the period 2005–2016. In particular, this study aimed to explore the impact of R&D intensity on business performance. The conclusions are as follows:
indicates that the financial turmoil of 2008 led to a decrease in R&D spending in Taiwan's high-tech industry in 2009, while the R&D expenditure was slowly upward in the long term. This R&D behaviour is consistent with Tubbs (Citation2007). Manufacturers should focus on enterprise R&D, increasing business competitiveness and improving business performance. In particular, they should focus on business R&D during economic downturns, while waiting for the economy to improve. Manufacturers can use R&D investment in equipment, training and incentives related to knowledge transfer at the organisational level, to improve skills and productivity and thereby promote business performance. However, they require a waiting period to deliver results, as verified by this model.
R&D intensity of the current year is negatively correlated with companies’ current business performance. This can be attributed to the fact that R&D expenses are recorded as operating expenses in the financial statement, thus increasing the operating expenses in a given year, leading to the documentation of lower operating performance. This finding is consistent with that of Wang et al. (Citation2011). In addition, the present study demonstrated that R&D investment in high-tech industries has a lagged effect, which is in line with Li’s (Citation2012) findings: R&D input has a positive impact on business performance.
There was a marginal increase in R&D investment among the sample semiconductor companies during the period 2005–2016. Although the input in R&D may have a negative effect on the year in which the investment is made, in the long run, the new products, processes and technologies resulting from the R&D are likely to improve technical efficiency and reduce production costs. In the semiconductor industry, the lagged effect of R&D investment was found to have a positive impact on business performance. These findings are in line with those of Yang, Chiao, and Kuo (Citation2010), who adopted a three-stage S-curve model and found that the relationship between R&D intensity and profitability formed a downward slope (low level) in the first stage and an upward slope (medium level) in the second stage. Thus, R&D input improves existing operating processes by shortening the manufacturing time, thus increasing their efficiency, improving product quality and reducing costs. In addition, it contributes to the development of new products and promotes patent rights in relevant industries, such that negative patent-related operational impacts are avoided. Debt ratio is inversely correlated with business performance, that is, a higher debt ratio results in poorer business performance, while a lower debt ratio leads to better business performance. According to Chiou, Wang, Wei, and Chien (Citation2011), capital structure has a similar effect in technology companies due to their high-leverage nature.
Firm size is positively correlated with business performance. In terms of resources, larger companies tend to have greater access to resources, and thus can invest more resources in R&D to enhance technology and productivity and generate higher profits. These findings are in line with those of Ciftci and Cready (Citation2011).
5. Limitations
We examined the influence of R&D input on business performance from a financial perspective, but did not consider the possible impact of existing patents on business performance.
We focused on companies in the semiconductor industry, but did not divide the companies on the basis of their positions in the supply chain. Finally, we focused on the impact of R&D on the development of deferred effects. However, in this paper, the discussion on the external factors (economic environment) of the impact is limited. Hence, it is recommended that future research can include it in the model.
Disclosure statement
The authors have no conflicts of interest to declare.
References
- Amir, E., Guan, Y., & Livne, G. (2007). The association of R&D and capital expenditures with subsequent earnings variability. Journal of Business Finance and Accounting, 34(1-2), 222–246.
- Anagnostopoulou, S. C., & Levis, M. (2008). R&D and performance persistence: Evidence from the United Kingdom. The International Journal of Accounting, 43(3), 293–320. doi: 10.1016/j.intacc.2008.06.004
- Arellano, M., & Bond, S. (1991). Some tests of specification for panel data: Monte Carlo evidence and an application to employment equations. The Review of Economic Studies, 58(2), 277–297. doi: 10.2307/2297968
- Arellano, M., & Bover, O. (1995). Another look at the instrumental variable estimation of error-components models. Journal of Econometrics, 68(1), 29–51. doi: 10.1016/0304-4076(94)01642-D
- Bednarek, Z. (2014). Predicting R&D investment with ex ante productivity. Applied Economics Letters, 21(15), 1079–1082. doi: 10.1080/13504851.2014.909567
- Blundell, R., & Bond, S. (1998). Initial conditions and moment restrictions in dynamic panel data models. Journal of Econometrics, 87(1), 115–143. doi: 10.1016/S0304-4076(98)00009-8
- Chao, R. O., & Kavadias, S. (2013). R&D intensity and the new product development portfolio. IEEE Transactions on Engineering Management, 60(4), 664–675.
- Chiao, T. C. (2013). The correlation between R&D activities and income rate in addition to gross profit rate of the enterprise operation. Advanced Materials Research, 798, 865–868.
- Chiou, C. C., Wang, Y. M., Wei, C. L., & Chien, T. C. (2011). The effects of innovation and human capital investments on the operating efficiencies of Taiwan’s IC design industry. Sun Yat-Sen Management Review, 19, 343–385.
- Choi, J. H. (2008). An empirical study on the relationship between earnings quality and firm value. Asia-Pacific Journal of Financial Studies, 37(5), 813–839. doi: 10.1111/j.2041-6156.2011.01060.x
- Ciftci, M., & Cready, W. M. (2011). Scale effects of R&D as reflected in earnings and returns. Journal of Accounting and Economics, 52(1), 62–80.
- Goto, M., & Sueyoshi, T. (2008). R&D intensity and financial performance. Paper presented at the 2008 IEEE International Engineering Management Conference, Estoril, Portugal.
- Gentry, R. J., & Shen, W. (2013). The impacts of performance relative to analyst forecasts and analyst coverage on firm R&D intensity. Strategic Management Journal, 34(1), 121–130. doi: 10.1002/smj.1997
- Han, C. J., Yang, B., Bao, T., Yu, T., & Zhang, X. S. (2017). Bacteria foraging reinforcement learning for Risk-based economic dispatch via knowledge transfer. Energies, 10(5): 638. doi: 10.3390/en10050
- Hundley, G., Jacobson, C. K., & Park, S. H. (1996). Effects of profitability and liquidity on R&D intensity: Japanese and U.S. companies compared. Academy of Management Journal, 39(6), 1659–1674. doi: 10.2307/257073
- Im, K. S., Pesaran, M. H., & Shin, Y. (2003). Testing for unit roots in heterogeneous panels. Journal of Econometrics, 115(1), 53–74. doi: 10.1016/S0304-4076(03)00092-7
- Iovino, A. M., & Rizzo, M. G. (2008). Performance, R&D intensity, knowledge stock and commercialization orientation in the pharmaceutical sector. Mecosan, 17(66), 67–74.
- Jaisinghani, D. (2016). Impact of R&D on profitability in the pharma sector: An empirical study from India. Journal of Asia Business Studies, 10(2), 194–210.
- Jaklič, A., Damijan, J. P., Rojec, M., & Kunčič, A. (2014). Relevance of innovation cooperation for firms’ innovation activity: The case of Slovenia. Economic Research-Ekonomska Istraživanja, 27(1), 645–661. doi: 10.1080/1331677X.2014.975513
- Krishnan, H. A., Tadepalli, R., & Park, D. (2009). R&D intensity, marketing intensity, and organizational performance. Journal of Managerial Issues, 21(2), 232–244.
- Kumbhakar, S. C., Ortega-Argilés, R., Potters, L., Vivarelli, M., & Voigt, P. (2012). Corporate R&D and firm efficiency: Evidence from Europe’s top R&D investors. Journal of Productivity Analysis, 37(2), 125–140.
- Levin, A., Lin, C.-F., & James Chu, C.-S. (2002). Unit root tests in panel data: Asymptotic and finite-sample properties. Journal of Econometrics, 108(1), 1–24. doi: 10.1016/S0304-4076(01)00098-7
- Li, X. (2012). June). R&D Intensity and firm performance: Evidence from Chinese manufacturing firms. Paper presented at the, 2012 IEEE International Conference on Management of Innovation & Technology, Bali, Indonesia.
- Lin, L. (2006). The influences of R&D expenditures on knowledge-based economy in Taiwan. In B. Gabrys, R. J. Howlett, & L. C. Jain, (Eds.), 10th International Conference on Knowledge-Based Intelligent Information and Engineering Systems (pp. 930–937). Bournemouth: Springer Verlag.
- Lin, B.-W., Lee, Y., & Hung, S. C. (2006). R&D intensity and commercialization orientation effects on financial performance. Journal of Business Research, 59(6), 679–685. doi: 10.1016/j.jbusres.2006.01.002
- Maddala, G. S., & Wu, S. (1999). A comparative study of unit root tests with panel data and a new simple test. Oxford Bulletin of Economics and Statistics, 61(s1), 631–652. doi: 10.1111/1468-0084.0610s1631
- Moncada-Paternò-Castello, P., Ciupagea, C., Smith, K., Tübke, A., & Tubbs, M. (2010). Does Europe perform too little corporate R&D? A comparison of EU and non-EU corporate R&D performance. Research Policy, 39, 523–536.
- Sargan, J. D. (1958). The estimation of economic relationships using instrumental variables. Econometrica, 26(3), 393–415. doi: 10.2307/1907619
- Sher, P. J., & Yang, P. Y. (2005). The effects of innovative capabilities and R&D clustering on firm performance: The evidence of Taiwan’s semiconductor industry. Technovation, 25(1), 33–43. doi: 10.1016/S0166-4972(03)00068-3
- Sokolov-Mladenović, S., Cvetanović, S., & Mladenović, I. (2016). R&D expenditure and economic growth: EU28 evidence for the period 2002–2012. Ekonomska Istraživanja, 29(1), 1005–1020. doi: 10.1080/1331677X.2016.1211948
- Sougiannis, T. (1994). The accounting based valuation of corporate R&D. Accounting Review, 69(1), 44–68.
- Tangaraja, G., Rasdi, R. M., Samah, B. A., & Ismail, M. (2016). Knowledge sharing is knowledge transfer: A misconception in the literature. Journal of Knowledge Management, 20(4), 653–670. doi: 10.1108/JKM-11-2015-0427
- Tubbs, M. (2007). The relationship between R&D and company performance. Research Technology Management, 50(6), 23–30.
- Tubbs, M. (2008). Where are all the high-leverage innovators? Research Technology Management, 51(4), 3–5.
- Vithessonthi, C., & Racela, O. C. (2016). Short- and long-run effects of internationalization and R&D intensity on firm performance. Journal of Multinational Financial Management, 34, 28–45.
- Wang, H., Zhao, Y., & Cao, J. (2011). An empirical study on the relationship between R& D input and profitability of high-tech enterprises in China. Paper presented at the Computer Science and Service System (CSSS), 2011 International Conference, Nanjing, China. doi: 10.1109/CSSS.2011.5974702
- Werner, K., Dickson, G., & Hyde, K. F. (2015). Learning and knowledge transfer processes in a mega-events context: The case of the 2011 Rugby World Cup. Tourism Management, 48, 174–187. doi: 10.1016/j.tourman.2014.11.003
- Yang, K. P., Chiao, Y. C., & Kuo, C. C. (2010). The relationship between R&D investment and firm profitability under a three-stage Sigmoid curve model: Evidence from an emerging economy. IEEE Transactions on Engineering Management, 57(1), 103–117. doi: 10.1109/TEM.2009.2023452
- Yeh, T. L., Chen, T. Y., & Chen, C. Y. (2007). On capital structure, ownership and cost efficiency: A case study from Taiwan's biotechnology industry. Taiwan Banking & Finance Quarterly, 8(3), 45–64.
- Zhaohui, Z., & Xiaokang, C. (2011). Notice of Retraction Does R&D investment promote firms’ performance? Evidence from the pharmaceutical and biological products listed firms. Paper presented at the 2011 6th International Conference on Product Innovation Management (ICPIM 2011), Hubei, China.