
 ?Mathematical formulae have been encoded as MathML and are displayed in this HTML version using MathJax in order to improve their display. Uncheck the box to turn MathJax off. This feature requires Javascript. Click on a formula to zoom.
Abstract
The performance of the stock market is usually regarded as the barometer of economic growth and stock return and economic growth are, therefore, believed to co-move. However, the co-movement may exhibit different characteristics in various economic systems. This paper studies the co-movement of stock return and economic growth in two representative countries, the U.S. and China, with entirely different economic systems. The degree of co-movement is measured by the correlation of stock index return and G.D.P. growth rate and a time-varying copula model is applied to capture the dynamic characteristics of the co-movement. Empirical results show that the co-movement of stock return and economic growth is relatively strong but fluctuant in the U.S. and is relatively weak but stable in China. The differences in the co-movement can be interpreted by different economic growth modes in the U.S. and China.
1. Introduction
Generally speaking, the performance of equity investments is inextricably linked to economic growth because the source of value for equity investments is driven by economic activity (Cornell, Citation2010). Therefore, the performance of stock market is usually regarded as the barometer of economic growth and the stock return and the economic growth are believed to co-move to some extent. The co-movement of stock return and economic growth can play an important role in macroeconomic policy-making and individual investment decision-making. From the perspective of macroeconomics, the government can consider the trend of stock market as the predictor of economic growth and adjust macroeconomic policies in advance according to the co-movement of stock return and economic growth. From the perspective of individual investments, investors can consider the trend of economic growth as the indicator of investment decisions and adjust investment strategies timely according to the changes in economic situations. It is therefore worthy and meaningful to study characteristics of the co-movement of stock return and economic growth in a country.
In this paper, we empirically study the co-movement of stock return and economic growth in the U.S. and China and then compare and interpret the characteristics of the co-movement of these two countries. As the world’s two largest economies, the U.S. and China have entirely different economy systems. The U.S. has a mature free-market economy system and its economic growth is basically driven by the operating performance of small and medium enterprises. In contrast, China has a socialist market economic system and its economic growth is significantly influenced by government’s control (Chow, Citation1997). The study of these two countries can make a thorough and deep understanding of the co-movement of stock return and economic growth and provide references for macroeconomic policy-making and stock investments under different economic systems.
We use the correlation of stock index returns and G.D.P. growth rates to indicate the degree of the co-movement of stock return and economic growth. However, it is noted that the co-movement could be influenced by internal and external factors such as policy changes and financial crisis and, thus, has dynamic characteristics. Regarding this, we apply a time-varying copula model to capture the dynamic correlation of stock index returns and G.D.P. growth rates. The contributions of this paper are 2-fold. First, we capture and compare the dynamic characteristics of the co-movement of stock return and economic growth in the U.S. and China. Second, we interpret the differences in the co-movement according to the various economic growth modes of these two countries.
The remainder of this paper is organised as follow. Section 2 gives a literature review. Section 3 provides details of the data and the time-varying copula model. Section 4 applies the model to the U.S. and China. Section 5 concludes.
2. Literature review
Many empirical studies have indicated a positive relationship between stock return and economic growth. Early studies of Fama (Citation1981, Citation1990) find that there exists a positive relation between real stock returns and economic growth in the short-term during the periods of post-1953 and 1953–1987. Cheung and Ng (Citation1998) find empirical evidence of long run co-movements between five national stock market indexes and macroeconomic variables. Aylward and Glen (Citation2000) investigate the correlation of stock price and economic growth in 23 countries and find that a 10% rise in stock prices is followed by an increase of 0.5–1.0% in G.D.P.. Using the data of G7 countries, Hassapis and Kalyvitis (Citation2002) apply a VAR model to show that stock price and output growth are strongly positively correlated. Mauro (Citation2003) shows that there is a significantly positive correlation between output growth and stock returns in several advanced and developing countries. Using the data from 36 developed or emerging markets, Cole, Moshirian, and Wu (Citation2008) find a positive and significant relationship between bank stock returns and G.D.P. growth. Nitschka (Citation2014) find that developed markets usually show a stronger relationship between business cycles and stock returns than emerging markets do. Abid, Bahloul, and Mroua (Citation2016) find that the relationship between economic growth and stock returns is generally positive but shows different characteristics in Middle East and North Africa countries. Giannellis and Papadopoulos (Citation2016) show the spillover effects between economic activity and stock market in China. Heiberger (Citation2018) finds that networks derived from stock returns can be used to predict economic growth in the U.S. On the other hand, Dong and Yoon (Citation2018) show that economic growth has the highest forecasting power for stock returns in emerging Asian stock markets. It is because of their co-movement that stock return can be used to predict economic growth and vice versa. On the other hand, some studies come to the opposite conclusion. Ritter (Citation2005) finds that the correlation of real stock returns and G.D.P. per capita growth is negative over 1900–2002 in 16 countries. Using the data of 20 countries, Madsen, Dzhumashev, and Yao (Citation2013) find that the relation of stock return and economic growth is positive over 1916–1951 and no relation existed outside the period. Pan and Mishra (Citation2018) find that the relationship between stock market and real sector of the economy is negative but miniscule in China.
Most existing literature indicates that there is a positive relationship between stock return and economic growth and the relationship exhibits different characteristics between various countries and during various periods. This paper investigates the co-movement of stock return and economic growth focusing on the comparisons of various countries and periods. Regarding to country differences, we selected the U.S. and China as representative of developed and developing countries, respectively. Regarding periodic differences, we apply a time-varying copula model to capture the dynamic correlation of stock return and economic growth.
3. Methodology and data
3.1. Time-varying copula model
Copula models describe dependencies between variables through constructing joint distribution from marginal distributions and have significant advantages in analysing the correlation between variables. First, it estimates marginal distributions and joint distribution separately without loss of important information. Second, the two-step estimation procedure increases the practicality and reduces the complexity in empirical studies. Third, it allows for time-varying dynamic correlation between variables that is more comprehensive than the simple constant correlation. The dynamic correlation derived from copula models is an informative and flexible measure of dependencies between two variables (Hu, Citation2010). Time-varying copula models have been becoming increasingly popular in economic and financial researches (e.g., Patton, Citation2004; Citation2006a; Silva Filho, Ziegelmann, & Dueker, Citation2013). Manner and Reznikova (Citation2012) provides a survey on time-varying copula models.
Let be the cumulative distribution function (C.D.F.) of a random variable
,
be the C.D.F. of random variable
and
be the joint C.D.F. of
and
. Sklar’s Theorem states that there must exist a copula function
on
, such that
(1)
(1)
Differentiating both sides of EquationEquation (1)(1)
(1) with respect to
and
gives
(2)
(2)
where
is the joint probability density function (P.D.F.) of
and
,
is the P.D.F. of
,
is the P.D.F. of
and
is the copula density function of
and
.
Sklar’s Theorem uses a copula function to construct the joint C.D.F. of two variables by linking the corresponding marginal distributions. The correlation of the two variables can be derived from the copula function, which implies that the copula function plays an important role in our study and the selection of copula function needs specific considerations. Patton (Citation2006b) considers the normal copula function to be the benchmark in economic research and, therefore, we adopt the normal copula function to estimate the correlation of stock index return and G.D.P. growth rate. The normal copula function is
(3)
(3)
and its density function is
(4)
(4)
where
is the bivariate standard normal C.D.F. with correlation
and
is the inverse of the standard normal C.D.F. The parameter
in EquationEquations (3)
(3)
(3) or (4) indicates the constant correlation of
and
.
In order to capture the dynamic correlation, a time-varying correlation parameter is introduced to EquationEquation (4)(4)
(4) and it can be described similar to an A.R.M.A.(1, q)1 process, as below (see Patton, Citation2006b for details)
(5)
(5)
where
is the modified logistic function to keep
,
are parameters to be estimated,
and
are values of the C.D.F. of
and
at observations
and
, respectively.
The estimation of parameters in EquationEquation (5)(5)
(5) follows a two-stage procedure. The first stage is to estimate the values of the marginal C.D.F.s of
and
at observations
and
, respectively. Let
and
be the parameters of
and
, respectively. Based on the sample
of
and
, one can obtain the maximum likelihood estimator (M.L.E.) of
and
, denoted by
and
, and then the values of marginal C.D.F. at
and
can be calculated as
and
, respectively. The second stage is to obtain the M.L.E. of
, denoted by
by maximizing
. Finally, the dynamic correlation can be obtained by
(6)
(6)
3.2. Data
The relatively short history of China’s stock market that was founded at the end of 1991 determines the sampling period of data as 1992q1–2017q4. We choose Shanghai Stock Exchange A-Share (S.H.A.S.H.R.) index to be the indicator of the China stock market. The S.H.A.S.H.R. index is the market-value weighted index of all A-share stocks (stocks issued by Chinese companies)2 listed on the Shanghai Stock Exchange. Because most state-owned companies and large-cap companies are listed on the Shanghai Stock Exchange, the S.H.A.S.H.R. is usually considered to be more closely related to China’s economic growth than other indices and is widely used by many empirical studies (e.g., Giannellis & Papadopoulos, Citation2016; Hu, Citation2010; Pan & Mishra, Citation2018). The data of quarterly closing prices of the S.H.A.S.H.R. index was obtained from the database of the Shanghai Stock Exchange.3 The data of quarterly China real G.D.P. was obtained from the database of the National Bureau of Statistics of China.4
We chose the S&P 500 index to be representative of the US stock market index. The S&P 500 index is the market-value weighted index of 500 large companies and is generally considered to be the best representative of the US stock market. The data of quarterly closing prices of S&P 500 index is obtained from Wharton Research Data Services.5 The data of quarterly US real G.D.P. is obtained from the website of the U.S. Bureau of Economic Analysis.6
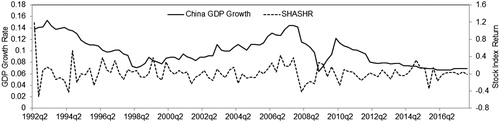
Quarterly stock index returns and G.D.P. growth rates are then calculated based on closing prices and real G.D.P.s, respectively, and the final sample has a sampling period of 1992q2–2017q4 with 103 observations. shows the sample paths of quarterly S&P 500 returns and U.S. G.D.P. growth rates and shows the sample paths of quarterly S.H.A.S.H.R. returns and China G.D.P. growth rates. Observing the trends of sample paths in both figures, we can find obvious co-movement of stock return and G.D.P. growth in certain periods. Details of the characteristics of the co-movement need further study.
Figure 1. Sample path of S&P 500 returns and U.S. G.D.P. growth rates. Source: Wharton Research Data Services and the U.S. Bureau of Economic Analysis.
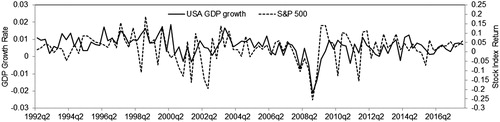
Figure 2. Sample path of S.H.A.S.H.R. returns and China G.D.P. growth rates. Source: Shanghai Stock Exchange and the National Bureau of Statistics of China.
reports the descriptive statistics of stock index returns and G.D.P. growth rates for both countries. The average stock index return is greater than the average G.D.P. growth in the U.S.; however, this relationship is opposite in China. Furthermore, the average stock index return is almost the same in the U.S. and China, although the average G.D.P. growth in China is much greater than that in the U.S. The standard deviation (S.D.) of each series is greater than the corresponding mean, except for the series of China G.D.P. growth. China G.D.P. growth has the highest mean, but the lowest S.D., indicating the rapid and stable economic growth in China during the last two decades. The S.D. of S.H.A.S.H.R. returns is more than 10-times the mean, which shows the high volatility of the China stock market. The results of skewness indicate that the data of the U.S. G.D.P. growth and stock index return are skewed to the left and those of China are skewed to the right. The results of kurtosis indicate that all series are leptokurtic except for the China G.D.P. growth. It is noted that the data of S.H.A.S.H.R. returns has a large kurtosis, indicating the relatively high possibility of extreme rising and falling of China’s stock market.
Table 1. Descriptive statistics of stock index returns and G.D.P. growth rates.
4. Empirical study
4.1. Estimating results
First, we need to estimate marginal distributions of stock index returns and G.D.P. growth rates. Without loss of information, we use the full sample to estimate the marginal distribution of each variable. We apply the benchmark A.R. model to fit the G.D.P. growth rates (e.g., Greene, Citation2018; Hamilton, Citation1994) and the benchmark G.A.R.C.H. model to stock index returns (e.g., Hu, Citation2010; Patton, Citation2006a). Diagnostic tests of residuals show high value of kurtosis for all series. Therefore, t distribution is used to model the error distribution in A.R. and G.A.R.C.H. models. If the model for marginal distribution is appropriately specified, series and
should be independently and identically distributed (i.i.d) as uniform(0,1) distribution. We apply Ljung–Box (L–B) test to test the hypothesis of independence and the Kolmogorov–Smirnov (K–S) test to test the hypothesis of uniform(0,1) distribution. Parameter estimations and p-values of the L–B and K–S test statistics are reported in . Results show that the null hypothesis of i.i.d. uniform(0,1) cannot be rejected at 10% significance level, which indicates that marginal distributions for G.D.P. growth rates and stock index returns are correctly specified.
Table 2. Estimating results for the marginal distributions.
Next, we estimate parameters of constant and time varying normal copula functions. reports the estimating results for copula functions and shows the dynamic correlations of stock index returns and G.D.P. growth rates in the U.S. and China.
Figure 3. Dynamic correlations of stock return and economic growth. Source: Author’s estimations.
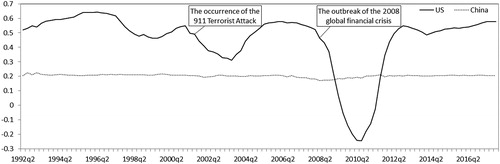
Table 3. Estimating results for copula functions.
shows that the constant correlation is positive in both the U.S. and China; however, the correlation of the U.S. is greater than that of China. shows that the dynamic correlation of China is always positive and is relatively stable around the level of 0.2. The dynamic correlation of the U.S. is positive most of the time, except for the period of 2009–2010, but is more fluctuant than that of China.
4.2. Robustness test
We apply the model to other stock index returns to check the robustness of estimating results. The Dow Jones Industrial Average7 is used for the U.S. stock market and the Shanghai Stock Exchange Composite Index8 is used for China’s stock market. reports the estimating results for robustness test and shows the dynamic correlation for robustness test. Similar results are obtained compared to and , indicating the robustness of our empirical results.
Figure 4. Dynamic correlations of stock return and economic growth (robustness test). Source: Author’s estimations.
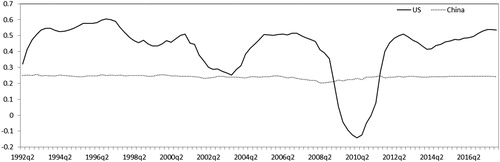
Table 4. Estimating results for copula functions (robustness test).
4.3. Discussion
The generally positive correlation of stock index return and G.D.P. growth rate indicates the existence of co-movement of stock return and economic growth in both the U.S. and China. However, the co-movement exhibits different dynamic characteristics in the U.S. and China. According to , the co-movement of stock return and economic growth in China is stable, but with a relatively low degree, while the degree of co-movement in the U.S. is much higher but is characterised with obvious fluctuations. The dynamic correlation of stock return and G.D.P. growth in the U.S. exhibits two significant drops during the periods of 2001q1–2003q4 and 2008q2–2010q2.
The overall degree of the co-movement of stock return and economic growth is higher in the U.S. than in China, which we think is due to the difference in the economy system and economic growth mode of these two countries. The U.S. has a mature free-market economy system and its economic growth follows a so-called ‘bottom-up’ mode that refers to the situation that the macroeconomic growth is promoted by the growth of small- and medium-sized enterprises (S.M.E.s). Under the bottom-up growth mode, economic growth depends heavily on the performance of S.M.E.s (Blackford, Citation2003) and the government only relies on fiscal and monetary policy instruments to implement adjustments to economic growth. If the majority of enterprises operate in good conditions, then G.D.P. will naturally grow. On the other hand, good profitability can increase enterprises’ intrinsic value and enhance investors’ confidence for enterprises’ future development. As a result, good performance of S.M.E.s can lead to economic growth and push up the stock market, and vice versa. Therefore, the bottom-up economic growth mode results in a high degree of co-movement of stock return and economic growth in the U.S. However, such co-movement could be significantly impacted by external and internal shocks in the short-term. For example, both the event of the 9/11 Terrorist Attacks in 2001 and the 2008 global financial crisis caused a significant short-term drop in the correlation of S&P 500 return and G.D.P. growth rate. In the long-run, the correlation can recover to the normal level.
China’s economy is currently in the period of transition to market economy and its economic growth follows a so-called ‘top-down’ mode. The central government used to ‘manage’ the G.D.P. growth rate and the economic growth is considered to be government-oriented (Rawski, Citation2001; Xu & Gao, Citation2015). From local governments at all levels to the central government, setting economic growth targets has become the norm in China and the primary task of governments is to achieve the economic growth target. In order to do so, the governments not only implement economic regulation and control through fiscal and monetary policy adjustment, but also intervene in the economic growth directly (Xu & Gao, Citation2015). For example, the Chinese government performed the 4 trillion economic stimulus plan to directly stimulate economic growth during the 2008 global financial crisis. The state-owned enterprises account for a considerable proportion of China’s economy, which provides convenience for governments to implement macroeconomic regulation and control (Chow, Citation1997; Gao, Citation1997). Although the private sector is not controlled by the government directly, it would definitely be influenced by governments’ signals, which usually lead to blind expansion. Therefore, the economic growth is mainly dominated by the government under the top-down mode. However, the stock return is mainly determined by the market, although the government sometimes intervenes in the stock market as well, which then results in a relatively low degree of co-movement of stock return and economic growth in China.
5. Conclusion and implications
The stock market is usually regarded as the barometer of economic growth in a country. In this paper, we investigate the co-movement of stock return and economic growth in the U.S. and China. The degree of co-movement is quantified by the correlation of stock index return and G.D.P. growth rate. Considering that the co-movement may have dynamic characteristics due to the influence of internal and external factors, we derive the dynamic correlation of stock index return and G.D.P. growth rate by applying a time-varying copula model. Empirical results show that the co-movement of stock return and economic growth in the U.S. is relatively strong but fluctuant due to internal and external shocks, while the co-movement in China is relatively stable but weak. We think that the ‘bottom-up’ economic growth mode of the U.S. and the ‘top-down’ economic growth mode of China cause the different characteristics of the co-movement of stock return and economic growth in these two countries.
Despite the world-famous growth of the Chinese economy, the government’s intervention in the economy is too deep. This has led to a more pronounced phenomenon of macro-microeconomic divergence and the deviation of the stock price from the G.D.P. curve. This model is not conducive to sustained economic development, and is not conducive to the development of China’s stock market. Therefore, the Chinese economy should further transform to a market economy, improve the efficiency of economic growth, and play a role in regulating the economy of the stock market.
Although China’s economy has achieved remarkable and sustainable growth since the 1980s, it is noted that the government’s intervention and control have played an important role, which resulted in the pronounced phenomenon of macro-microeconomic divergence and the deviation of stock return and economic growth. The ‘top-down’ growth mode is not conducive to the quality of economic growth sustained economic development and the development of China’s stock market. The Chinese government should further deepen economic reforms and improve the efficiency of economic growth, while making full use of the stock market’s functions of economic prediction and adjustments. The high degree of co-movement of stock return and economic growth in the US reflects the common development of the stock market and economy. However, it is noted that such a relationship is vulnerable to external shocks and then takes a long time to recover. This finding implies that the US government needs to play its regulatory functions in a timely and effective manner to promote quick recovery of the stock market and economy after shocks.
Disclosure statement
The authors report no conflicts of interest.
Additional information
Funding
Notes
1 The value of q can be determined according to A.I.C. in empirical study.[TS: Please set all footnotes as Endnotes as per the style for this journal]
2 There are two types of stock, A-share and B-share stocks, traded in Shanghai Stock Exchange. A-share stocks are issued by Chinese companies and traded by domestic investors with R.M.B.. B-share stocks are issued by Chinese companies and traded by foreign investors with foreign currency. The total market value of A-share stocks traded in Shanghai Stock Exchange is dominant, much greater than that of B-share stocks.
3 Data source: http://www.sse.com.cn/market/
4 Data source: http://www.stats.gov.cn/tjsj/
5 Data source: http://wrds-web.wharton.upenn.edu/wrds/
6 Data source: http://www.bea.gov/national/index.htm#gdp
7 The Dow Jones Industrial Average is a stock market index that is calculated using the stock prices of 30 large publicly owned companies based in the U.S. and is another widely-used stock market index for the U.S. stock market.
8 The Shanghai Stock Exchange Composite Index is a stock market index that is calculated using all stocks traded at the Shanghai Stock Exchange, including A-shares and B-shares.
References
- Abid, F., Bahloul, S., & Mroua, M. (2016). Financial development and economic growth in MENA countries. Journal of Policy Modeling, 38(6), 1099–1117. doi: 10.1016/j.jpolmod.2016.06.006
- Aylward, A., & Glen, J. (2000). Some international evidence on stock prices as leading indicators of economic activity. Applied Financial Economics, 10(1), 1–14. doi: 10.1080/096031000331879
- Blackford, M. G. (2003). A history of small business in America, 2nd ed, California: The University of North Carolina Press.
- Cheung, Y. W., & Ng, L. K. (1998). International evidence on the stock market and aggregate economic activity. Journal of Empirical Finance, 5(3), 281–296. doi: 10.1016/S0927-5398(97)00025-X
- Chow, G. C. (1997). Challenges of China’s economic system for economic theory. American Economic Review, 87, 321–327.
- Cole, R. A., Moshirian, F., & Wu, Q. (2008). Bank stock returns and economic growth. Journal of Banking & Finance, 32(6), 995–1007. doi: 10.1016/j.jbankfin.2007.07.006
- Cornell, B. (2010). Economic Growth and Equity Investing. Financial Analysts Journal, 66(1), 54–64. doi: 10.2469/faj.v66.n1.5
- Dong, X., & Yoon, S. M. (2018). What global economic factors drive emerging Asian stock market returns? Evidence from a dynamic model averaging approach. Economic Modelling, Forthcoming, doi: 10.1016/j.econmod.2018.09.003
- Fama, E. F. (1981). Stock returns, real activity, inflation, and money. American Economic Review, 71, 545–565.
- Fama, E. F. (1990). Stock returns, expected returns, and real activity. Journal of Finance, 45(4), 1089–1108. doi: 10.2307/2328716
- Gao, S. (1997). China’s economic restructuring, structural adjustment and social stability. China Economic Review, 8(1), 83–88.
- Giannellis, N., & Papadopoulos, A. P. (2016). Intra-national and international spillovers between the real economy and the stock market: The case of China. Journal of Economic Asymmetries, 14(A), 78–92. doi: 10.1016/j.jeca.2016.07.001
- Greene, W. H. (2018). Econometrics analysis, 8th ed. London: Pearson Publishing Ltd.
- Hamilton, J. D. (1994). Time series analysis. New Jersey: Princeton University Press.
- Hassapis, C., & Kalyvitis, S. (2002). Investigating the links between growth and real stock price changes with empirical evidence from the G-7 economies. Quarterly Review of Economics and Finance, 42(3), 543–575. doi: 10.1016/S1062-9769(01)00111-9
- Heiberger, R. H. (2018). Predicting economic growth with stock networks. Physica A: Statistical Mechanics and Its Applications, 389, 102–111. doi: 10.1016/j.physa.2017.07.022
- Hu, J. (2010). Dependence structures in Chinese and US financial markets: A time-varying conditional copula approach. Applied Financial Economics, 20, (7), 561–583. doi: 10.1080/09603100903459865
- Madsen, J. B., Dzhumashev, R., & Yao, H. (2013). Stock returns and economic growth. Applied Economics, 45(10), 1257–1271. doi: 10.1080/00036846.2011.613802
- Manner, H., & Reznikova, O. (2012). A survey on time-varying copulas: Specification, simulations, and application. Econometric Reviews, 31(6), 654–687. doi: 10.1080/07474938.2011.608042
- Mauro, P. (2003). Stock returns and output growth in emerging and advanced economies. Journal of Development Economics, 71(1), 129–153. doi: 10.1016/S0304-3878(02)00136-0
- Nitschka, T. (2014). Developed markets’ business cycle dynamics and time-variation in emerging markets’ asset returns. Journal of Banking & Finance, 42, 76–82. doi: 10.1016/j.jbankfin.2014.01.035
- Pan, L., & Mishra, V. (2018). Stock market development and economic growth: Empirical evidence from China. Economic Modelling, 68, 661–673. doi: 10.1016/j.econmod.2017.07.005
- Patton, A. J. (2004). On the out-of-sample importance of skewness and asymmetric dependence for asset allocation. Journal of Financial Econometrics, 2, (1), 130–168. doi: 10.1093/jjfinec/nbh006
- Patton, A. J. (2006a). Estimation of multivariate models for time series of possibly different lengths. Journal of Applied Econometrics, 21(2), 147–173. doi: 10.1002/jae.865
- Patton, A. J. (2006b). Modelling asymmetric exchange rate dependence. International Economic Review, 47(2), 527–556. doi: 10.1111/j.1468-2354.2006.00387.x
- Rawski, T. G. (2001). What is happening to China’s GDP statistics? China Economic Review, 12(4), 347–354. doi: 10.1016/S1043-951X(01)00062-1
- Ritter, J. R. (2005). Economic growth and equity returns. Pacific-Basin Finance Journal, 13(5), 489–503. doi: 10.1016/j.pacfin.2005.07.001
- Silva Filho, O. C., Ziegelmann, F. A., & Dueker, M. J. (2013). Assessing dependence between financial market indexes using conditional time-varying copulas: Applications to value at risk (VaR). Quantitative Finance, 1–16. doi: 10.1080/14697688.2012.739726
- Xu, X., & Gao, Y. (2015). Growth target management and regional economic growth. Journal of the Asia Pacific Economy, 20(3), 517–534. doi: 10.1080/13547860.2015.1054172