
 ?Mathematical formulae have been encoded as MathML and are displayed in this HTML version using MathJax in order to improve their display. Uncheck the box to turn MathJax off. This feature requires Javascript. Click on a formula to zoom.
Abstract
This study employed Enders and Siklos asymmetric co-integration frameworks, including the momentum threshold autoregressive (M-TAR) and logistic smooth transition co-integration (LSTC) models, to investigate whether contagion effects had existed in international stock markets by using the changes in the asymmetric co-integration relationships between the U.S. S&P 500 Index and a total of 23 markets in Asia, Europe, and America during the subprime crisis. The main findings demonstrated that the subprime crisis did not reinforce co-movement trends between the S&P 500 Index and these stock markets, by the application of the Engle-Granger (1987) symmetric co-integration test. However, with the application of the asymmetric co-integration frameworks, both M-TAR and LSTC showed there existed contagion effects between them in the aftermath of Lehman Brothers’ bankruptcy in 2008; transition speeds between these two regimes also substantially increased in the LSTC during the financial crisis. Only the Chinese market was not affected by the U.S. market during this crisis; only an interdependence effect existed between the U.S. and China. The subprime crisis determined the degree of contagion, depending on the financial linkage to the U.S. market, which further demonstrates the differences in the causes and influence between the subprime crisis and other financial crises in emerging markets.
1. Introduction
The subprime crisis (2007–2012) disordered the U.S., Europe (Eurozone) and global financial markets and economies (Longstaff, Citation2010). The Fed passed a bailout plan for investment banks and institutions and had poured more than 1000 billion dollars into the financial markets to purchase the non-performing loans to rescue the liquidity of the U.S. financial markets through quantitative easing (QE).1
Past literature about the contagion phenomenon due to financial crises by Lee and Kim (Citation1993), Forbes and Rigobon (Citation2002), Caramazza et al. (Citation2004), Dungey et al. (Citation2006), Lucey and Voronkova (Citation2008), Gilmore et al. (Citation2008), Arouria et al. (Citation2009) that included the contagion effect or the transmission effect had been based on the backgrounds of several financial crises since the late 1980s, including those in the U.S. (1987), Mexico (1994), Thailand (1997), Russian (1998), and Argentina (1999). Recent literature, such as that by Sikka et al. (Citation2009), Swan (Citation2009), Longstaff (Citation2010), Claessens et al. (Citation2010), Abad et al. (Citation2010), Sobreira (Citation2011), Iyer and Peydró (Citation2011), Samarakoon (Citation2011), Afonso et al. (Citation2012), Chouliaras et al. (Citation2012), Frankel and Saravelos (Citation2012), Dumontaux and Pop (Citation2013), Kenourgios et al. (Citation2013), Bekaert et al. (Citation2014) and Jiang et al. (Citation2017) about the contagion effect was based on the backgrounds of the subprime crisis and the European Monetary Union (EMU) sovereign-debt crisis (2009–2013).
The subprime crisis was an epochal—and the most indicative—crisis in the aforementioned crises. Although the U.S. stock market collapse in 1987 triggered a global stock market crash, the background of international macroeconomic and technological applications was a lot different from that of the subprime crisis in terms of globalisation and liberalisation of the trade environment and the rapid development of capital markets in emerging countries. Freer capital flow among international security markets, electronic trading systems and the linkage of the internet in stock markets as well as highly developed derivatives have all accelerated the speed of information transmission and increased the links between the international security markets, and these factors have brought about significant differences between the subprime crisis and the U.S. stock market collapse in 1987. Other financial crises in Mexico, Thailand, Russia, Brazil and Argentina were only regional crises from emerging markets; therefore, the scope of their influence was limited only to the neighbouring countries where the crises occurred, and these crises did not spread globally; apparently, the impact of the subprime crisis was greater than that of the aforementioned events.
Moreover, the excessively issued derivatives by banks and the major negligence in the financial regulatory systems in the U.S. and western European countries caused the subprime crisis, which showed that there existed a significant difference in the cause of the subprime crisis compared to the past financial crises in emerging markets.2 The subprime crisis also hit the real output of the U.S. and global economy. Corporate bankruptcies accompanied by unemployment and capital expenditure cuts led to the decline in every country in consumption, investment, import, and export. The U.S., Eurozone and part of Asia all suffered a recession in the period from the fourth quarter of 2008 to 2010. Scholars thought the chain reactions incurred by the subprime crisis had never been seen since the Great Depression (1929–1933). The financial institutions and investors with investments in subprime products lost a lot of money. Hence, the liquidity of the financial markets decreased severely. The financial institutions needed capital injections from their governments. The major industrial countries contributed and coordinated their policies to reverse the financial disaster.
The subprime crisis, which seems to have had a perceived structural change regarding the influence of the U.S. stock market, has had a great effect upon the major financial markets of the whole world (Gorton, Citation2009; Longstaff, Citation2010; Kenourgios and Dimitriou, Citation2015; Flavin and Sheenan, Citation2015). Therefore, we used this crisis as the breaking point to investigate the influence of the U.S. stock market on the Asian, European, and American stock markets around the subprime crisis.
Because past research about the contagion effect due to financial crises mostly emphasised the crises from emerging or developing countries (Caramazza et al., Citation2004; Caporale et al., Citation2005; Dungey et al., Citation2006; Arouria et al., Citation2009), the scope of their influence was limited. The subprime crisis, which caused a global financial crisis, was a rare incident of the past one hundred years (Dimitriou et al., Citation2013; Lien et al., Citation2018); nevertheless, its impact can still be seen at present. How were the relationships between the U.S. stock market and global stock markets affected when an impact of a significant risk event occurred, e.g., the subprime crisis, due to the stronger links of the international financial markets? Was the impact more significant during the period of ʽthe subprime crisisʼ than that during ʽtranquil timesʼ? Was the relationship changed by the negative impact of the subprime crisis? This study attempts to clarify the changes of relationships between the U.S. stock market and international stock markets during tranquil times and during crisis times. We want to offer our opinions to investors about investing in international security markets, and we also hope to provide references to government departments on policy-making for financial oversight, which was the first research motivation of our study.
For the contagion effect, the co-integration method was often employed to examine whether a co-integration relationship around a crisis had changed in past literature. Two points were considered in this study. Firstly, the use of ʽsymmetric adjustmentsʼ in the traditional co-integration model ignored that adjustment speeds were different when the stock market was in an upward status or in a downward status. Li and Lam (Citation1995), Koutmos (Citation1998), and Chiang (2001) indicated that co-integration between stock markets was asymmetric; Wang and Lin (Citation2005), Shen et al. (Citation2007), and Chang (2008, 2010) further employed the asymmetric co-integration test for their empirical studies. Therefore, to seek a better method to confer the interaction across international stock markets became the main topic in this article. We employed the ʽasymmetric co-integrationʼ or ʽnon-linear co-integrationʼ method to compare the changes in the asymmetric co-integration relationships between the U.S. stock market and the other stock markets during the subprime crisis; a regime-shift model is a method which observes the influence sustainability from information to the stock markets, and it is not affected by structural breaks or structural change points. We continued the approach framework in our earlier studies (Nieh et al., Citation2011; Nieh et al., Citation2012), which employed the Enders and Siklos (Citation2001) momentum threshold autoregressive (M-TAR) model to investigate the regime-switching behavior in these co-integration relationships.
The Enders and Siklos (Citation2001) threshold co-integration model is not accurately and fully specified when the transition of the transitional variables or threshold variables is a jump transition process. The problems, such as whether the transition of the transitional variables is smooth between two regimes or whether there is heteroscedasticity in the information transmission in international stock markets, are seldom considered in the Enders-Siklos threshold co-integration method.
Secondly, we investigated how the asymmetric adjustment and the smooth transition phenomenon influenced the contagion effect. We applied the logistic smooth transition regressive (LSTR) method proposed by Granger and Teräsvirta (Citation1993) and Teräsvirta (1994, 1998), which was the expansion of the Enders-Siklos threshold co-integration model and the logistic smooth transition co-integration (LSTC) model, to compare the contagion effect from the U.S. stock market to the Asian, European, and American stock markets, pre- and during the subprime crisis. Therefore, asymmetric adjustments and smooth transition could exist in an upward status (positive impact) or a downward status (negative impact). How did the two phenomena influence contagion effects of the stock markets? Did different correlations, co-movement, interdependence, or contagion effects exist in bull markets or bear markets? These issues were seldom discussed in previous literature; therefore, we decided to explore these issues by employing the threshold co-integration model and the logistic smooth transition co-integration model. The second research motivation of our study was to find the differences between the results of the symmetric co-integration test and the asymmetric co-integration tests, including the M-TAR and the LSTC models, as well as the differences between the M-TAR and LSTC models.
The structure of this article is arranged as follows: Previous literature regarding contagion effects, including the theoretical and empirical studies, will be discussed in Section 2, the main empirical methodologies in Section 3, the data description and empirical results in Section 4, and the conclusions in Section 5.
2. Overview of related literature
2.1. Definitions of contagion effect
Before an empirical investigation is conducted, ʽcontagionʼ must be defined first. The World Bank has given contagion three definitions, namely, a broad definition, a restrictive one, and a very restrictive one. The broad definition of contagion refers to the cross-country transmission of shocks, or the general cross-country spillover effects, as contagion does not need to be related to crises. The restrictive definition of contagion refers to the transmission of shocks to other countries or the cross-country correlation, beyond any fundamental link among the countries and beyond common shocks. This definition is usually referred to as excess co-movement, commonly explained by herding behavior. The very restrictive definition of contagion refers to the occurrence of contagion when cross-country correlations increase during ʽcrisis timesʼ relative to correlations during ʽtranquil timesʼ (Nieh et al., Citation2011).
Why would economic and financial shocks transmit or spread from one country to another? They eventually became international crises events, a main reason being cross-country (or cross-economy) linkages.
The main economic theoretical bases of the empirical works in this study were the theories of cross-country linkage channels and crisis contagion. In the economic theory regarding the channel of cross-country linkage or impact transmission, there are three main linkage channels between one country or economy and other countries (economies), namely, the financial links, the real links, i.e., the links of real economy or macro economy, and the political links. The financial links represented the cross-country, cross-economy, or cross-market linkages occurring in the international financial market system (Wong, Citation2000; Forbes and Rigobon, Citation2002). The real links implied the cross-country linkages caused by fundamental factors, e.g., international trade and foreign direct investment (Forbes, 2002). The political links represented the cross-country linkages by political regimes. The transmission mechanism or propagation mechanism could be used to explain the cross-country linkage channels (Edwards, Citation1998; Edwards, Citation2000; Kaufman, Citation2000).
Forbes and Rigobon (Citation2002) expounded the transmission mechanism by using three points, namely, the coordination on trade and policy, the re-evaluations of the regimes of the countries, and the stochastic aggregate shocks, including shocks on finance markets. Furthermore, they also stated the changes in the transmission mechanisms of exogenous shocks in the periods of tranquil times and crisis times by using the two conceptions of multiple equilibrium and endogenous liquidity.
A crisis contagion theory explains that if there was co-movement or a common trend between different markets, then a shock in one market would transmit to another market. Dornbusch et al. (Citation2000) defined contagion as a significant increase in cross-market linkages after a shock to an individual country or market, as measured by the degree to which asset prices or financial flows moved together across markets relative to the co-movement in tranquil times. Forbes and Rigobon (Citation2001) divided how the shocks were propagated into two groups of theories: crisis-contingent and non-crisis-contingent theories. Crisis-contingent theories are those that explain why transmission mechanisms change during a crisis, and therefore, why cross-market linkages increase after a shock. Non-crisis-contingent theories assume that transmission mechanisms are the same during a crisis or at more stable periods, and therefore, cross-market linkages do not increase after a shock (Nieh et al., Citation2011).
Kaminsky et al. (Citation2003) redefined a contagion effect, as a strong ʽimmediate effectʼ from a market to other markets after a filed crisis event, by using several previous financial crises as references; they also pointed out that one of the main crisis transmission mechanisms was international trade. In a word, if a market trend, the prices or returns of assets, and/or volatilities of prices or returns is transmitted or spread from one market to another after the collapse of a market, or during the period of a crisis event, this phenomenon is called ʽcontagionʼ. This issue has been extensively discussed in the context of international financial crises, e.g., Barassi et al. (Citation2005), Wang et al. (Citation2007) for the monetary markets; Skintzi and Refenes (Citation2006) and Johansson (2008) for the bond markets; and Forbes and Rigobon (Citation2002) and Syriopoulos (2007) for the stock markets. Our analysis in this study was based on the very restrictive definition given by the World Bank.
The main purpose of this study was to investigate whether the variations had existed in the channels or mechanisms of transmission between the U.S. stock market and Asian, European, and American stock markets, i.e., the financial links, around the subprime crisis between 2007 and 2010.
2.2. Empirical research of contagion effect
In empirical studies, Dornbusch et al. (Citation2000) and Forbes and Rigobon (Citation2001, Citation2002) pointed out that four approaches had been utilised to measure how shocks were transmitted internationally: cross-market correlation coefficients, ARCH or GARCH frameworks, co-integration techniques, and direct estimation of specific transmission mechanisms by using the Probit model (Nieh et al., Citation2011; Nieh et al., Citation2012).
Many researchers considered that significant increases of correlation or co-movement of the stock markets were the indicators of a contagion effect. King and Wadhwani (Citation1990), Lee and Kim (Citation1993) and Cha and Oh (Citation2000) used the correlation approach and found that international stock markets had become more interrelated after the 1987 U.S. stock market crash and the 1997 Asian financial crisis, respectively. The strengthening co-movement among international stock markets continued for a longer period after these two crashes.
Hamao et al. (Citation1990) utilised the GARCH model and found that there were volatility spillovers of the stock markets from New York to Tokyo, London to Tokyo, and New York to London after the 1987 U.S. stock market collapse. Edwards and Susmel (Citation2001) employed both the univariate and bivariate switching volatility models to analyse the behavior of volatility through time in Latin American countries, and they showed that there existed short-lived high-volatility episodes, in general, lasting from two to 12 weeks, and the result supported the existence of volatility co-movements across these countries. Forbes and Rigobon (Citation2002) argued that tests for contagion based on cross-market correlation coefficients were problematic due to the bias introduced by changing volatility in market returns (heteroskedasticity), and that under the assumption of no omitted variables or endogeneity; it is possible to adjust this bias. By using this adjustment, there were virtually no high levels of market co-movement, which they called interdependence, i.e., no contagion, during the 1987 U.S. stock market collapse, the 1994 Mexican devaluation, and the 1997 Asian financial crisis. Caporale et al. (Citation2005) found the existence of contagion within the stock markets in Hong Kong, Japan, South Korea, Singapore, Taiwan, and Malaysia during the 1997 Asian financial crisis by using the conditional variance with the applications of both heteroskedasticity and endogeneity biases, and invented a common shock to deal with the omitted variable problem.
Arshanapalli and Doukas (Citation1993) reported that co-integration relations did not exist in the U.S. Dow Jones Index and France, Germany, and the U.K. stock markets before the 1987 U.S. stock market collapse; however, there were co-integration relations between them after the U.S. stock market collapse. Sheng and Tu (Citation2000) employed the co-integration test and found that contagion effects existed in the U.S. stock market and eleven Asian stock markets around the 1997 Asian financial crisis. Chen et al. (Citation2002) used the co-integration and ECM to investigate the dynamic interdependence among the six major stock markets in Latin America, including Argentina, Brazil, Chile, Colombia, Mexico and Venezuela from 1995 to 2000, and found that there existed dependency effects in prices; and they partitioned all the samples into the periods of pre- and during the Asian and Russian financial crises in 1997 and 1998, respectively. Bekaert et al. (Citation2005) also reported that co-integration relations did exist among the Asian stock markets during the 1997 Asian financial crisis, which demonstrated a contagion effect. Therefore, based on the aforementioned studies, if co-integration exists across security markets, there will be a common trend among them.
In recent years, many scholars have researched the topics concerned with the subprime crisis, the EMU sovereign-debt crisis, and the QE policy. Gorton (Citation2009) was thorough in his work on the derivatives about the subprime mortgage loan, e.g., mortgage backed securities (MBS), collateralised debt obligations, (CDOs), credit default swap (CDS), as well as their development processes, issue modes and structures. Longstaff (Citation2010) discussed the contagion effect from the CDOs to the security markets in the U.S. between 2006 and 2008; the ABX index of CDOs was employed to examine whether the contagion effect existed in the mortgage bond market in this study, and it was found that the contagion effect spread first from the lower credit rating CDOs to the higher credit rating CDOs in the CDOs market, and then from the CDOs market to the markets of treasury bills and stocks. Hui and Chung (Citation2011) discussed the transmission effect from the CDS market to other financial markets in the Eurozone during the period of the EMU sovereign-debt crisis, and found that the information flow in the CDS, futures, and options markets was the main cause, which resulted in the spread of the crisis.
Similar research conducted by Aloui et al. (Citation2011) found that there was strong evidence of time-varying dependence between each of the BRIC (Brazil, Russia, India and China) markets and the U.S. markets during the subprime crisis. Samarakoon (Citation2011) showed the evidence of contagion among the U.S. and frontier equity markets, but not among the U.S. and emerging markets, by constructing various shock models. Kenourgios and Padhi (Citation2012) demonstrated that the evidence on stock markets seemed to constitute a stronger transmission mechanism during the Russian default crises, the Asian financial crises and the subprime crisis. Dimitriou et al. (Citation2013) discussed financial contagion among the BRICS (BRIC and South Africa) and the U.S. during the subprime crisis, and they showed that contagion appeared after the Lehman Brothers’ collapse in almost all stock markets. Kenourgios (Citation2014) reported volatility contagion across the U.S. and European stock markets during the subprime crisis and the Eurozone sovereign debt crisis, and their empirical evidence showed that there was contagion in cross-market volatilities. Kenourgios and Dimitriou (Citation2015) investigated the contagion effects among ten sectors in six developed and emerging regions during the subprime crisis (2007–2009), and they also pointed out that the Lehman Brothers’ collapse marked the start of the most contagious phase. Luchtenberg and Quang (Citation2015) showed strong evidence that cross-market linkages increased among many financial markets during the 2008 financial crisis.
Some studies regarding the impact of crisis events, including political and financial crises, on eastern and southern European countries were as follows: Osińska et al. (Citation2016) compared the effects from political crises to the selected stocks in the U.S. and Russian stock markets, including the indices of NYSE, NASDAQ and MOEX, around the 2014 Ukrainian crisis, from the perspective of a market microstructure. They indicated that the MOEX index lacked an appropriate transmission channel or mechanism from informed investors to the other markets. Guidi and Ugur (Citation2013) indicated that the correlation structures between the U.K., the U.S. and the southern and eastern European equity markets had changed over time around the subprime crisis between 2007 and 2009. Thalassinos et al. (Citation2015) found that there existed different channels of influence in the developed western European countries, the U.S. and Japan, i.e., the mature capital markets, and in the southern and eastern European emerging countries (Greece, Romania, Hungary, Poland, and Slovenia) during the subprime crisis. Kizys and Pierdzioch (Citation2011) found that the long-run linkages among different stock markets had also changed over time. The long-run linkages between the U.S. stock market and the Czech Republic, Hungary, and Poland stock markets increased in fundamentals and speculative bubbles during the subprime crisis.
In the studies regarding the quantative easing (QE) policy of the U.S.,3 most of these studies focused on the influence of QE on interest rates and bond yields in the U.S., emerging countries in Asia, and other developed countries, respectively (Neely, Citation2010; Krishnamurthy et al., Citation2011; Hamilton and Wu, Citation2012; D’Amico and King, Citation2013; Jarrow and Li, Citation2014; Cho and Rhee, Citation2014). Research indicated that the Fed purchased the long-term government bonds and MBS, which could significantly reduce the interest rates and bond yield rates in the U.S. bond market, e.g., Christensen and Rudebusch (Citation2012), Hamilton and Wu (Citation2012), D’Amico and King (Citation2013) and Kiley (2014) for government bond; Krishnamurthy et al. (Citation2011) for corporate and agency bonds; and Jarrow and Li (Citation2014) for mortgage bonds. Guidolin et al. (Citation2014) empirically investigated the impact of QE on the U.S. corporate bond market and found corporate bond yields were significantly lowered during the periods of QE1 and QE2; and they also found that the investment grade (IG) bonds belonged to at least BBB- to Baa rankings.
3. Methodologies
3.1. The M-TAR model
The methodology frameworks in this study, including the Enders and Siklos (Citation2001) M-TAR model and the logistic smooth transition co-integration (LSTC) model, were utilised in our earlier studies (Nieh et al., Citation2011, Nieh et al., Citation2012), and the M-TAR model for threshold co-integration. Enders and Siklos (Citation2001) extended the Engle and Granger (Citation1987) method to test asymmetric co-integration. First, the long-term equilibrium relationship is as follows.
(1)
(1)
In this study, we used the daily frequency data which enabled us to gather sufficient sample sizes to conduct our empirical research. Where was the logarithm of the Asian, European and American stock indices for country i on period
, and
represented the 23 countries in our study, respectively.
implied the logarithm of the U.S. stock index, while
represented period
in the U.S. market, which stood for the U.S. market versus the Asian and European markets, but period
in the U.S. market, which stood for the U.S. market versus the American markets, when the time lag of the trading day had to be considered (Eun and Shim, Citation1989; Liu et al., Citation1998).
measured the estimated residuals. The MTAR model was given as:4
(2)
(2)
(3)
(3)
where
was the Heaviside indicator function, and
denoted the unknown threshold value,5 and
was the residual of the white-noise disturbance.
The null hypothesis of no co-integration () was tested using specifically derived critical values provided by Enders and Siklos (Citation2001). If the null of no co-integration was rejected, the null of symmetric integration (
) could be tested using a standard F-test.
3.2. The LSTC model
Furthermore, when we examined the ʽasymmetric contagion effectʼ from the U.S. stock market to Asian, European, and American stock markets during the period of the subprime crisis, we also had to consider the problem of whether the transition process of the threshold variable was a smooth transition between two regimes. Therefore, we applied the Granger and Teräsvirta (Citation1993) and Teräsvirta (1994, 1998) logistic smooth transition regression (LSTR) technique to further extend the Enders and Siklos (Citation2001) M-TAR framework, which is called the logistic smooth transition co-integration model. The long-term equilibrium relationships between the U.S. stock market and the 23 stock markets were measured by , which was estimated via OLS (1).
Next, we employed the foregoing model to test non-linear co-integration or asymmetric co-integration with a logistic smooth transition process between our samples, which was generalised from the Enders-Siklos M-TAR framework as:
(4)
(4)
With
(5)
(5)
where
was the logistic smooth transition function,
was the threshold variable or transition variable,
was the threshold value or location parameter,
was the residual of the white-noise disturbance (
∼ iid (0,
)), and
was the smooth parameter or slope parameter in
, which was employed to measure the transition speed between two difference regimes.
Note that in this case of our study, was the lagged different error term. Clearly, if
,
in the state dependent (4) changed monotonically with the independent variable
as (5) in (4) was a smooth continuous increasing function of
and took a value between 0 and 1, depending on the magnitude of
. When
, the value of the transition function (
) equaled to 0.5, and the current regime was half way between the two extreme upper and lower regimes. When
was large and positive (
), the value of the transition function equaled to 1, and
was effectively generated by the linear model
; while when
was large and negative (
), the value of the transition function
approached 0, and
was virtually generated by
. The intermediate value of
provided a mixture of the two extreme regimes. Note that the M-TAR model manifested a special case when smoothness parameter
approached infinity in (5),
became a Heaviside indicator function with
= 1 for all values of
greater than
, and
= 0 otherwise, and (4) became the M-TAR model. If
, the value of the transition function equalled 0.5 regardless of whether
was positive, negative, or 0.
In the logistic smooth transition Enders-Siklos co-integration framework (4 and 5), we could still employ the Enders and Siklos (Citation2001) co-integration test to examine the co-integration relationship; therefore, the no co-integration hypothesis () was tested using specifically derived critical values provided by Enders and Siklos (Citation2001).
When approached zero, (4) became the linear AR(p) model, implying that the AR model was nested in the logistic smooth transition Enders-Siklos co-integration model. Therefore, our first step in specifying the model was to test linearity against the logistic smooth transition Enders-Siklos co-integration model form. If the null of linearity could not be rejected, we could conclude that the AR model adequately represented the data generating process. However, if linearity was rejected, we would continue to estimate the highly non-linear logistic smooth transition Enders-Siklos co-integration model form using the non-linear least squares (NLLS) approach. From (4) and (5), it could be observed that testing
was a non-standard testing problem since (4) was identified only under the alternative
. Thus, standard t- and F-testing methods were not appropriate steps to arrive at a model choice. Therefore, this study followed Luukkonen et al. (Citation1988) to compute a first- and third-order Taylor series approximation to the
under the null of
.in (4)
When a third-order Taylor series approximation was used, the expanded and re-parameterised equation was:
(6)
(6)
The possible way to identify the appropriate model, the linear co-integration model, and the logistic smooth transition co-integration model was through a sequence of test parameter values from (6), (Woodward and Marisetty, Citation2005). Thus, we believe that the linearity test was identical to testing the joint restriction that all non-linear terms were zero in the null hypothesis, which was as follows:
(7)
(7)
In (7), if was not rejected, we would select the linear co-integration model. If
was rejected, we would select the logistic smooth transition co-integration model.
In recent years, more advanced econometric models have been employed in the research on the topics of the linkage or correlations of international equity markets. For example, the asymmetric generalised dynamic conditional correlation (AG-DCC) GARCH models, the rolling window sub-sample Granger causality test and the dynamic copulas with and without regime-switching (Cappiello et al., Citation2006; Jondeau and Rockinger, Citation2006; Okimoto, Citation2008; Balcilar et al., Citation2010; Kenourgios et al., Citation2011). However, the basics of these models are substantially different from the three models in our study (Engle-Granger, Enders-Siklos, LSTC). The three models built the co-integration relationships and the asymmetric adjustments of co-integration relationships on the residuals of linear equations between the two stock market variables in our study.
The comparison of the differences between the results of the traditional co-integration method, i.e., the symmetric co-integration method, and the asymmetric co-integration method, was one of the main motivations and objectives in our study. Moreover, the Engle-Granger ADF co-integration framework is a special version of the Enders-Siklos threshold co-integration framework (Enders and Siklos, Citation2001), and the Enders-Siklos threshold co-integration model (including M-TAR model) is a special version of the LSTC model. Therefore, we attempted to build a benchmark of comparison by using the Engle-Granger model, the Enders-Siklos M-TAR model and the LSTC model in our study due to the fact that the three co-integration models possess similar basics, yet there are differences among them.
4. Data and empirical results
4.1. Data description
This part of the study was conducted by researching the U.S., Asian, European, and north and south American stock markets. The Standard & Poor 500 (S&P 500) index was used in the U.S.; seven major stock markets were used in Asia: Taiwan, Hong Kong, Singapore, Japan, Korea, India, and China; twelve major stock markets in Europe: U.K., Germany, France, Netherlands, Belgium, Norway, Sweden, Russia, Poland, Czech Republic, Hungary, and Turkey; and four major stock markets in north and south America: Canada, Mexico, Argentina, and Brazil. All observations were taken as logarithms.6 The trade stocks in the S&P 500 Index included the top 500 enterprises in the NYSE and AMEX, and the total market value of the S&P 500 Index dominated over 80% of the total value of the NYSE.7. In addition, after taking factors such as liquidity and industrial representation into consideration, we believed that this index could reflect the conditions of the capital markets, the security markets, and the economy of the U.S more validly than the Dow Jones Index (Nieh et al., Citation2011).
The entire sample period was from 1 September, 2005 to 31 March 2010, a total of 730 daily observations were obtained for each variable.8 Bannigidadmath and Narayan (Citation2016) indicated that daily data were better than weekly or monthly data as the former provided much more information than the latter. Trading days and closing days were different in various stock markets; therefore, if one market did not have any transaction on a particular day, we would delete the data in other markets on the same day. We only kept the data of synchronised trading days in all stock markets. Hamao et al. (Citation1990) pointed out that discarding the data of non-synchronised trading days would not affect the accuracy of the empirical results.
Since there is still no consensus on the start date for the subprime crisis, it is not easy to determine an exact date. In general, scholars (Gorton, Citation2009; Sikka et al., Citation2009; Claessens et al., Citation2010; Longstaff, Citation2010) and the financial industry considered the report of the financial crisis of the New Century Financial Corp. as the beginning of the crisis. The Lehman Brothers’ filing for bankruptcy on 15 September 2008 aggravated the subprime crisis, which also caused the degree of severity of the crisis to rise to a higher level (Swan, Citation2009; Longstaff, Citation2010; Sobreira, Citation2011; Afonso et al., Citation2012; Frankel and Saravelos, Citation2012; Dumontaux and Pop, Citation2013; Song and Zhu, Citation2018). In addition, the U.S. Congress passed the Emergency Economic Stabilisation Act (EESA), which included the 700 billion dollars ʽTroubled Asset Relief Programʼ (TARP) on 4 October 2008. The negative effects of the subprime crisis on the U.S. and global stock markets were different between the two periods, namely, between 2007 and 2008 and between 2009 and 2010. Longstaff (Citation2010) pointed out that the subprime crisis could be divided into two sections in the timeline, the first section being earlier in 2007, and the reason was that the institutional investors, e.g., Bear Stearns, Merrill Lynch, the Federal National Mortgage Association (Fannie Mae) and the Federal Home Loan Mortgage Corporation (Freddie Mac), suffered huge losses due to their investment in subprime debts or derivatives. The second section began at the end of 2008, and the reason was that the global financial system continued to deflate currency due to the elimination of the huge subprime mortgage debts by institutions, enterprises, and governments. Therefore, in order to assure the consistency in our study, we used the date on which the trading of stocks of New Century Financial Corp. were terminated in the NYSE, i.e., 13 March 2007, as the first cutting point, and the date on which Lehman Brothers filed their bankruptcy, i.e., 15 September 2008, as the second cutting point. Thus, the ʽpre-subprime crisisʼ period was defined as 1 September, 2005 to 13 March 2007, and the first section of the ʽduring the subprime crisisʼ period was defined as 14 March 2007 to 15 September, 2008. The second section of the ʽduring the subprime crisisʼ period was defined as the period from 16 September 2008 to 31 March 2010. We, therefore, compared the estimated results of the different periods. The returns of stock price indices—which were the logarithms of after the first difference—were employed in our study. The stock price index returns were as follows:
Where ,
was the 24 stock markets in this study.
represents the summary statistics for all the returns in our study, and and demonstrated the time trends of logarithms of the stock indices and the stock index returns in 24 stock markets, respectively. In , there were downward trends in 24 stock indices, and in , there was a substantial increase in the variation of returns in the 24 stock markets during the period between the second half of 2007 and the first half of 2009. The results of the three unit root tests, augmented Dickey-Fuller (ADF; 1984), Phillips and Perron (Citation1988) and Kwiatkowski et al. (Citation1992), were summarised in , which showed that all the stock indices variables were the type series. represents the results of the KSS’s (2003) ESTAR unit root test, which showed that variables of all stock indices in this study were non-linear
series at the 1% significance level.
Figure 1. Logarithms of the stock indices in 24 stock markets. Source:
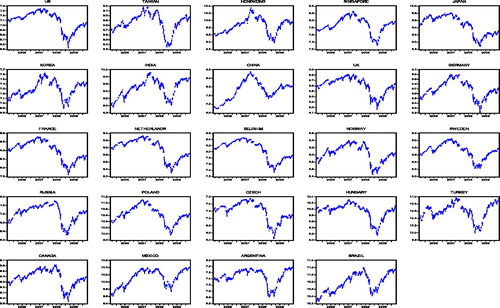
Figure 2. The stock index returns in 24 stock markets. Source:
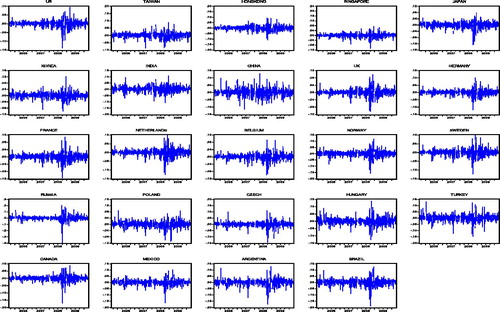
Table 1. Summary statistics for returns on stock indices.
Table 2. Results of various unit root tests.
Table 3. Results of the non-linear unit root test – the KSS test.
Because the correlation analysis of volatility of the stock index returns was employed to investigate the contagion or transmission effect in this study, i.e., volatility spillover effects of returns, we used the ARMA(p,q)-GARCH(1,1) model to fit the conditional variance, i.e., the volatility of returns; therefore, we first applied the ARCH-LM test to investigate the heteroscedasticity of the conditional variance in returns. represents the results of the ARCH-LM test for the volatility of returns in the period of the pre-subprime crisis 〈-(1)〉, the first section (section I) of the period of during the subprime crisis 〈-(2)〉, and the second section (section II) of the period of during the subprime crisis 〈-(3)〉 for all the returns in our study. In , when the residuals of the ARMA (p, q) model by the ARCH-LM test were examined, the null hypothesis of no GARCH effect was rejected at the 10% significance level in the three periods. Therefore, the use of the GARCH (1, 1) modelling to extract the values of the return volatility was appropriate.
Table 4. ARMA (p, q)-GARCH (1, 1) modeling and results of the ARCH-LM test for the volatility of returns.
and represent the results of the non-conditional correlation coefficients of returns and the volatility of returns, and the t statistics for them between the U.S. and Asian, European, and north and south American stock markets in the three periods around the subprime crisis, respectively, and shows the volatility of returns in the 24 stock markets.9 In , there was also a substantial increase in the volatility of returns in the 24 stock markets during the period between the second half of 2007 and the first half of 2009. In particular, it reached the peak during 2008 and 2009, which showed that higher and persistent fluctuations could be observed since the eruption of the subprime crisis; the phenomenon also demonstrated that the negative impact of the subprime crisis on the stock markets in various countries was very severe. In and , the results showed that both the correlation coefficients of returns and the volatility of returns increased significantly between the U.S. and most of the Asian, European, and north and south American markets (but not the Chinese stock market) during the subprime crisis, especially in Section II after Lehman Brothers filed for bankruptcy on 15 September 2008. The results in also represented that there were volatility spillovers between the U.S. stock market and the aforementioned stock markets, and the results in and supported the crisis-contagion theory by Dornbusch et al. (Citation2000) and Forbes and Rigobon (Citation2001).
Figure 3. The volatility of returns in 24 stock markets. Source:
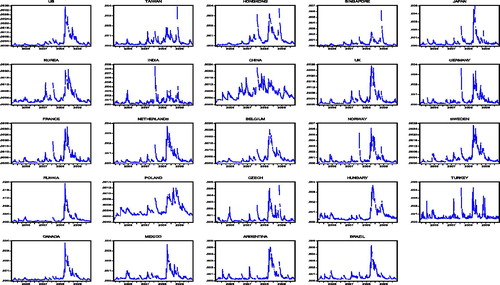
Table 5. Results of non-conditional correlation coefficients of returns.
Table 6. Results of correlation coefficients of volatility of returns.
4.2. The empirical results
In this part, we employed the Engle and Granger (Citation1987) co-integration test to examine the symmetric long-run equilibrium relationships, i.e., co-integration relationships, and the Enders and Siklos (Citation2001) M-TAR model and the logistic smooth transition co-integration model, respectively, to investigate the changes in the asymmetric co-integration relationships between the U.S. S&P 500 Index and 23 stock markets in Asia, Europe, and north and south America around the subprime crisis between 2007 and 2010.
represented the results of the Engle-Granger co-integration relationships between the U.S. and the 23 stock markets in the three periods around the subprime crisis. The null hypothesis of no co-integration is also shown in . In -(1), the results of the Engle-Granger ADF statistics show that there were co-integration relationships between the S&P 500 Index and the U.K., Germany, Norway, Czech Republic and Hungary stock markets at the 10% significance level in the period of the pre-subprime crisis. In -(2), the results show that there was a co-integration relationship between the U.S. stock market and Mexico stock market at the 5% significance level in Section I of the period of during the subprime crisis. In -(3), the results show that there was only a co-integration relationship between the U.S. stock market and stock markets in Germany, Netherlands and Hungary at the 10% significance level in Section II of the period of during the subprime crisis. The results in show that there was only significant increase in the co-integration relationship between the S&P 500 Index and the German DAX Index around the subprime crisis; this result was not consistent with the results of the correlation analyses of returns and the volatility of returns in and , and it did not support the crisis-contagion theory by Dornbusch et al. (Citation2000) and Forbes and Rigobon (Citation2001).
Table 7. Results of the Engle-Granger test for co-integration.
Enders and Granger (Citation1998) and Enders and Siklos (Citation2001) proposed two models for the threshold co-integration test, namely, the TAR model and the M-TAR model. This study adopted the M-TAR model. Enders and Granger (Citation1998) believed that when asymmetrical adjustments occurred in the data series, the determination of the Heaviside indicator function might also be decided by the first difference value of the error correction term on period (
). Boucher (Citation2007) indicated that the speed of convergence of parameter estimation by using the M-TAR model would be faster than that of the TAR model. represents the results of our estimation of the threshold co-integration relationships between the U.S. stock market and the 23 stock markets in the three periods around the subprime crisis. The null hypothesis of no co-integration (
) and symmetric adjustment (
) was also shown in . In -(1), both
and
demonstrates the relationships of asymmetric co-integration between the U.S. stock market and the stock markets in India, France, Norway, Czech Republic, Hungary, Canada, and Mexico, in the period of pre-subprime crisis. In -(2), the
statistics reject the null hypothesis at the 1% significant level, and the
statistics rejecd the null at the 10% level in Section I during the subprime crisis—except in the Chinese stock market. Both
and
demonstrated the asymmetric co-integration relationships between the U.S. stock market and most of the 23 stock markets in Section I, during the subprime crisis—except in the Chinese stock market. In -(3), both
and
demonstrate the asymmetric co-integration relationships between the U.S. market, and most of all the stock markets—except the China stock market—in Section II of the period during the subprime crisis.
Table 8. Results of the Enders-Siklos test for threshold co-integration.
Finally, we investigated how the asymmetric adjustment and the smooth transition phenomenon influenced the transmission or contagion effect by applying the logistic smooth transition co-integration (LSTC) model to compare the transmission or contagion effect from the U.S. stock market to the 23 stock markets in the three periods of pre- and during the subprime crisis.
represents the results of the Enders-Siklos M-TAR co-integration test in the logistic smooth transition regressive (LSTR) framework and linearity test for the co-integration relationships between the U.S. stock market and the 23 stock markets in the three periods around the subprime crisis. The null hypothesis of no co-integration (:
) and linearity model (
:
) is shown in . In -(1), both
and
demonstrate the relationships of logistic smooth transition co-integration between the U.S. stock market and the stock markets in Hong Kong, India, Germany, France, Czech Republic, Hungary, Canada, and Mexico, in the period of pre-subprime crisis. In -(2), both
and
demonstrate the logistic smooth transition co-integration relationships between the U.S. stock market and most of all the stock markets in Section I of during the subprime crisis except the stock market in China . In -(3), both
and
demonstrate the logistic smooth transition co-integration relationships between the U.S. market and most of all the stock markets in our study except in China, in Section II of during the subprime crisis.
Table 9. Results of the logistic smooth transition co-integration test.
By comparing the statistics in and further, we find that the co-integration relationships had significantly increased after the shock of the subprime crisis, including Sections I and II of during the subprime crisis, between the U.S. market and most of the Asian, European, and American stock markets except the stock markets in China and Brazil in , and except the stock market in China in ; and there existed a trend of escalation in the
statistics from Section I to Section II. The results of both and show that there were ʽcontagionʼ or ʽtransmissionʼ effects between the U.S. market and most of the Asian, European, and American stock markets during the period of the subprime crisis, especially in Section II of the subprime crisis, which was after Lehman Brothers filed for bankruptcy on 15 September 2008. Dimitriou et al. (Citation2013) pointed out that contagion appeared after the Lehman Brothers’ collapse in almost all stock markets. Kenourgios and Dimitriou (Citation2015) also indicated that the Lehman Brothers’ collapse marked the start of the most contagious phase during the subprime crisis. However, there was only an ʽinterdependence effectʼ between the U.S. market and the stock markets in China and Brazil in , and between the U.S. market and the Chinese stock market in . Forbes and Rigobon (Citation2001) defined the contagion of the international stock markets as a significant increase in cross-market linkages or co-movement between one market and others after a shock or during a crisis, and our results supported the ʽcontagion effectʼ between the U.S. stock market and some of the stock markets in the surveyed countries in our study.
By comparing the statistics in -(1), 8-(2) and 8-(3) further, we found that the asymmetry in the co-integration relationships had also significantly increased during the period of the crisis, including Sections I and II, between the U.S. stock market and most of the 23 stock markets except in China, and there also existed a trend of escalation in the
statistics from Section I to Section II. The result shows that the subprime crisis induced the quick transmission of massive negative information among many stock markets, especially in Section II of the subprime crisis, which also showed that the event of Lehman Brothers’ filing for bankruptcy aggravated not only the subprime crisis but also the panic of the investors in the financial markets. All of these led to higher risk aversion for international investors.
The results of the statistics in were also similar to those in , which demonstrate that the co-integration relationships were asymmetric or non-linear, and the order of the ranks of the stock market co-integration relationship between the aforementioned stock markets and the U.S. stock market was also similar to that in . Moreover, by comparing the
statistics and the smooth parameter (
) in -(1), 9-(2) and 9-(3) further, we found that the transition speed of co-integration relationships between the difference regimes had also conspicuously increased during the period of the crisis between the U.S. stock market and most of the Asian, European, and American stock markets—except the stock market in China—especially in Section II of the subprime crisis. The results confirmed the conclusion in , which show that the subprime crisis (especially after the event of Lehman Brothers’ filing for bankruptcy) aggravated the panic of the investors to the negative information in the financial market, and induced the quick transmission of massive negative information among many stock markets. All of these also led to higher risk aversion for international investors.
According to the empirical results in and , the order of the ranks of the stock market co-integration relationship between the aforementioned stock markets and the U.S. stock market was as follows: the countries in Europe (the order of the ranks: France, the U.K., Germany, Belgium, Netherlands, Norway, Sweden, Poland, Hungary, Czech Republic, Russia and Turkey), the countries in north and south America (the order of the ranks: Canada, Mexico, Argentina, and Brazil), and the countries in Asia (the order of the ranks: Singapore, Japan, Hong Kong, Korea, Taiwan, India, and China).
This could be explained with the fact that the financial markets in western and northern European countries, and Canada, Singapore, Japan and Hong Kong, i.e., the mature capital markets, were relatively advanced markets and had more linkage with the U.S. financial and security markets, whereas the financial markets in Latin America and developing countries in Asia and eastern Europe were emerging markets and had less linkage with the U.S. financial markets.
The contagion effects on western and northern European and advanced Asian equity markets were stronger than those on the equity markets in Latin America, eastern Europe and developing countries in Asia. In the past, most of the financial crises originated from the countries, which were considered to be emerging markets with a lot of foreign debt, weak financial institutions, and unsound financial supervisory systems. The neighbouring countries were apt to be influenced because of their close geographical locations to the origin of a financial crisis. However, the subprime crisis was due to the huge losses of credit derivatives in the U.S. financial and securities markets. It originated from the most advanced country and no one expected this could happen. Surprisingly, the most severely influenced markets were not the neighbouring Latin American, eastern European and Asian emerging markets. Therefore, the extent of financial linkage with the U.S. market might be the explanatory factor of the strength of the contagion effect. Because many financial institutions and investors held a lot of subprime mortgage securities in the countries in western Europe, Canada, Singapore, Japan and Hong Kong, it was reasonable that the contagion effects were more significant in these markets than in the Latin American, eastern European and Asian emerging markets. In short, the origins and impact of the subprime crisis were different from those of the financial crises in emerging markets.
5. Conclusions
The crisis contagion theory states that exogenous shocks are transmitted to many countries through transmission mechanisms. This effect leads to co-movement of stock markets. Dornbusch et al. (Citation2000) and Forbes and Rigobon (Citation2001) pointed out that contagion effects exist when negative impacts occurred during the crisis.
Co-integration relationships between stock markets represent market co-movement or common trends, and co-integration analysis is widely used to investigate whether or not the long-term equilibrium relationship between stock markets is changed when a financial crisis happens. If the equilibrium relationship changes, the contagion effect occurs. However, the traditional symmetric co-integration analysis ignored the characteristics of asymmetric adjustment in stock markets (Li and Lam, Citation1995; Koutmos, Citation1998; Sarantis, Citation2001; Chiang, Citation2001). Therefore, we employed the Enders and Siklos (Citation2001) threshold co-integration framework, including the M-TAR model and the logistic smooth transition regressive (LSTR) method proposed by Granger and Teräsvirta (Citation1993) and Teräsvirta (1994, 1998), which was the expansion of the M-TAR model and allows asymmetric adjustments and smooth transitions, when analysing stock market relationships. We tested the asymmetric long-term equilibrium relationship between the U.S. stock market and 23 stock markets in Asia, Europe, and north and south America around the subprime crisis.
In this study, we anticipated contagion effects among international stock markets would lead to co-integration between the U.S. and Asian, European, and north and south American stock markets. However, the results of the Engle and Granger (Citation1987) co-integration test did not indicate co-integration relationships between the U.S. and these stock markets. These results were not consistent with the correlation analyses of returns and the volatility of returns, for the correlation coefficients of returns and the volatility of returns both increased. In addition, these results were different from previous empirical studies, and our assumption could not be verified by traditional co-integration methods. Furthermore, the test results of the Enders-Siklos threshold co-integration model and the logistic smooth transition co-integration model did indicate that co-integration relationships increased. Therefore, the models of threshold co-integration and logistic smooth transition co-integration were better methods to analyse dynamic stock market relationships.
There are several major findings in this study. First of all, the empirical results supported previous research. We found that the Enders-Siklos threshold co-integration relationships between the U.S. S&P 500 Index and most of the stock markets in Asia, Europe, and north and south America increased significantly—except the markets in China market Brazil, and the logistic smooth transition co-integration relationships between the U.S. stock market and most of all the stock markets in our study increased significantly—except the market in China—especially after Lehman Brothers (Dimitriou et al., Citation2013; Kenourgios and Dimitriou, Citation2015) filed for bankruptcy. However, in both models, the co-integration relationship did not exist between the U.S. market and Chinese market around the subprime crisis.
The information demonstrated that the subprime crisis in the U.S. had a contagion effect on international stock markets. When the adjustments of asymmetric and logistic smooth transition in stock markets were compared, the influence of good news (positive information) and bad news (negative information) in the U.S. market was significantly enhanced during the crisis (threshold co-integration and logistic smooth transition co-integration). Furthermore, the smooth parameter also significantly increased after the shock of the crisis, the results of which showed evidence that the homogeneity or non-heteroscedasticity of information transmission in international stock markets increased significantly during the period of the subprime crisis.10 It was more likely that the transmission of massive negative information resulted in higher risk aversion for international investors.
The second finding differed from previous literature. Previous works on financial crises revealed that most crises originated from emerging markets. (Aggarwal et al., Citation1999; Collins and Biekpe, Citation2003; Dungey et al., Citation2006). Neighbouring countries were easily affected because of their close geographical locations to the origin of the financial crisis. However, the subprime crisis was not from an emerging market. In addition, the contagion effect of the stock markets in Canada, western and northern European countries and developed countries in Asia, i.e., the mature capital markets, were more significant than that in developing countries in Asia, eastern European and Latin America. It was contrary to our assumption that Asian, eastern European and Latin American emerging markets would be affected more severely. The possible explanation was that the degree of financial linkage with the U.S. market contributed to the strength of the contagion effect. Since the relatively advanced stock markets in western and northern European countries and in the developed countries in Asia were globalised and deregulated markets, they were affected notably. Because the stock markets in developing countries in Asia, Eastern Europe and Latin America were less globalised and less deregulated, they were affected moderately. Unlike a financial crisis of an emerging market, the subprime crisis caused quite different contagion effects which were explored in this research.
Finally, the subprime crisis had weakened international portfolio diversification; therefore, international investors could not diversify their risks by investing in the Asian, European and American stock markets during the crisis. It is likely that if a world financial centre is in trouble, global investors will be unavoidably influenced.
We would like to discuss the research limitations and further possible research in this study, which were stated in the methodologies. Regarding the research limitations, the Enders and Siklos (Citation2001) asymmetric co-integration frameworks, including M-TAR and LSTC models, were employed to conduct the empirical works. Although the methodologies of this study could solve two problems—the ʽsymmetric adjustmentsʼ in the co-integration relationship in the traditional co-integration model and secondly the smooth transition of the transitional variables between two regimes, or heteroscedasticity in the information transmission in different markets—there still existed limitations in the methods for the contagion effect test in this study compared to other approaches proposed in recent years. This includes the AG-DCC GARCH models, the rolling window sub-sample Granger causality test and the dynamic copulas with and without regime-switching (Cappiello et al., Citation2006; Okimoto, Citation2008; Balcilar et al., Citation2010; Kenourgios et al., Citation2011), the measurement of volatility, the better fitting in an empirical model, the endogenous determination of a cutting point for crisis and non-crisis periods, and the length of a crisis period. Many studies employed the Markov regime switching model to endogenously identify the length of a crisis period (Boyer et al., Citation2006).
For further research—since there are limitations in the methods of this study compared to other advanced approaches—we look forward to conducting further empirical investigations by using more advanced methods, and we also look forward to providing substantial findings and contributions on economics and finances.
Disclosure statement
No potential conflict of interest was reported by the author(s).
Notes
1 A large-scale asset purchase (LSAP) program in the U.S. government’s QE policies, including the purchase of mortgage backed securities (MBS) and government sponsored enterprise (GSE) debts, was expanded to the U.S. Treasury bond markets afterwards. Moreover, the QE policy was divided into QE I (25 November 2008 to 31 March 2010), QE II (3 November 2010 to 30 June 2011), QE III (13 September 2012 to 18 December 2013) and QE IV (23 December 2013 to 29 October 2014) from 2008 to 2014. Source: The Federal Open Market Committee (FOMC). For a detailed review of the main steps of QE, please refer to Fawley and Neely (Citation2013).
2 Forbes and Rigobon (Citation2001) indicated that the loose financial regulatory systems, high financial deficits and government debts, insufficient foreign exchange, and unstable exchange rates in the emerging countries all contributed to the consequences of the financial crises in those countries.
3 In this study, the entire sample period was from 1 September 2005 to 31 March 2010, which included the period of QE I (2008/11/25–2010/3/31). The period of QE I was an early period of the QE policy. In the period of QE I, there were no significant effects yet from the QE policy to the U.S., Europe and global financial markets (Flavin and Sheenan, Citation2015; Lien et al., Citation2018; Mamaysky, Citation2018). Therefore, we believe that there existed very limited effects from the QE policy to the results in this study.
4 Enders and Granger (Citation1998) indicated that the M-TAR model was especially valuable when adjustment was asymmetric such that the series exhibited more ʽmomentumʼ in one direction than the other.
5 The threshold value was endogenously determined by using Chan’s (Citation1993) grid search method to find the consistent estimate of the threshold. This method arranged the values, { }, in an ascending order and excluded the smallest and largest 15 percent; and the consistent estimate of the threshold was the parameter that yielded the smallest residual of sum squares (RSS) over the remaining 70 percent.
6 The sample of the stock index in China was Shanghai Stock Exchange Composite Index (SSE Composite Index). Furthermore, there were restricted fluctuation ranges in the stock markets of Taiwan, Korea, China, Russia, and Hungary, which were 7% for Taiwan, 15% for Korea, 10% for China, 10%–20% for Russia, and 25% for Hungary, respectively. However, there were no such restrictions in the U.S., the U.K., Germany, Hong Kong and Singapore stock markets. In past literature, many scholars questioned whether the restrictions would affect researchers’ evaluation results. In our study, there were 14 days on which the TSEC Weighted Index exceeded the 7% limit, 16 days on which the KOSPI Composite Index exceeded the 15% limit, 11 days on which the SSE Composite Index exceeded the 10% limit, 13 days on which the MICEX Index exceeded the 20% limit, and 17 days on which the BUX Index exceeded the 25% limit in our research period, all of which accounted for less than 3% of the entire samples. Shen and Wang (Citation1998) indicated that when the samples with restricted ranges were less than 5% of the entire samples, their impact on the evaluation results could be considered insignificant. Furthermore, due to the fact that the restricted fluctuation ranges were aimed at individual stocks, the probability of the stock prices of those individual stocks rose and fell at the same time was very low on a trading day. Since the stock indices were adopted in this study, the influence from the restricted fluctuation ranges to our empirical results would not be significant. The EMU sovereign-debt crisis event first occurred in Greece in December, 2009, and it gradually spread to Ireland and some southern European countries, e.g., Portugal, Spain and Italy. In order to fully avoid the influence of the interference from the EMU sovereign-debt crisis to the empirical results in this study, we did not include the southern European equity markets in the discussions of the empirical works in our study.
7 NYSE and AMEX are the abbreviations of the New York Stock Exchange and the American Stock Exchange, respectively.
8 In order to avoid bias and non-consistency in the empirical results due to the sample numbers with huge differences around the subprime crisis and the influence of the interference from the EMU sovereign-debt crisis, the entire sample period was set from 1 September 2005 to 31 March 2010 in our study.
9 In both and in our study, the t statistics of correlation coefficients of returns and the volatility of returns between various periods were calculated by Fisher’s Z transformation
10 The statement that ʽThe homogeneity of information transmission in international stock markets increasedʼ implies that when the speed of information transmission increases among stock markets, the points of time that the investors receive the information will tend to be parallel.
References
- Abad, P., Chuliá, H., & Gómez-Puig, M. (2010). EMU and European government bond market integration. Journal of Banking & Finance, 34(12), 2851–2860. doi:10.1016/j.jbankfin.2009.10.009
- Afonso, A., Furceri, D., & Gomes, P. (2012). Sovereign credit ratings and financial markets linkages: Application to European data. Journal of International Money and Finance, 31(3), 606–638. doi:10.1016/j.jimonfin.2012.01.016
- Aggarwal, C., Inclan, C., & Leal, R. (1999). Volatility in emerging stock markets. The Journal of Financial and Quantitative Analysis, 34(1), 33–55. doi:10.2307/2676245
- Aloui, R., Aïssa, M. S. B., & Nguyen, D. K. (2011). Global financial crisis, extreme interdependences, and contagion effects: The role of economic structure? Journal of Banking & Finance, 35(1), 130–141. doi:10.1016/j.jbankfin.2010.07.021
- Arouria, M. E. H., Bellalahb, M., & Nguyenc, D. K. (2009). The comovements in international stock markets: New evidence from Latin American emerging countries. Applied Economics Letters, 18, 1–6. doi:10.1080/13504850902967449
- Arshanapalli, B., & Doukas, J. (1993). International stock market linkages: Evidence from the pre- and post-October 1987 period. Journal of Banking & Finance, 17(1), 193–208. doi:10.1016/0378-4266(93)90088-U
- Balcilar, M., Ozdemir, Z. A., & Arslanturk, Y. (2010). Economic growth and energy consumption causal nexus viewed through a bootstrap rolling window. Energy Economics, 32(6), 1398–1410. doi:10.1016/j.eneco.2010.05.015
- Bannigidadmath, D., & Narayan, P. K. (2016). Stock return predictability and determinants of predictability and profits. Emerging Markets Review, 26, 153–173. doi:10.1016/j.ememar.2015.12.003
- Barassi, M. R., Caporale, G. M., & Hall, S. G. (2005). Interest rate linkages: A Kalman filter approach to detecting structural change. Economic Modelling, 22(2), 253–284. doi:10.1016/j.econmod.2003.12.005
- Bekaert, G., Ehrmann, M., Fratzscher, M., & Mehl, A. (2014). Global crises and equity market contagion. The Journal of Finance, 69(6), 2597–2649. doi:10.1111/jofi.12203
- Bekaert, G., Harvey, C. R., & Ng, A. (2005). Market integration and contagion. The Journal of Business, 78(1), 39–69. doi:10.1086/426519
- Boucher, C. (2007). Asymmetric adjustment of stock prices to their fundamental value and the predictability of US stock returns. Economics Letters, 95(3), 339–347. doi:10.1016/j.econlet.2006.11.004
- Boyer, B. H., Kumagai, T., & Yuan, K. (2006). How do crises spread? Evidence from accessible and inaccessible stock indices. The Journal of Finance, 61(2), 957–1003. doi:10.1111/j.1540-6261.2006.00860.x
- Caporale, G. M., Cipollini, A., & Spagnolo, N. (2005). Testing for contagion: A conditional correlation analysis. Journal of Empirical Finance, 12(3), 476–489. doi:10.1016/j.jempfin.2004.02.005
- Cappiello, L., Engle, R. H., & Sheppard, K. (2006). Asymmetric dynamics in the correlations of global equity and bond returns. Journal of Financial Econometrics, 4(4), 537–572. doi:10.1093/jjfinec/nbl005
- Caramazza, F., Ricci, L., & Salgado, R. (2004). International financial contagion in currency crises. Journal of International Money and Finance, 23(1), 51–70. doi:10.1016/j.jimonfin.2003.10.001
- Cha, B., & Oh, S. (2000). The relationship between developed equity markets and the Pacific Basin's Emerging equity markets. International Review of Economics & Finance, 9(4), 299–322. doi:10.1016/S1059-0560(00)00057-5
- Chan, K. S. (1993). Consistency and limiting distribution of the least squares estimator of a threshold autoregressive model. The Annals of Statistics, 21(1), 520–533. doi:10.1214/aos/1176349040
- Chang, S. (2008). Asymmetric cointegration Relationship among Asian Exchange Rates. Economic Change and Restructuring, 41, (2), 125–141. doi:10.1007/s10644-008-9044-6
- Chang, S. (2010). Effects of asymmetric adjustment among labor productivity, labor demand, and exchange rate using threshold cointegration test. Emerging Markets Finance and Trade, 46(6), 55–68. doi:10.2753/REE1540-496X460604
- Chen, G. M., Firth, M., & Rui, O. M. (2002). Stock market linkages: Evidence from Latin America. Journal of Banking & Finance, 26(6), 1113–1141. doi:10.1016/S0378-4266(01)00160-1
- Chiang, M. H. (2001). The asymmetric behavior and spillover effects on stock index returns: Evidence on Hong Kong and China. Pan Pacific Management Review, 4, 1–21.
- Cho, D., & Rhee, C. (2014). Effects of quantitative easing on Asia: Capital flows and financial markets. The Singapore Economic Review, 59(03), 1450018–1450023. doi:10.1142/S0217590814500180
- Chouliaras, A., Christopoulos, A., Kenourgios, D., & Kalantonis, P. (2012). The PIIGS stock markets before and after the 2008 financial crisis: A dynamic cointegration and causality analysis. International Journal of Banking, Accounting and Finance, 4, (3), 232–249. doi:10.1504/IJBAAF.2012.051612
- Christensen, J. H., & Rudebusch, G. D. (2012). The response of interest rates to US and UK quantitative easing. The Economic Journal, 122(564), F385–414. doi:10.1111/j.1468-0297.2012.02554.x
- Claessens, S., Ariccia, G. D., Igan, D., & Laeven, L. (2010). Cross-country experiences and policy implications from the global financial crisis. Economic Policy, 25(62), 267–293. doi:10.1111/j.1468-0327.2010.00244.x
- Collins, D., & Biekpe, N. (2003). Contagion: A fear for African equity markets? Journal of Economics and Business, 55(3), 285–297. doi:10.1016/S0148-6195(03)00020-1
- D’Amico, S., & King, T. B. (2013). Flow and stock effects of large-scale treasury purchases: Evidence on the importance of local supply. Journal of Financial Economics, 108, 425–448. doi:10.1016/j.jfineco.2012.11.007
- Dimitriou, D., Kenourgios, D., & Simos, T. (2013). Global financial crisis and emerging stock market contagion: A multivariate FIAPARCH-DCC approach. International Review of Financial Analysis, 30, 46–56. doi:10.1016/j.irfa.2013.05.008
- Dornbusch, R., Park, Y. C., & Claessens, S. (2000). Contagion: Understanding how it spreads. The World Bank Research Observer, 15(2), 177–197. doi:10.1093/wbro/15.2.177
- Dumontaux, N., & Pop, A. (2013). Understanding the market reaction to shockwaves: Evidence from the failure of Lehman Brothers. Journal of Financial Stability, 9, (3), 269–286. doi:10.1016/j.jfs.2013.04.001
- Dungey, M., Fry, R., González-Hermosillo, B., & Martin, V. (2006).Contagion in international bond markets during the Russian and the LTCM crises. Journal of Financial Stability, 2, (1), 1–27. doi:10.1016/j.jfs.2005.01.001
- Edwards, S. (1998).Interest rate volatility, contagion and convergence: An empirical investigation of the cases of Argentina, Chile and Mexico. Journal of Applied Economics, 1, (1), 55–86. doi:10.1080/15140326.1998.12040517
- Edwards, S. (2000). Contagion. The World Economy, 23(7), 873–900. doi:10.1111/1467-9701.00307
- Edwards, S., & Susmel, R. (2001). Volatility dependence and contagion in emerging equity markets. Journal of Development Economics, 66(2), 505–532. doi:10.1016/S0304-3878(01)00172-9
- Enders, W., & Granger, C. W. J. (1998). Unit-root tests and asymmetric adjustment with an example using the term structure of interest rates. Journal of Business & Economic Statistics, 16, 304–311. doi:10.1080/07350015.1998.10524769
- Enders, W., & Siklos, P. L. (2001). Cointegration and threshold adjustment. Journal of Business & Economic Statistics, 29, 166–176. doi:10.1198/073500101316970395
- Engle, R., & Granger, C. W. J. (1987). Cointegration and error correction: Representation, estimation, and testing. Econometrica, 55(2), 251–276. doi:10.2307/1913236
- Engle, R., & Yoo, S. (1987). Forecasting and testing in co-integration systems. Journal of Econometrics, 35(1), 143–159. doi:10.1016/0304-4076(87)90085-6
- Eun, C. S., & Shim, S. (1989). International transmission of stock market movements. The Journal of Financial and Quantitative Analysis, 24(2), 241–256. doi:10.2307/2330774
- Fawley, B. W., & Neely, C. J. (2013). Four stories of quantitative easing. Federal Reserve Bank of St. Louis Review, 95, 51–88. doi:10.20955/r.95.51-88
- Flavin, T. J., & Sheenan, L. (2015). The role of U.S. subprime mortgage-backed assets in propagating the crisis: Contagion or interdependence? The North American Journal of Economics and Finance, 34, 167–186. doi:10.1016/j.najef.2015.09.001
- Forbes, K. (2004). The Asian flu and the Russian virus: Firm level evidence on how crises are transmitted internationally. Journal of International Economics, 63(1), 59–92. doi:10.1016/S0022-1996(03)00044-8
- Forbes, K., & Rigobon, R. (2001). Measuring contagion: Conceptual and empirical issues. In S. Claessens, & K. J. Forbes (eds.), International Financial Contagion. Norwell, MA: Kluwer Academic Publishers.
- Forbes, K., & Rigobon, R. (2002). No contagion, only interdependence: Measuring stock market comovements. The Journal of Finance, 57(5), 2223–2261. doi:10.1111/0022-1082.00494
- Frankel, J. A., & Saravelos, G. (2012). Can leading indicators assess country vulnerability? Evidence from the 2008-09 Global Financial Crisis. Journal of International Economics, 87(2), 216–231. doi:10.1016/j.jinteco.2011.12.009
- Gilmore, C. G., Lucey, B., & McManus, G. M. (2008). The dynamics of central European equity market co-movements. The Quarterly Review of Economics and Finance, 48(3), 605–622. doi:10.1016/j.qref.2006.06.005
- Gorton, G. B. (2009). The subprime panic. European Financial Management, 15(1), 10–46. doi:10.1111/j.1468-036X.2008.00473.x
- Granger, C. W. J., & Teräsvirta, T. (1993). Modelling nonlinear economic relationships. Oxford University Press.
- Guidi, F., & Ugur, M. (2013). Are South East Europe stock markets integrated with regional and global stock markets? SSRN Electronic Journal.
- Guidolin, M., Orlov, A. G., & Pedio, M. (2014). Unconventional monetary policies and the corporate bond market. Finance Research Letters, 11(3), 203–212. doi:10.1016/j.frl.2014.04.003
- Hamao, Y., Masulis, R. W., & Ng, V. (1990). Correlations in price changes and volatility across international stock markets. The Review of Financial Studies, 3(2), 281–307. doi:10.1093/rfs/3.2.281
- Hamilton, J. D., & Wu, J. C. (2012). The effectiveness of alternative monetary policy tools in a zero lower bound environment. Journal of Money, Credit and Banking, 44, 3–46. doi:10.1111/j.1538-4616.2011.00477.x
- Hui, C. H., & Chung, T. K. (2011). Crash risk of the euro in the sovereign debt crisis of 2009-2010. Journal of Banking & Finance, 35(11), 2945–2955. doi:10.1016/j.jbankfin.2011.03.020
- Iyer, R., & Peydró, J. L. (2011). Interbank contagion at work: Evidence from a natural experiment. Review of Financial Studies, 24(4), 1337–1377. doi:10.1093/rfs/hhp105
- Jarrow, R., & Li, H. (2014). The impact of quantitative easing on the US term structure of interest rates. Review of Derivatives Research, 17(3), 287–321. doi:10.1007/s11147-014-9099-7
- Jiang, Y., Yu, M., & Hashmi, S. M. (2017). The financial crisis and co-movement of global stock markets—A case of six major economies. Sustainability, 9(2), 260–278. doi:10.3390/su9020260
- Johansson, A. C. (2008). Interdependencies among Asian bond markets. Journal of Asian Economics, 19(2), 101–116. doi:10.1016/j.asieco.2007.12.015
- Jondeau, E., & Rockinger, M. (2006). The Copula-Garch model of conditional dependencies: An international stock market application. Journal of International Money and Finance, 25(5), 827–853. doi:10.1016/j.jimonfin.2006.04.007
- Kaminsky, G. L., Reinhart, C. M., & Vegh, C. A. (2003). The unholy of financial contagion. Journal of Economic Perspectives, 17(4), 51–74. doi:10.1257/089533003772034899
- Kapetanios, G., Shin, Y., & Snell, A. (2003). Testing for a unit root in the nonlinear STAR framework. Journal of Econometrics, 112(2), 359–379. doi:10.1016/S0304-4076(02)00202-6
- Kaufman, G. G. (2000). Banking and currency crises and systemic risk: A taxonomy and review. Financial Markets, Institutions and Instruments, 9, (2), 69–131. doi:10.1111/1468-0416.00036
- Kenourgios, D. (2014). On financial contagion and implied market volatility. International Review of Financial Analysis, 34, 21–30. doi:10.1016/j.irfa.2014.05.001
- Kenourgios, D., Christopoulos, A., & Dimitriou, D. (2013). Asset markets contagion during the global financial crisis. Multinational Finance Journal, 17(1/2), 49–76. doi:10.17578/17-1/2-2
- Kenourgios, D., & Dimitriou, D. (2015). Contagion of the global financial crisis and the real economy: A regional analysis. Economic Modelling, 44, 283–293. doi:10.1016/j.econmod.2014.10.048
- Kenourgios, D., & Padhi, P. (2012). Emerging markets and financial crises: Regional, global or isolated shocks?. Journal of Multinational Financial Management, 22(1–2), 24–38. doi:10.1016/j.mulfin.2012.01.002
- Kenourgios, D., Samitas, A., & Paltalidis, N. (2011). Financial crises and stock market contagion in a multivariate time-varying asymmetric framework. Journal of International Financial Markets, Institutions and Money, 21(1), 92–106. doi:10.1016/j.intfin.2010.08.005
- Kiley, M. T. (2014). The response of equity prices to movements in long-term interest rates associated with monetary policy statements: Before and after the zero lower bound. Journal of Money, Credit and Banking, 46(5), 1057–1071. doi:10.1111/jmcb.12129
- King, M. A., & Wadhwani, S. (1990). Transmission of volatility between stock markets. Review of Financial Studies, 3, (1), 5–33. doi:10.1093/rfs/3.1.5
- Kizys, R., & Pierdzioch, C. (2011). The financial crisis and the stock markets of the CEE countries. Czech Journal of Economics and Finance, 61, 153–172.
- Koutmos, G. (1998). Asymmetries in the conditional mean and the conditional variance: Evidence from nine stock markets. Journal of Economics and Business, 50(3), 277–290. doi:10.1016/S0148-6195(98)00004-6
- Krishnamurthy, A., Vissing-Jorgensen, A., Gilchrist, S., & Philippon, T. (2011). The effects of quantitative easing on interest rates: Channels and implications for policy. Brookings Papers on Economic Activity, 11, 215–287. doi:10.1353/eca.2011.0019
- Kwiatkowski, D., Phillips, P. C. B., Schmidt, P., & Shin, Y. (1992). Testing the null hypothesis of stationarity against the alternative of a unit root: How sure are we that economic time series have a unit root?. Journal of Econometrics, 54(1–3), 159–178. doi:10.1016/0304-4076(92)90104-Y
- Lee, S. B., & Kim, K. J. (1993). Does the October 1987 crash strengthen the co-movements among national stock markets?. Review of Financial Economics, 3(1), 89–102. doi:10.1002/j.1873-5924.1993.tb00574.x
- Li, W. K., & Lam, K. (1995). Modelling asymmetry in stock returns by a threshold autoregressive conditional heteroscedastic model. The Statistician, 44(3), 333–341. doi:10.2307/2348704
- Lien, D., Lee, G., Yang, L., & Zhang, Y. (2018). Volatility spillovers among the U.S. and Asian stock markets: A comparison between the periods of Asian currency crisis and subprime credit crisis. The North American Journal of Economics and Finance, 46, 187. doi:10.1016/j.najef.2018.04.006
- Liu, Y. A., Pan, M., & Shieh, J. (1998). International transmission of stock price movements:Evidence from the U.S. and five Asian-Pacific markets. Journal of Economics and Finance, 22(1), 59–69. doi:10.1007/BF02823233
- Longstaff, F. A. (2010). The subprime credit crisis and contagion in financial markets. Journal of Financial Economics, 97(3), 436–450. doi:10.1016/j.jfineco.2010.01.002
- Lucey, M. B., & Voronkova, S. (2008). Russian equity market linkages before and after the 1998 crisis: Evidence from stochastic and regime-switching cointegration tests. Journal of International Money and Finance, 27(8), 1303–1324. doi:10.1016/j.jimonfin.2008.07.004
- Luchtenberg, K. F., & Quang, V. V. (2015). The 2008 financial crisis: Stock market contagion and its determinants. Research in International Business and Finance, 33, 178–203. doi:10.1016/j.ribaf.2014.09.007
- Luukkonen, R., Saikkonen, P., & Teräsvirta, T. (1988). Testing linearity against smooth transition autoregressive models. Biometrika, 75(3), 491–499. doi:10.1093/biomet/75.3.491
- Mamaysky, H. (2018). The time horizon of price responses to quantitative easing. Journal of Banking & Finance, 90, 32–49. doi:10.1016/j.jbankfin.2018.02.016
- Matthijs, M. (2014). Mediterranean Blues: The Crisis in Southern Europe. Journal of Democracy, 25(1), 101–115. doi:10.1353/jod.2014.0002
- Neely, C. J. (2010). The large scale asset purchases had large international effects (Working Paper Series No. 2010-018D). USA: Federal Reserve Bank of St. Louis, Research Division.
- Nieh, C. C., Kao, Y. S., & Yang, C. H. (2011). The asymmetric contagion from the U.S. stock market around the subprime crisis. In Studies on Financial Markets in East Asia (Chapter 2, pp. 19–39). Fukuoka, Japan: Kyushu University Press.
- Nieh, C. C., Yang, C. H., & Kao, Y. S. (2012). Who has more influence on Asian Stock Markets around the Subprime Mortgage Crisis-the U.S. or China? Applied Economics Letters, 19(4), 329–335. doi:10.1080/13504851.2011.577001
- Okimoto, T. (2008). New evidence of asymmetric dependence structures in international equity markets. Journal of Financial and Quantitative Analysis, 43(3), 787–815. doi:10.1017/S0022109000004294
- Osińska, M., Dobrzyński, A., & Shachmurove, Y. (2016). Performance of American and Russian Joint Stock Companies on financial market. A microstructure perspective. Equilibrium, 11, 819–851. doi:10.12775/EQUIL.2016.037
- Phillips, P. C. B., & Perron, P. (1988). Testing for a unit root in time series regression. Biometrika, 75(2), 335–346. doi:10.1093/biomet/75.2.335
- Said, S., & Dickey, D. (1984). Testing for unit roots in autoregressive-moving average model of unknown order. Biometrika, 71(3), 599–607. doi:10.1093/biomet/71.3.599
- Samarakoon, L. P. (2011). Stock market interdependence, contagion, and the U.S. financial crisis: The case of emerging and frontier markets. Journal of International Financial Markets, Institutions and Money, 21(5), 724–742. doi:10.1016/j.intfin.2011.05.001
- Sarantis, N. (2001). Nonlinearities, cyclical behaviour and predictability in stock markets: International evidence. International Journal of Forecasting, 17(3), 459–482. doi:10.1016/S0169-2070(01)00093-0
- Shen, C. H., Chen, C., & Chen, L. (2007). An empirical study of the asymmetric cointegration relationships among the Chinese Stock Markets. Applied Economics, 39(11), 1433–1445. doi:10.1080/00036840600606302
- Shen, C. H., & Wang, L. R. (1998). Daily serial correlation, trading volume, and price limit. Pacific-Basin Finance Journal, 6(3–4), 251–274. doi:10.1016/S0927-538X(98)00011-0
- Sheng, H. C., & Tu, A. H. (2000). A study of cointegration and variance decomposition among equity indices before and during the period of the asian financial crisis. Journal of Multinational Financial Management, 10(3–4), 345–365. doi:10.1016/S1042-444X(00)00034-7
- Sikka, P., Filling, S., & Liew, P. (2009). The audit crunch: Reforming auditing. Managerial Auditing Journal, 24(2), 135–155. doi:10.1108/02686900910924554
- Skintzi, V., & Refenes, A. (2006). Bond volatility spillovers and dynamic correlation in European bond markets. Journal of International Financial Markets, Institutions and Money, 16(1), 23–40. doi:10.1016/j.intfin.2004.12.003
- Sobreira, R. (2011). The Brazilian experience on prudential regulation and its impacts on the 2008 financial crisis. Revista de Economia Política, 31(5), 893–902. doi:10.1590/S0101-31572011000500021
- Song, Z., & Zhu, H. (2018). Quantitative easing auctions of Treasury bonds. Journal of Financial Economics, 128(1), 103–124. doi:10.1016/j.jfineco.2018.02.004
- Swan, P. L. (2009). The political economy of the subprime crisis: Why subprime was so attractive to its creators. European Journal of Political Economy, 25(1), 124–132. doi:10.1016/j.ejpoleco.2008.12.005
- Syriopoulos, T. (2007). Dynamic linkages between emerging European and developed stock markets: Has the EMU any impact? International Review of Financial Analysis, 16(1), 41–60. doi:10.1016/j.irfa.2005.02.003
- Teräsvirta, T. (1994). Specification, estimation and evaluation of smooth transition autoregressive models. Journal of the American Statistical Association, 89, 208–218. doi:10.1080/01621459.1994.10476462
- Teräsvirta, T. (1998). Modelling economic relationships with smooth transition regressions. In A. Ullah & D. E. A. Giles (Eds.), Handbook of applied economic statistics (pp. 507–552). New York: Marcel Dekker.
- Thalassinos, E., Pintea, M., & Iulia, R. P. (2015). The recent financial crisis and its impact on the performance indicators of selected countries during the crisis period: A reply. International Journal in Economics and Business Administration, 3, 3–20.
- Wang, C., & Lin, C. A. (2005). Using threshold cointegration to examine asymmetric price adjustments between ADR's and their underlying securities-The case of Taiwan. The South African Journal of Economics, 73(3), 449–461. doi:10.1111/j.1813-6982.2005.00030.x
- Wang, Z., Yang, J., & Li, Q. (2007). Interest rate linkages in the Eurocurrency market: Contemporaneous and out-of-sample Granger causality tests. Journal of International Money and Finance, 26(1), 86–103. doi:10.1016/j.jimonfin.2006.10.005
- Wong, J. C. (2000). “Are changes in spreads of external-market debt also induced by contagion?”. Intereconomics, 35, 72–80. doi:10.1007/BF02930130
- Woodward, G., & Marisetty, V. B. (2005). Introducing non-linear dynamics to the two-regime market model: Evidence. The Quarterly Review of Economics and Finance, 45(4-5), 559–581. doi:10.1016/j.qref.2005.04.001 [Inserted From Online]