
 ?Mathematical formulae have been encoded as MathML and are displayed in this HTML version using MathJax in order to improve their display. Uncheck the box to turn MathJax off. This feature requires Javascript. Click on a formula to zoom.
Abstract
Insurance profits in non-life insurance markets display a large fluctuation that may make it hard for insurance companies to control their operating volatility. By taking into account asymmetries in dynamics of insurance profits, this paper provides empirical evidence of the visualised cycles in insurance markets and relevant underwriting strategies of insurance companies. The results hint at the possible existence of overconfidence in underwriting activities when the underwriting result turns bad. Compared with the whole insurance industry, insurance companies engage more speculative behaviour in underwriting activities on the general liability insurance. For regulation purposes, the government should maintain more disciplined underwriting policies of insurance companies in different insurance lines in order to avoid irrational pricing strategies and improve the economic efficiency of insurance supply.
1. Introduction
The dynamics of insurance profits in non-life insurance markets has long been known by insurance practitioners and academics as the underwriting cycle in which a so-called hard and soft markets follow each other. In a period of soft market, a relaxed underwriting policy makes insurance coverage readily available and insurance profits fall, whereas in the subsequent hard market the underwriting policy is tightened, which causes difficulty in obtaining coverage and increasing insurance profits. According to the Barron’s Dictionary of Insurance Terms (Rubin, Citation2008), ‘underwriting cycle’ is defined as ‘a tendency of property and liability insurance premiums, insurers’ profits, and availability of coverage to rise and fall with some regularity over time’. Such uncontrollable cycles have a crucial impact on insurance operations, which results in unpredictable earnings streams for insurance companies and unsatisfactory performance for their investors. The pricing decisions of actuaries and underwriters in insurance companies are forced to respond to such market cycles. In particular, soft markets might contribute to insolvency problems if insurance companies underwrite too aggressively, whereas hard markets might disrupt the distribution of insurance products due to stringent underwriting policies. Not only primary insurance markets, but also worldwide reinsurance markets are subject to price and the availability cycle (Cummins, Citation2005; Cummins & Weiss, Citation2009). In practice, regulators and practitioners have to contend with a major unknown: the timing and magnitude of the next hard/soft markets. Without clear and regular cycle patterns, it is more difficult for insurance companies to process their pricing and reserving functions. Modelling or predicting such fluctuations, which may help insurance companies to control their operating volatility, has traditionally been viewed as the greatest challenge for executives and practitioners (Lloyds, Citation2007).
There is much debate as to the behaviour of insurance companies dealing with whether they are rational or not. In a perfect market with rational expectations, insurance pricing reflects only the discounted value of future cash flow associated with losses and relevant expenses. Such a view assumes insurance companies are risk neutral and capital markets are perfect, which means that insurance companies could adjust their surplus quickly to eliminate their insolvency risk. Accordingly, any unexpected changes in interest rates may cause the fluctuation of underwriting profits. However, there is no proof that interest rates themselves display a cyclical behaviour, thus a pure rational expectation framework may not be adequate for explaining such wide and puzzling swings in insurance markets. An adjusted version, the rational expectations/institutional intervention hypothesis (Cummins & Outreville, Citation1987), attributes such cyclical patterns to institutional lags of the insurance industry, such as data collection lags, regulatory lags and financial reporting lags. For instance, the prior approval rating system that requires insurance companies to file beforehand for rate changes creates an increased variability in underwriting profits by delaying the rapid adjustment of prices to new information, thus rational acts of insurance companies may look as if they are irrational. Accordingly, the underwriting cycle is considered as endogenous and a second-order autoregressive process with the cyclical assumptions1 is utilised extensively to model the dynamics of insurance profits. However, recent studies show that there is really no statistical basis to support such a second-order autoregressive type of underwriting cycle in the insurance industry (e.g., Boyer, Jacquier, & Norden, Citation2012). Therefore, the presence of cycles in insurance markets remains an open question.
Another famous school of thought is relevant to industry capacity. Capacity generally refers to the degree that the whole industry provides insurance coverage without increasing the level of insolvency risk. Berger (Citation1988) mentions that an insurance company is assumed to set its underwriting policy and insurance price for the upcoming year on the basis of current capacity. The capacity constraint hypothesis (Winter, Citation1994) emphasises a special feature of the above theory. It suggests that insurance companies could not immediately freely restore capacity from costly external capital when their surplus is reduced by unpredictable shocks. The underwriting cycle is attributable to temporary market imperfections, which means that raising insurance profits becomes a way of adjusting capacity after a reduction in surplus due to unexpected loss, such as industry-wide catastrophes, unanticipated changes in liability rules or shortfall in investment returns. For instance, prominent hard markets were triggered by Hurricane Andrew in 1992 and the World Trade Center terrorist attack in 2001 (Cummins, Citation2007). Apparently, the capacity constraint hypothesis focuses mainly on the hard market, which is triggered by external negative shocks to capacity. On the other hand, the insurance price in soft markets should be equal to those implied by the perfect markets model because of the slack capacity during that period. Empirical evidence on the capacity constraint hypothesis, however, is somewhat mixed and inconclusive, especially for general liability insurance (e.g., Cummins & Danzon, Citation1997; Gron, Citation1994). Some aberrant behaviour of insurance companies has also been evidenced during soft markets, which is beyond expectations (e.g., Harrington, Danzon, & Epstein, Citation2008). In fact, there are still many mysteries about insurance cycles that deserve attention, both theoretically and empirically (Weiss, Citation2007).
From practitioners’ view, in order to fulfil company objectives, insurance companies formulate their underwriting policy to decide insurance price, quantity of supply and standards of risk selections for the upcoming year according to relevant factors such as their past loss experience, regulations and current capacity. The greater the industry capacity means the greater the ability of insurance companies to write business. That underwriting policy may vary each year results in insurance profits (i.e., loss ratios or combined ratios) moving in cyclical patterns, or spikes and crashes in insurance markets. However, the insurance supply can change quickly and drastically, and is as psychological as it is financial (Stewart, Citation1984). Practitioners tend to explain such variations of the underwriting policy by extensively competitive forces, that is, in order to gain or maintain markets shares, some companies will engage in irrational behaviour to offer more insurance at prices far below expectations. Owing to intensive competition, many companies will follow this behaviour until a correction occurs in the whole industry. They then over-reduce supply and increase price, waiting for the next round of destructive competition to arrive. Based on this narrative, Feldblum (Citation2007) concludes that the market structure of insurance is always in a state of perpetual disequilibrium with continuing price oscillations. Tetin (Citation2016) also noted that shifts in loss ratios are caused by dynamics of competition in the insurance market. Ligon and Thistle (Citation2007) also suggest that insurance profits change should be asymmetrical and displayed as a cycle.
A considerable number of empirical studies have been carried out on this context for more than two decades. Most studies have focused on short-term determination of insurance profits by using conventional regressions; relatively fewer articles have used cointegration analysis to find out the long-term determination (e.g., Haley, Citation1993). A major reason why the equilibrium relationship is difficult to reveal might be that the time series characteristic of insurance profits, measured by combined ratio or loss ratio, is still not totally revealed. Insurance profits might be demonstrated as stationary (e.g., Choi, Hardigree, & Thistle, Citation2002; Harrington & Yu, Citation2003), while relevant regressors, such as interest rate, might be treated as non-stationary. Cointegration is constrained to being conducted under Johansen’s VECM framework, which requires underlying variables to be integrated of the same order. If insurance profits were stationary, inclusion of any non-stationary regressors would make the cointegration analysis inappropriate. By contrast, Haley (Citation2007) points out that finding a unit root is a sufficient but not necessary condition while evaluating the dynamics of insurance profits. He also argues that controlling for a time trend when conducting unit root test may not be appropriate. Without the necessity for testing unit roots, Jiang and Nieh (Citation2012) provide evidence of the level relationship between interest rate, industry capacity and insurance profits in the U.S. insurance market at the whole industry level. In sum, empirical results of previous studies imply that in order to understand more underwriting activities of insurance companies, efforts have to be made to develop a robust empirical model without requiring firm knowledge of the time series characteristics of underlying variables. This paper tries to fill this gap using recent advances in the field of time series modelling.
Compared with the existing literature, this study extends previous research and contributes to the literature in several ways. First, by utilising more robust methodologies, the arguments of stationary features of insurance profits (e.g., Haley, Citation2007; Harrington & Yu, Citation2003) could be avoided without examining whether underlying variables possess unit roots. Results of this study show that there are two different regimes to portray underwriting activities, which reflect different beliefs of insurance companies during different periods. A visible cyclical pattern of insurance profits could be explained as a feedback tendency to the equilibrium, rather than modelling as an AR(2) process with cyclical assumptions. Second, the data-generating process of methodologies utilised in this study, the bounds testing procedure (Pesaran, Shin, & Smith, Citation2001) and the ADL test for threshold cointegration (Li & Lee, Citation2010) are both based on a single-equation autoregressive process and could provide both short- and long-term implications of insurance profits simultaneously. These types of cointegration test are referred to as ADL tests (Ericsson & Mackinnon, Citation2002), which differ from the existing tests using the Engle and Granger (Citation1987) type testing regression or the error correction model. An ADL test does not test the significance of the coefficient of the cointegrating vector and cointegrating residuals, and could provide more robust results (see Rao, Citation2007, for a review). Moreover, families of the autoregressive process are traditionally constructed to portray the dynamics of underwriting profits,2 thus are indeed appropriate in this context. Third, we do not use pre-specified periods of hard/soft markets but employ the percentile of error corrections to indicate alternative regimes, which makes our argument more robust. This study shows that as the underwriting result turns worse, far from expectations, the underwriting policy becomes more aggressive on risk taking for the next period. Finally, the results allow us to investigate the slowness of the adjustment process by accounting for the potential aforementioned non-linearities. The standard cointegration models may be poor for accounting for the full dynamics of the adjustment process of underwriting profits since they implicitly assume that: (i) the adjustment speed towards equilibrium is both continuous and constant, regardless of the extent of the real misalignment; and (ii) any deviation from the equilibrium level is temporary to ensure quickly mean-reverting dynamics. In our context, the fact that underwriting profits spend long periods away from their equilibrium could be explained by non-linearities due to heterogeneity information across insurance companies (Ligon & Thistle, Citation2007), or by whether their capacity is restricted or not (Higgins & Thistle, Citation2000). To the best of our knowledge, this paper is the first attempt to adopt asymmetrical threshold cointegration techniques to provide empirical evidence about the underwriting strategy of insurance companies.
2. Data
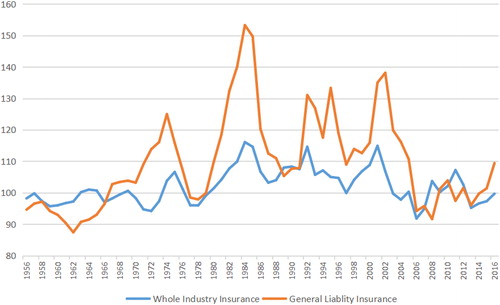
In this article, the loss ratio and the combined ratio are utilised as measures of non-life insurance underwriting profits of a given year.3 Both are practically and traditionally employed as profit measures for evaluating purposes in the insurance industry. This article applies annual U.S. insurance industry data during the period 1956–2016 from Best’s Aggregates and Averages, published by A.M. Best Company. Specifically, this article investigates not only the whole non-life insurance industry (all lines combined), but also general liability insurance,4 which is traditionally considered as a ‘long-tail’ business. The ‘tail’ of an insurance line means the time between the accident event and actual compensation pay-off. The general liability insurance, which can extend over several years to the settlement, is conventionally viewed as risky lines that increase the risk of large errors in forecasting ultimate claims both in payment time and dollar amount. Since the general liability insurance has a larger proportion of claims outstanding, it should be the most capacity-affected line during the financial crisis, and be more sensitive to fluctuations in interest rates because they have much more time to be invested. is a plot of both times series of the U.S. insurance industry-wide combined ratios. As displayed in , they may exhibit similar fluctuating behaviour but not necessarily to the same degree. Not really a regular cycle with a predictable pattern, they seem to be a result of a dynamic system with slow adjustment and possibly inadequate damping. There seem to be some non-linear or asymmetric adjustment patterns exhibited in the figure. Moreover, the general liability insurance line shows an extremely large cycle of combined ratio during the 1980s, the well-known liability crisis in the U.S., with unavailability and unaffordability of liability insurance that caused many failures of institutions. It is the most famous example of a ‘hard market’ or ‘insurance crisis’ in the history of insurance in the U.S.
Figure 1. The U.S. insurance industry-wide combined ratios. Source: Best’s Aggregates and Averages, published by A. M. Best Company.
Traditionally, industry capacity is defined as the amount of business insurance industry is able to write and is based on insurance companies’ written premiums to their surplus (Webb, Harrison, & Markham, Citation2002). Surplus provides a cushion for unexpected, negative claims outcomes if insurance companies do not have sufficient funds to pay claims. This article utilises industry capacity as the ratio of lagged aggregate policyholders’ surplus to lagged net written premiums. Such a ratio is the inverse version of the well-known Kenney ratio, which is traditionally used as a rule-of-thumb measure for evaluation purposes and regulation concerns.5 This proxy of capacity has also been utilised by previous underwriting cycles studies (e.g., Choi et al., Citation2002). The policyholders’ lagged surplus, which reflects insurers’ capacity at the beginning of a new period, is reported at the end of the previous year from Best’s Aggregates and Averages. The net written premiums represent the company’s exposure during that period, and therefore could capture all of the factors that determine the overall financial risk of the insurance company. Moreover, this article utilises industry investment income ratio
as the measure of investment performance of the insurance industry. This ratio, which relates net investment income to earned premium, is traditionally used for regulation purposes and is contained in the National Association of Insurance Commissioners’ (NAIC) Insurance Regulatory Information System (IRIS). Finally, the one-year Treasury constant maturity rate, which is collected from the Federal Reserve Bulletin, is employed as the interest rates proxy in our study.
represents the descriptive statistics and the results of unit root tests of relevant variables in this study. The ADF test and PP test statistics suggest that all variables are I(1) except for combined ratio in the whole insurance industry. KPSS test statistics, however, suggest only industry capacity and investment income ratio are I(1). The overall unit root test results demonstrate the inconsistency in the integration order of variables in question and support the use of the bounds testing approach for the subsequent empirical analysis.
Table 1. Descriptive statistics.
3. Methodology
We are interested in the relationship between underwriting profits (i.e., measured by loss ratios or combined ratios), interest rates, investment income ratio and industry capacity. Evidence has shown that interest rates and loss ratios are cointegrated (e.g., Choi et al., Citation2002; Haley, Citation1993). On the other hand, an insurance company is assumed to set its underwriting policy for the upcoming year on the basis of current capacity (e.g., Berger, Citation1988). Jiang and Nieh (Citation2012) propose a more robust empirical methodology and provide evidence of the level relationship between interest rates, the capacity proxy and underwriting profits in the U.S. insurance market at whole industry level. Moreover, two crucial business activities of insurance companies, underwriting and investment, may be related to each other (e.g., Ellis, Citation1990; Zou et al., Citation2012). Therefore, we consider the following econometric specification at time t:
(1)
(1)
where
,
,
and
denote the measures of underwriting profits (i.e., measured by loss ratio or combined ratio), interest rates, the insurers’ capacity proxy and investment income ratio, respectively.
is the estimated parameter and
is the equilibrium correction term. We expect the estimated slope parameter,
, to be positive, since an increase in interest rates should also lead to an increase in loss ratios and combined ratios due to the fact the insurance price is charged based on discounted loss paid. The estimated slope parameter of the industry capacity,
, is also expected to be positive, since an appreciation of capacity causes companies to have more confidence to write more business and hence leads to an increase in loss ratios and combined ratios.
EquationEquation (1)(1)
(1) implies that there is a level long-run relationship between underwriting profits, interest rates, industry capacity and investment income ratio. According to Balke and Fomby (Citation1997), a threshold cointegration has to be considered as a two-step approach. The null of no cointegration has to be rejected first by using the Engle–Granger linear cointegration test, a test of whether threshold behaviour is present, then proceed. Although improvements have been made to construct jointly a test for non-linearity and cointegration (e.g., Enders & Siklos, Citation2001; Li & Lee, Citation2010), we still utilise the bounds test for cointegration provided by Pesaran et al. (Citation2001) to ensure our argument is more robust and convincing. This testing procedure, irrespective of the order of the underlying variables, provides profound flexibility for studying underwriting activity in the insurance industry because the loss ratio is usually assumed to be stationary (e.g., Choi et al., Citation2002; Harrington & Yu, Citation2003). Unlike other cointegration techniques which require certain pre-testing for unit roots as well as underlying variables to be integrated of order one, this bounds testing procedure provides an alternative test for examining the long-term relationship, thus could reduce the degree of uncertainty arising from the pre-testing stage of each series in the analysis of levels relations. Moreover, the bounds test is still valid in small samples and can be reliably used to estimate and to test the cointegration relationship, and thus is very suitable in the insurance context (e.g., Jiang & Nieh, Citation2012; Tian, Jiang, Pan, & Zhang, Citation2018).
Once the null that there is no level relationship is rejected by the bounds testing procedure, the ADL test for the threshold cointegration technique advanced by Li and Lee (Citation2010) will proceed in this article. This test relaxes the assumption of a pre-specified cointegrating vector and considers estimating the cointegrating vector. Therefore, it is suitable to conduct this technique as there is no economic information to obtain a previously known cointegration vector. This test is also free of nuisance parameters, thus a bootstrap procedure is not required, and critical values of the proposed tests are tabulated by Li and Lee (Citation2010). Similar to the bounds testing procedure, the ADL test for threshold cointegration is undertaken as a single-equation conditional model which requires the condition of weak exogeneity. Such an assumption is intuitively reasonable because the underwriting activity of the non-life insurance industry has few impacts on the macroeconomic system (e.g., movement of interest rates). Also, the current capacity, which is calculated by using non-life insurance companies’ surplus at the end of previous calendar year, should not be explained by the current underwriting profits (Jiang & Nieh, Citation2012). The representation of a single-equation conditional model allows contemporaneous innovations and only a unique error correction term will be present, which avoids confusion from having multiple cointegration vectors.
Consider the indicators with , the threshold ADL regression model of insurance underwriting activities is described as follows:
(2)
(2)
where
is the residual, and
if the error correction term
and
otherwise. The threshold value, denoted by
, is given by the
th percentile of the empirical distribution of
. Most important, the adjustment speeds towards the long-run equilibrium as measured by
(
= 1, 2, 3, 4, 5, 6, 7, 8) are allowed to vary in the threshold model. Thus, the conventional ADL model is a special case of the threshold ADL model when
,
,
and
. Li and Lee (Citation2010) recommend a BO-type test (Boswijk, Citation1994) for threshold cointegration, that is, jointly testing the coefficients of
,
,
and
under the null of no threshold cointegration.
The threshold cointegration specification allows us to uncover potential non-linearities and asymmetries in the adjustment of underwriting activities and provide more information regarding the dynamics of underwriting cycles. Notice that EquationEquation (2)(2)
(2) is based on the second autoregressive model (i.e., AR(2)). If the threshold model is based on AR(1), there will be no lagged changes terms (i.e., t – 1) in EquationEquation (2)
(2)
(2) . In this study, we shall test the data-generating process for both AR(1) and AR(2) settings in this two-regime threshold model. It is conceivable that error correction may occur in one regime only, or that error correction occurs in both regimes but at different speeds of adjustment. In the case of the insurance underwriting activity, one might expect asymmetric adjustment if insurance companies behave asymmetrically in response to the periods of soft market and hard market. We hypothesise that if underwriting profits are far beyond expectation (i.e.,
), there would be a different adjustment mechanism to portray the belief of insurance companies.
4. Empirical results
4.1. Bounds test
The main objective of this research is to investigate the dynamics of insurance companies’ underwriting activities and their behaviour. In order to make our results more general and convincing, this study first tests the absence of any level relationships between underwriting profits and their determinants. The existence of a level relationship is the basis of subsequent analyses in this article. According to Assenmacher-Wesche and Pesaran (Citation2008), the autoregressive distributed lag (ARDL) modelling approach is robust to the unit root properties of the underlying series and can be conducted as a preliminary analysis of the long-run relationships between groups of variables separately before embarking on the full system estimation. Therefore, in this paper a bounds testing procedure of the ARDL approach is conducted to test null hypotheses of no level relationships, irrespective of whether the variables are I(0) or I(1). As mentioned above, the autoregressive process is traditionally constructed to portray the dynamics of underwriting profits, such as the AR(1) process (e.g., Winter, Citation1994) or the AR(2) process (e.g., Cummins & Outreville, Citation1987). This article imposes the order of lag length from one to two and calculates the F-statistic and t-statistic. According to Pesaran et al. (Citation2001), the asymptotic distributions of the F-statistic and t-statistic are non-standard, and are much higher than the standard ones. The bounds testing procedure has two sets of asymptotic critical values. One set assumes all variables are I(0) and the other assumes that all variables are I(1). If the computed F-statistic and t-statistic fall above the upper limit of the bound critical value, then the null hypothesis is rejected. Conversely, if the computed F-statistic and t-statistic fall below the lower bound critical value, then the null cannot be rejected. Finally, the case within the bounds of critical value is inconclusive.
shows that the null hypothesis maintaining non-existence of the level relationship is rejected for both the whole insurance industry and the general liability insurance as the order of lags reaches one or two, irrespective of whether the underlying variables are I(0) or I(1). The results demonstrate that models are appropriate for both the restricted intercept and unrestricted intercept cases.6 Furthermore, it is important to note that the critical values based on larger sample size (i.e., Pesaran et al., Citation2001) may deviate significantly from those of a small sample size (i.e., Narayan, Citation2004, Citation2005). In order to check the robustness of the testing results, we conducted an additional testing procedure by using critical values from Narayan (Citation2005), which were generated for a small sample size ranging from 30 to 80 observations. The critical value bounds we used were based on two exogenous variables and 60 observations,7 and the null hypothesis maintaining non-existence of the level relationship was still rejected at the 5% significant level for both insurance lines when the order of lags reached one or two. Based on these results from the bounds test, the econometric specification that there is a level relationship between underwriting profits, interest rates and the industry capacity is valid as the basis of the ensuing threshold cointegration analysis.
Table 2. Bounds test statistics.
4.2. ADL test for threshold cointegration
After a long-run relationship has been validated, we can estimate a threshold error correction model. In this section, the ADL test for the threshold cointegration test and its estimations advanced by Li and Lee (Citation2010) is introduced. The study focuses here on the threshold ADL model with two regimes differentiated by a threshold effect in the error correction term. We are particularly interested in variations of insurance companies’ underwriting policies, especially in the regime where the underwriting profits move too far from the equilibrium. The data-generating processes of both AR(1) and AR(2) are shown in and . Based on the BO-type test results, we find that the null hypothesis of no threshold cointegration is rejected for both the whole insurance industry and the general liability insurance. Apparently, the ADL test for threshold cointegration employed in this study provides strong evidence favouring the long-run validity in which the adjustment process towards its equilibrium is asymmetric. Therefore, we could define two regimes of underwriting activities, which may be related to soft/hard markets in the insurance world. For instance, as underwriting profits are measured by combined ratios with the data-generating process AR(1), the first regime (with 63.9% of the observations for the whole insurance industry and with 83.6% for the general liability insurance) has moderate speed of adjustment and could be labelled as the ‘typical’ regime. On the contrary, when the underwriting profits move too far from equilibrium, the second regime (with 36.1% of the observations for the whole insurance industry and with 16.4% for the general liability insurance) has a sharply fast speed of adjustment and could be labelled as the ‘unusual’ regime.
Table 3. The ADL test for threshold cointegration: loss ratio.
Table 4. The ADL test for threshold cointegration: combined ratio.
As shown in and , significant negative coefficients of lagged underwriting profits reinforce the equilibrium of underwriting activity dynamics in both regimes. The short-term effect, represented by current changes or lagged changes of variables, seems to be relatively small due to their insignificant coefficients. Therefore, the error correction from the equilibrium seems to be the main effect of dynamics of underwriting profits, which makes it move more like a cycle. The dynamics of underwriting profits being cyclical may not necessarily mean that it will return to a given level of the past, and can occur around a long-term trend in profitability and availability of insurance. A visible cyclical pattern of underwriting profits could be explained as a feedback tendency to the equilibrium, rather than modelling as an AR(2) process with cyclical pattern assumptions. Moreover, all models reveal a significant positive long-run level relationship between underwriting profits, interest rates and investment income ratio. The effect of interest rates and investment income ratio on the general liability insurance is generally larger than for the whole industry because of its long-tail characteristic. Such an empirical result reveals that the longer the tail, the greater the portion of investable funds that can be acquired, thus a greater sensitivity of interest rates on underwriting profits displays.
The effect of industry capacity is significantly positive in general for an unusual regime, which is consistent with Berger (Citation1988), that is, insurance companies decide their price and quantity of supply depending on their current capacity. The more industry capacity, the more supply of insurance makes higher underwriting profits (i.e., higher loss ratios and higher combined ratios). Similarly, the effect of industry capacity on the general liability insurance is much larger than the whole industry, especially during the period of unusual regime. In order to analyse both regimes, threshold error correction models from the level relationship of underwriting activities can be re-parametrised from estimated coefficients in and . For illustration purpose only, we take the case of combined ratio with AR(1) data-generating process as examples:8
Whole insurance industry:
General liability insurance:
As shown above, there are two different regimes to portray underwriting activities of insurance companies with an adjustment above the estimated threshold much sharper than below it. Both regimes reflect different beliefs of the underwriting policy depending on different deviations from the equilibrium. In the typical regime, positive effects of interest rate, investment income ratio and insurance industry capacity on underwriting profits are moderate in terms of the magnitudes of the coefficients for both the whole insurance industry and the general liability insurance. In the unusual regime, a strikingly different story emerges that there is a stronger tendency to move towards a new equilibrium in which positive effects of interest rates, investment income ratio and the insurance industry capacity are much larger than in the typical regime. For instance, the magnitude of the capacity coefficient for the whole insurance industry in the unusual regime (16.3622) is almost six times larger than it is in the typical regime (2.8596). The magnitude of the interest rates coefficient for the whole insurance industry in the unusual regime (3.2486) is more than four times larger than it is in the typical regime (0.7103). The general liability insurance also has a similar phenomenon as the whole insurance industry. Such results indicate that when the underwriting result moves too far from expectations, the underwriting policy becomes more aggressive to allow more risk in the next period. Compared with the typical regime, positive effects on investment income ratio, capacity and interest rates sharply increasing in the unusual regime imply companies may be overconfident in believing that in the next period their capacity could afford more risk and could generate more return on the investment side. In this paper, we provide an econometric foundation about soft markets perhaps being one of the causes of aggressive pricing or understating loss reserves, which is similar with the findings of previous literature (e.g., Li & Nielson, Citation2015; Malinovskii, Citation2014; Ruml, Citation2018).
Based on empirical evidence, we may consider the possibility of the existence of overconfidence among insurance practitioners. Overconfidence is associated with the overestimation of the quality and precision of information about forecasting, with underestimation of both the volatility due to uncertainty and the probability that unfavourable events will occur. It attracts abundant attention in the academic literature, such as overreaction of investors (e.g., Daniel, Hirshleifer, & Surahmanyam, Citation1998) and bubbles of asset price (e.g., Sheinkman & Xiong, Citation2003); however, it is surprising that insurance is often ignored in this context. In the insurance world, pricing uncertainty and hence variability of supply are built into the very nature of insurance. Insurance companies have to use projection techniques to forecast and estimate ultimate losses in order to price and reserve appropriately, thus may induce possible overconfidence. McGee (Citation1986) first argues that insurance companies may differ as to their future expectations concerning losses. A company with optimistic loss forecasts may cause insurance prices to fall below the level implied by industry average forecasts. Furthermore, evidence of excessive insurance price cutting in soft markets was seen in the general liability insurance during the early 1980s (Harrington & Danzon, Citation1994) and for medical malpractice insurance during the 1990s (Harrington et al., Citation2008). From practitioners’ view, Conger and Lowe (Citation2003) note that insurance mispricing decisions are subject to actuaries’ and underwriters’ overconfidence, which comes from not knowing the limits of their knowledge. Ligon and Thistle (Citation2007) suggest insurance companies are overconfident to overweight their private information, and then predict the insurance profits change will be asymmetrical. To the best of our knowledge, this paper is the first to provide empirical evidence supporting the asymmetric adjustment of insurance profits.
Moreover, the negative coefficient of lagged underwriting profits represents the speed back to long-term equilibrium. The correction speed for the whole insurance industry in the unusual regime (–0.5748) is slightly faster than it is in the typical regime (–0.4679). As for general liability insurance, it indicates a slow adjustment to long-term equilibrium in the typical regime (–0.3324), whereas in the unusual regime the correction is almost three times faster (−0.9346). These findings exhibit that, in the unusual regime, the error correction terms respond much more noticeably to a new equilibrium, a more aggressive underwriting policy that reflects a more optimistic belief of insurance companies. To sum up, empirical evidence of this study provides that once the underwriting result turns bad (i.e., moves too far from the expectation), insurance companies will engage a more excessive risk-taking strategy for the upcoming period.
5. Concluding remarks
The investigation of speculative behaviour in insurance markets, compared with equity markets, is still underdeveloped in the literature. By taking into account asymmetries in departures from the long-run equilibrium relationship, the ADL test for the threshold cointegration approach is designed to capture empirically the characteristics of cycles in insurance markets. The results are in line with the prediction of Ligon and Thistle (Citation2007) in which the underwriting profits should be cyclical and change asymmetrically. Possible explanations of asymmetric adjustments are that insurance companies may not have the same degree of information perception and their expectations may be heterogeneous. Consequently, the interaction between these different insurance companies can imply delays and asymmetries in loss ratio/combined ratio adjustment and introduce a visualised cycle in the insurance market. A limitation of the current study is that the impact from global reinsurance markets, which may also be subject to cyclical dynamics (Cummins, Citation2005; Cummins & Weiss, Citation2009), has not yet been considered in this context. It would be interesting to extend the analysis in the hope of capturing indirect links between primary insurers’ underwriting activities and reinsurers’ strategies. We leave this to future research.
In the current study, the threshold behaviour of the U.S. insurance market has been evidenced, that is, positive impacts of interest rates, investment income and insurance capacity in the unusual regime are more pronounced than those in the typical regime, due to their significantly larger coefficients in the unusual regime. The decreasing insurance profits induce risk-seeking herding behaviour to attain higher profits, thus boosting speculation. Generally, during the period of unusual regime, investment income has relatively weaker and insignificant effects on insurance profits, which is consistent with the findings that investment income is weakly related to underwriting gain or loss (Ellis, Citation1990) and has no significant impacts on underwriting risk (Zou et al., Citation2012). Such a result provides some useful insights that the insurance industry may have overlooked the correlation between underwriting and investment activities and may have largely conducted investment strategy in isolation from underwriting, which can lead to the assumption of excessive risk relating to the same source (Achleitner, Biebel, & Wichels, Citation2002). Based on these findings, monitoring of both underwriting and investment decisions is necessary. Insurance companies should adopt an integrated approach of underwriting with consideration of investment policies, and should enhance the ability to counterbalance volatile underwriting results through the steering of investment income in order to alleviate the threshold behaviour of insurance companies.
This study has provided several implications for insurance practitioners and regulators. First, to gain a competitive hold in a soft market by cutting prices or relaxing underwriting criteria is indeed a gamble. It might make insurance companies appear profitable in the short term but cause greater loss exposures and have to pay more claims in the future, especially for general liability insurance. Therefore, to prevent aggressive risky decisions, insurance companies need to build up their own ADL threshold model to monitor their own underwriting policy. During a period of unusual regime, insurance companies should be more conservative and should be willing to sustain a possible loss of market share by exercising underwriting discipline. Second, according to Pesaran and Smith (Citation2016) the autoregressive distributed lag modelling can reduce forecast uncertainty and is useful for conducting counterfactual analysis. Therefore, insurance companies could evaluate the effectiveness of their policies, such as pricing decisions, investment and underwriting policies, or capital allocation strategies, by using their own autoregressive distributed lag specifications. Third, the government should maintain disciplined underwriting policies of insurance companies for improving the economic efficiency of insurance supply and avoiding irrational pricing strategies. To prevent destructive competition, regulators are responsible for determining whether the insurance prices and insurance companies’ capacity are adequate as well as taking into account the macroeconomic indicators to determine the stage of underwriting cycle. Fourth, more than 100% combined ratio is traditionally used as an indicator for a soft market (Bruneau & Sghaier, Citation2015). The ADL threshold model in this study, by contrast, provides an objective indicator for unusual underwriting activities and could be utilised as an early warning predictor of the next round of soft market. Finally, insurance companies should determine underwriting strategies and pricing decisions based on their own financial status. As the underwriting result turns bad, it would be advisable to utilise risk-financing tools, such as reinsurance or alternative risk transfer products, in order to avoid systemic risky behaviour.
Disclosure statement
No potential conflict of interest was reported by the authors.
Notes
1 The underwriting profits at time t, , could be expressed as:
with cyclical assumptions:
,
, and
.
2 The rational expectations/institutional intervention model (Cummins & Outreville, Citation1987) provides an AR(2) process. Winter’s (Citation1994) capacity constraint model implies an AR(1) process. Higgins and Thistle (Citation2000) report an AR(1) process when capacity is high and AR(2) process when capacity is low. See Harrington, Niehaus, & Yu (2013) for a review.
3 In the U.S., the combined ratio is the sum of loss ratio and expense ratio. The loss ratio is the ratio of loss and loss adjustment expense incurred to earned premium in a calendar year. The expense ratio is the ratio of unallocated expense to written premium in a calendar year.
4 In this study, the general liability insurance includes medical malpractice insurance, products liability insurance, and all other commercial liability insurance except auto liability insurance.
5 According to the National Association of Insurance Commissioners’ regulatory test in the U.S., a Kenney ratio greater than three is considered unfavourable.
6 There are two cases of intercept. One is restricted intercept and the other is unrestricted intercept. See Pesaran et al. (Citation2001).
7 For the restricted intercept case, critical value bounds of F-statistics is (3.288, 4.070) at the 5% level. For the unrestricted intercept case, critical value bounds of F-statistics is (4.000, 5.057) at the 5% level. See Narayan (Citation2005).
8 All the other three cases have similar implications as this case.
References
- Achleitner, P. M., Biebel, J. H., & Wichels, D. (2002). Does WTC matter for the investment policy of p/c insurance companies? Geneva Papers on Risk and Insurance - Issues and Practice, 27(2), 275–282. doi:10.1111/1468-0440.00169
- Assenmacher-Wesche, K., & Pesaran, M. H. (2008). A VECX model of the Swiss economy, CESifo working paper, 2281, Center for Economic Studies and Ifo Institute (CESifo), Munich.
- Balke, N., & Fomby, T. (1997). Threshold cointegration. International Economic Review, 38, 627–645. doi:10.2307/2527284
- Berger, L. A. (1988). A model for the underwriting cycle in the property-liability insurance industry. The Journal of Risk and Insurance, 55(2), 298–306. doi:10.2307/253330
- Boswijk, H. P. (1994). Testing for an unstable root in conditional and structural error correction models. Journal of Econometrics, 63, 37–60.
- Boyer, M. M., Jacquier, E., & Norden, S. V. (2012). Are underwriting cycles real and forecastable? Journal of Risk and Insurance, 79(4), 995–1015. doi:10.1111/j.1539-6975.2011.01458.x
- Bruneau, C., & Sghaier, N. (2015). Cyclicity in the French property-liability insurance industry: New findings over the recent period. Journal of Risk and Insurance, 82(2), 433–462. doi:10.1111/jori.12027
- Choi, S., Hardigree, D., & Thistle, P. D. (2002). The property-casualty insurance cycle: A comparison of alternative models. Southern Economic Journal, 68(3), 530–548. doi:10.2307/1061716
- Conger, R., & Lowe, S. (2003). Managing overconfidence. Emphasis, 3, 6–9.
- Cummins, J. D., & Outreville, F. (1987). An international analysis of underwriting cycles in the property-liability insurance. The Journal of Risk and Insurance, 54(2), 246–262. doi:10.2307/252856
- Cummins, J. D., & Danzon, P. M. (1997). Price, financial quality, and capital flows in insurance markets. Journal of Financial Intermediation, 6(1), 3–38. doi:10.1006/jfin.1996.0205
- Cummins, J. D. (2005). Convergence in wholesale financial services: Reinsurance and investment banking. The Geneva Papers on Risk and Insurance - Issues and Practice, 30(2), 187–222. doi:10.1057/palgrave.gpp.2510031
- Cummins, J. D. (2007). Reinsurance for natural and man-made catastrophes in the United States: Current state of the market and regulatory reforms. Risk Management and Insurance Review, 10(2), 179–220. doi:10.1111/j.1540-6296.2007.00115.x
- Cummins, J. D., & Weiss, M. A. (2009). Convergence of insurance and financial markets: Hybrid and securitized risk-transfer solutions. Journal of Risk and Insurance, 76(3), 493–545. doi:10.1111/j.1539-6975.2009.01311.x
- Daniel, K., Hirshleifer, D., & Subrahmanyam, A. (1998). Investor psychology and security market over- and underreactions. The Journal of Finance, 53(6), 1839–1885. doi:10.1111/0022-1082.00077
- Ellis, P. M. (1990). Underwriting profits and investment income in the U.S. property/casualty insurance industry. The Journal of Insurance Issues and Practices, 13, 87–96.
- Enders, W., & Siklos, P. (2001). Cointegration and threshold adjustment. Journal of Business & Economic Statistics, 19(2), 166–176. doi:10.1198/073500101316970395
- Engle, R. F., & Granger, C. W. J. (1987). Cointegration and error correction: Representation, estimation and testing. Econometrica, 55(2), 251–276. doi:10.2307/1913236
- Ericsson, N. R., & MacKinnon, J. G. (2002). Distributions of error correction tests for cointegration. The Econometrics Journal, 5(2), 285–318. doi:10.1111/1368-423X.00085
- Feldblum, S. (2007). Underwriting cycles and insurance solvency. Casualty Actuarial Society Discussion Paper Program, Casualty Actuarial Society.
- Gron, A. (1994). Capacity constraints and cycles in property-casualty insurance markets. The Rand Journal of Economics, 25(1), 110–127. doi:10.2307/2555856
- Haley, J. (1993). A cotintegration analysis of the relationship between underwriting margins and interest rates: 1930-1989. The Journal of Risk and Insurance, 60(3), 480–493. doi:10.2307/253039
- Haley, J. (2007). Further considerations of underwriting margins, interest rates, stability, stationarity, cointegration, and time trends. Journal of Insurance Issues, 30, 62–75.
- Harrington, S. E., Danzon, P. M., & Epstein, A. J. (2008). Crises” in medical malpractice insurance: Evidence of excessive price-cutting in the preceding soft market. Journal of Banking & Finance, 32(1), 157–169. doi:10.1016/j.jbankfin.2007.09.009
- Harrington, S. E., & Danzon, P. (1994). Price-cutting in liability insurance markets. The Journal of Business, 67(4), 511–538. doi:10.1086/296645
- Harrington, S. E., Niehaus, G., & Yu, T. (2013). Insurance price volatility and underwriting cycles. In: Handbook of Insurance. New York: Springer New York.
- Harrington, S. E., & Yu, T. (2003). Do property and liability insurance underwriting margins have unit roots? Journal of Risk and Insurance, 70(4), 715–753. doi:10.1046/j.0022-4367.2003.00072.x
- Higgins, M., & Thistle, P. D. (2000). Capacity constraints and the dynamics of underwriting profits. Economic Inquiry, 38(3), 442–457. doi:10.1111/j.1465-7295.2000.tb00028.x
- Jiang, S., & Nieh, C. C. (2012). Dynamics of underwriting profits: Evidence from the U.S. insurance market. International Review of Economics & Finance, 21(1), 1–15. doi:10.1016/j.iref.2011.03.005
- Lloyds. (2007). Annual Underwriter Survey. Retrieved from http://www.lloyds.com/∼/media/lloyds/news/news%20centre%20gallery/2007/02/lloyds_underwriter_survey_report_2007_pdf.
- Li, J., & Lee, J. (2010). ADL test for threshold cointegration. Journal of Time Series Analysis, 31, 241–254. doi:10.1111/j.1467-9892.2010.00659.x
- Li, Z., & Nielson, N. (2015). Solvency analysis and prediction in property–casualty insurance: Incorporating economic and market predictors. Journal of Risk and Insurance, 82, 97–124.
- Ligon, J. A., & Thistle, P. D. (2007). A behavioral model of insurance pricing. Journal of Insurance Issues, 30, 46–61.
- Malinovskii, V. K. (2014). Reflexivity in competition-originated underwriting cycles. Journal of Risk and Insurance, 81(4), 883–906. doi:10.1111/j.1539-6975.2013.01527.x
- McGee, R. (1986). The cycle in property-casualty insurance. Federal Reserve Bank of New York Quarterly Review. Autumn, 22–30.
- Narayan, P. K. (2004). Reformulating critical values for the bounds F-statictics approach to cointegration: An application to the tourism demand model for Fiji. Monash University, Discussion Paper, 02/04.
- Narayan, P. K. (2005). The saving and investment nexus for China: Evidence from cointegration tests. Applied Economics, 37(17), 1979. doi:10.1080/00036840500278103
- Pesaran, M. H., Shin, Y., & Smith, R. J. (2001). Bounds testing approaches to the analysis of long-run relationship. Journal of Applied Econometrics, 16(3), 289–326. doi:10.1002/jae.616
- Pesaran, M. H., & Smith, R. P. (2016). Counterfactual analysis in macroeconometrics: An empirical investigation into the effects of quantitative easing. Research in Economics, 70, 262–280. doi:10.1016/j.rie.2016.01.004
- Rao, B. B. (2007). Estimating short and long-run relationships: A guide for the applied economist. Applied Economics, 39(13), 1613–1625.
- Rubin, H. W. (2008). Dictionary of insurance terms. NY: Barron's Educational Series.
- Ruml, D. (2018). A quantitative study of the effect of the insurance underwriting cycle on United States insurance company impairment. EPH-International Journal of Business & Management Science, 4(1), 70–86.
- Sheinkman, J. A., & Xiong, W. (2003). Overconfidence and speculative bubbles. Journal of Political Economy, 111, 1183–1219. doi:10.1086/378531
- Stewart, B. D. (1984). Profit cycles in property-liability insurance. In J. D. Long & E. D. Randall, (ed.), Issues in Insurance (3rd ed. vol. 1). Malvern, PA: American Institute for Property and Liability Underwriters.
- Tian, L., Jiang, S., Pan, G., & Zhang, N. (2018). Nonlife insurance price dynamic: Evidence from the Chinese insurance market. Economic Research-Ekonomska Istraživanja, 31(1), 171–187. doi:10.1080/1331677X.2018.1424557
- Tetin, I. A. (2016). Underwriting cycles and competition impact in evaluation of insurance company’s effective strategy. Bulletin of the South Ural State University. Ser. Computer Technologies, Automatic Control & Radioelectronics, 16(4), 155–161. doi:10.14529/ctcr160419
- Webb, B. L., Harrison, C. M., & Markham, J. J. (2002). Insurance operations and regulation. American Institute for Chartered Property Casualty Underwriters.
- Weiss, M. A. (2007). Underwriting cycles: A synthesis and further directions. Journal of Insurance Issues, 30, 31–45.
- Winter, R. (1994). The dynamics of competitive insurance markets. Journal of Financial Intermediation, 3(4), 379–415. doi:10.1006/jfin.1994.1011
- Zou, H., Wen, M. M., Yang, C. C., & Wang, M. (2012). Underwriting and investment risks in the property-liability insurance industry: Evidence prior to the 9–11 event. Review of Quantitative Finance and Accounting, 38(1), 25–46. doi:10.1007/s11156-010-0217-9